← Back to the plain-language case
Abstract calls the frontoparietal TE-entropy association positive; Results, Discussion and Figure 5C show it negative
Hum Brain Mapp (2025) · doi:10.1002/hbm.70427 · PMC12720285
Summary
The abstract reports "a positive association between TE and entropy in the frontoparietal network (p = 7.03e-3)". The Results section reports the same test on the same network, with the same p-value, and says the association was negative. The Discussion also says negative and builds its interpretation on that sign. In Figure 5C, the only network bar marked significant (FPN) lies on the negative side, at a beta of about −0.5 when measured from the published image. A reader who sees only the abstract gets the direction of this result reversed. The paper's main group-difference findings do not depend on it.
What the paper reports
Abstract (results sentences):
There was a positive association between TE and entropy in the frontoparietal network (p = 7.03e-3).
Results, section "Association Between Transition Energy and Entropy":
At the network level, TE was negatively associated with entropy in the frontoparietal network (BH corrected p-value = 7.03e-3).
Discussion, section "Association Between Regional TE and Entropy":
At the network level, a negative association was observed within the frontoparietal network. A negative TE and entropy association in the frontoparietal network implies that loss of entropy (i.e., less complexity) could be linked to higher energetic demands to switch from or to the frontoparietal network, a network that is critical for rapid and accurate behavioral performance (Marek and Dosenbach 2018).
Figure 5 legend, panel C:
(C) The beta estimates from the linear model adjusted for age, sex, and ICV were used to represent the amplitude and the direction of the association between network-wise TE and network-wise entropy. The frontoparietal control network (marked with an asterisk) was significant after multiple comparison p-value corrections.
Materials and Methods, "Statistical Analysis":
The p-values obtained with multiple comparisons for the region, network, and state-wise analysis were corrected using the Benjamini-Hochberg method.
What the paper's own numbers show
Method. The text gives no coefficient for the network-level association, only its direction and a p-value. I compared three things: (1) the direction word and p-value in each of the three statements; (2) the sign of the FPN bar in Figure 5C, measured in pixels from the published image (HBM-46-e70427-g003.jpg) and calibrated against the x-axis tick labels "−0.4", "0" and "0.4" (calibrated once from each side of zero, because the minus sign shifts the "−0.4" label, and reported as a range); and (3) whether choosing which variable is the outcome could reverse the sign. For (3) I ran 2,000 simulated datasets (n = 554, with age, sex and ICV-like covariates) and fitted the regression both ways. A two-sided p-value is the same for t and −t, so p = 7.03e-3 says nothing about direction. recompute.py.txt prints every number below.
| Quantity | Location | Reported | Recomputed |
|---|---|---|---|
| Direction of FPN TE-entropy association | Abstract | positive, p = 7.03e-3 | contradicted by the three rows below |
| Direction of FPN TE-entropy association | Results | negative, BH corrected p = 7.03e-3 | negative |
| Direction of FPN TE-entropy association | Discussion | negative, with an interpretation of the negative sign | negative |
| FPN network-level beta (the only asterisked bar) | Figure 5C | bar, no value printed | β ≈ −0.51 to −0.48 (from image), sign negative |
| p-value in Abstract vs Results | Abstract, Results | 7.03e-3 and 7.03e-3 | identical: the same test |
| Sign change when outcome and predictor are swapped (OLS with covariates) | simulation | — | 0 of 2,000 |
Two minor labelling points, separate from the main finding:
| Quantity | Location | Reported | Recomputed |
|---|---|---|---|
| Group sizes | Abstract vs Figure 1 legend | Abstract: "Four hundred ninety-nine HC and 55 MCI"; Figure 1 legend: "(499 MCI and 55 HC)" | the Figure 1 legend swaps the two groups |
| Aβ-entropy association in MCI | Abstract vs Figure 6C | Abstract: "ρ = 0.632, p = 0.041"; Figure 6C: linear-model "estimate: 0.632", "p-value: 0.041" | the same number; the abstract labels a regression estimate as ρ |
Figure
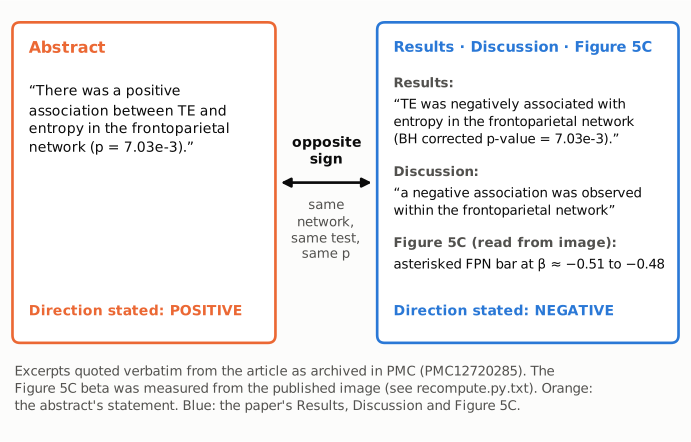
The two panels hold short verbatim excerpts. The left panel, in orange, is the abstract's statement. The right panel, in blue, holds the Results and Discussion statements and the beta measured from Figure 5C. All describe the network-level association between transition energy (TE) and entropy in the frontoparietal network, from a linear model adjusted for age, sex and ICV, with the same p-value (7.03e-3). Only the abstract gives a positive direction. The Figure 5C value (β ≈ −0.51 to −0.48) was measured from the published image by recompute.py.txt. The paper's own figure is not reproduced here.
Why it matters
The abstract is the part of a paper that is indexed, quoted and used when screening for systematic reviews. As it stands, the abstract tells readers that higher transition energy goes with higher entropy (more complex activity) in the frontoparietal network. The paper's own analysis shows the reverse. The Discussion makes the point explicitly: lower entropy goes with higher energetic demand to switch to or from that network. Significance is unaffected, because changing the sign of a regression coefficient leaves its p-value unchanged. The effect size is unaffected too, since the text reports none.
Several things do not depend on this result. They are the paper's headline findings (lower limbic-network TE in MCI, adjusted p = 0.028; lower global entropy in MCI, p = 7.29e-7; the global Aβ-entropy association in MCI), the key findings listed at the start of the Discussion, and the Conclusion. The error is limited to how the abstract reports one secondary, exploratory result. It is still a reversal of direction in the abstract, though, and readers who rely on abstracts cannot detect it.
Explanations considered
- A different test, network or subgroup. Ruled out. The abstract and the Results name the same network, give the same p-value and describe the same network-level linear model. Statistical Analysis describes a single set of covariate-adjusted, BH-corrected models. Nothing in the text says the abstract refers to a subgroup (MCI only or HC only), and no other frontoparietal TE-entropy test is reported.
- Direction of the regression (TE on entropy, or entropy on TE). Ruled out. With the same covariates, both OLS slopes have the sign of the partial correlation. In 2,000 simulated datasets, swapping outcome and predictor never changed the sign.
- A sign convention in Figure 5C. Ruled out. The legend says the betas show "the amplitude and the direction of the association". The asterisked FPN bar lies on the negative side of zero, at about −0.5.
- An error in the body rather than the abstract. Unlikely. The Results text, the Discussion's interpretation and Figure 5C all agree on negative. Only the abstract differs.
- A conversion or archiving artefact. Ruled out. The same wording appears in the Europe PMC JATS XML and on the live PMC page. The bioRxiv preprint (doi:10.1101/2025.06.19.660545, PMC12262368) has the same two sentences, positive in the abstract and negative in Results, both with p = 7.03e-3. The mismatch was carried into the published version unchanged.
- Resolved in the supplement or by a correction. No. The supporting information (
HBM-46-e70427-s001.docx) has Figures S1–S8, and from their captions none covers the network-level TE-entropy association. No correction notice was found (see Status).
Status
- Version of record. The publisher's page (onlinelibrary.wiley.com, reached through the DOI) returned HTTP 403 to automated requests. I checked the publisher-supplied JATS full text in Europe PMC and the live PMC HTML page. Both contain the abstract sentence ("positive") and the Results sentence ("negatively") exactly as quoted. Every quotation above was checked verbatim against the PMC-archived text with
src/show.py. The Figure 5C bar positions and tick labels, and the Figure 6C "estimate" and "p-value" labels, were read from the published figure images on the PMC CDN. - Supplements. There is one supporting-information file,
HBM-46-e70427-s001.docx. According to its caption list, Figures S1–S8 cover clustering choices, the T parameter, PET group differences, PET associations and group TE differences. None covers the network-level TE-entropy association, which is settled by the main-text Figure 5C. The preprint's Europe PMC full text was also checked. - Corrections and comments. As of 2026-10-24 I found no correction, erratum, retraction or expression of concern.
src/known.pyreturns no Crossref update relations, no PMC notices and no Europe PMC notices. The Europe PMC record (PMID 41427478) lists only an "Update of" link to the bioRxiv preprint. PubPeer's API returned HTTP 403 to automated requests. A web search for the title together with PubPeer, erratum or correction found no thread or notice. - Sources. PMC article PMC12720285; Europe PMC full-text XML for PMC12720285 and for the preprint PMC12262368; figure images
HBM-46-e70427-g003.jpg(Figure 5) andHBM-46-e70427-g001.jpg(Figure 6); Crossref; Europe PMC; PubPeer; https://doi.org/10.1002/hbm.70427; bioRxiv doi:10.1101/2025.06.19.660545.
Suggested correction
In the abstract, replace
There was a positive association between TE and entropy in the frontoparietal network (p = 7.03e-3).
with
There was a negative association between TE and entropy in the frontoparietal network (BH corrected p = 7.03e-3).
so that the abstract agrees with the Results, the Discussion and Figure 5C. Reporting the FPN beta and its confidence interval in the text would let readers check direction and size without measuring the figure. The authors may also wish to correct two smaller points. The Figure 1 legend should read "499 HC and 55 MCI". The Aβ-entropy result in the abstract should be labelled as a regression estimate (β = 0.632) rather than ρ, since Figure 6C reports 0.632 as the linear-model estimate.