← Back to the plain-language case
Abstract reports lower Ct values in vaccinated participants; the paper's data and text show higher
Lancet Reg Health Am (2025) · doi:10.1016/j.lana.2025.101309 · PMC12703870
Summary
The Findings section of the Abstract states that vaccinated participants had "significantly lower RT-qPCR Ct values" than placebo recipients. The Results report the opposite: mean Ct was higher in the vaccinated group for both serotypes, by 5.0 cycles for DENV-1 (27.2 vs 22.2) and 2.9 cycles for DENV-2 (28.2 vs 25.3), and the Research in context panel, the Discussion, Fig. 2a/2i and Supplementary Table 6 all agree with the Results. Because the paper defines Ct as inversely related to the amount of viral nucleic acid, the Abstract's wording implies more viral RNA in vaccinated participants, which contradicts both the data and the conclusion drawn in the same sentence ("the vaccine could be reducing viral replication"). The error is confined to one word in the Abstract, but it reverses the direction of the paper's main virological finding in the part of the paper most often read on its own.
What the paper reports
Abstract, Findings:
Despite the limited statistical power due to the low number of samples, we observed significantly lower RT-qPCR Ct values in the vaccinated group, particularly for the DENV-1 cases, suggesting that the vaccine could be reducing viral replication.
Research in context, "Added value of this study":
Additionally, we observed higher RT-qPCR Ct values in the vaccinated group compared to the placebo group, indicating a lower viral load among vaccinated participants and suggesting that the Butantan-DV is initially effective in reducing viral loads.
Results, "Characterization of RT-qPCR cycle threshold values":
RT-qPCR cycle threshold (Ct) values indirectly measure DENV genomic load in samples, with an inverse relationship to the input target nucleic acid. Our analysis included a total of 365 DENV-positive samples, with an overall mean Ct of 23.7 (SD: 4.85) for DENV-1 (n = 161) and 26.5 (SD: 4.67) for DENV-2 (n = 205). When comparing RT-qPCR Ct values between the Pb and Vx groups for each serotype, a statistically significant difference was observed (p < 0.001). The Vx group exhibited a higher mean Ct value than the Pb group. Specifically, the mean Ct for DENV-2 was 28.2 (SD: 4.18) in the Vx group compared to 25.3 (SD: 4.65) in the Pb group. This trend was even stronger for DENV-1, with the mean Ct being 27.2 (SD: 3.98) in the Vx group compared to 22.2 (SD: 4.40) in the Pb group (Fig. 2a and i) (Supplementary Table S6).
Discussion, fourth paragraph:
The higher Ct values observed in the vaccinated group, therefore, suggest that Butantan-DV-induced immunity may confer protection not only by preventing infection, but also by mitigating disease severity through the suppression of viral replication.
Results, "Sample characterization":
There were 234 (64.1%) participants included in the Pb group and 131 (35.8%) participants in the Vx group confirmed for DENV.
Supplementary Table 6 ("Comparative analysis of cycle threshold (Ct) values for DENV-1 and DENV-2 between vaccinated and placebo groups"; columns: N positive Placebo | Butantan-DV | mean Ct Placebo | Butantan-DV | Δ mean | t-statistic | p-value | Cohen's d):
DENV-1 | 113 | 48 | 22.2 | 27.2 | 5.00 | 10.87 | < 0.001 | 1.16
DENV-2 | 122 | 83 | 25.3 | 28.2 | 2.90 | 6.21 | < 0.001 | 0.86
Its footnote reads:
The p-value and t-statistic were calculated using the Welch's t-test for unequal variances.
What the paper's own numbers show
Method. I took the group means and SDs from the Results text and the group sizes from Supplementary Table 6. I computed the vaccinated-minus-placebo difference in mean Ct for each serotype and checked whether rounding of the printed means (to 0.1) could change its sign. To rule out swapped group labels in the body, I checked that the n-weighted combination of the two group means reproduces the overall mean the Results report for each serotype, and compared that with the combination obtained if the labels were swapped. I then recomputed a Welch t-test, its 95% CI and Cohen's d from the summary statistics. Every number below is printed by recompute.py.txt.
| Quantity | Location | Reported | Recomputed from the paper's numbers |
|---|---|---|---|
| Direction, all serotypes | Abstract, Findings | "significantly lower RT-qPCR Ct values in the vaccinated group" | Opposite to every number below |
| DENV-1 mean Ct, Vx vs Pb | Results; Suppl. Table 6 | 27.2 (SD 3.98) vs 22.2 (SD 4.40); Δ 5.00 | Vx − Pb = +5.0 cycles (+4.9 to +5.1 allowing for rounding): vaccinated higher |
| DENV-2 mean Ct, Vx vs Pb | Results; Suppl. Table 6 | 28.2 (SD 4.18) vs 25.3 (SD 4.65); Δ 2.90 | Vx − Pb = +2.9 cycles (+2.8 to +3.0): vaccinated higher |
| DENV-1 overall mean and SD | Results | 23.7 (SD 4.85), n = 161 | With Table S6 n (48 Vx, 113 Pb): 23.69 (SD 4.84). Labels swapped: 25.71 |
| DENV-2 overall mean and SD | Results | 26.5 (SD 4.67), n = 205 | With Table S6 n (83 Vx, 122 Pb): 26.47 (SD 4.68). Labels swapped: 27.03 |
| Vaccinated share implied by overall means | Results | 131 Vx of 365 | 0.300 × 161 + 0.414 × 205 ≈ 133.1 Vx, close to the 131 in Table S6 and the Results |
| DENV-1 difference, 95% CI and test | Results "p < 0.001"; Table S6 | p < 0.001 | Welch 95% CI +3.6 to +6.4; t = 7.06 (df 97.4), p = 2.4 × 10⁻¹⁰ |
| DENV-2 difference, 95% CI and test | Results "p < 0.001"; Table S6 | p < 0.001 | Welch 95% CI +1.7 to +4.1; t = 4.66 (df 187.9), p = 6.0 × 10⁻⁶ |
| Meaning of the direction | Results | Ct has "an inverse relationship to the input target nucleic acid" | Higher Ct in Vx = less viral RNA in Vx, as stated in Research in context and the Discussion |
The body of the paper is internally consistent: the group means, overall means, group sizes, Fig. 2a and 2i (boxplots in which the vaccinated group sits above placebo for both serotypes) and Supplementary Table 6 all describe higher Ct in vaccinated participants. Neither CI comes near zero, so the reversed direction in the Abstract cannot be a matter of rounding or of a borderline result.
Four smaller inconsistencies turned up during the check. None of them affects the direction or the significance of the difference:
| Quantity | Location | Reported | Recomputed |
|---|---|---|---|
| Welch t-statistic | Suppl. Table 6 | 10.87 (DENV-1), 6.21 (DENV-2) | 7.06 and 4.66 from the printed means, SDs and n; p stays below 0.001 |
| Cohen's d, DENV-2 | Suppl. Table 6 | 0.86 | 0.65 with the pooled SD (4.47); DENV-1 reproduces (1.17 vs 1.16) |
| Group counts | Suppl. Table 6 vs Results | 113 + 122 = 235 placebo; 161 + 205 = 366 serotype results | Results give 234 placebo and 365 samples (difference of one) |
| Test used for the Ct comparison | Methods vs Suppl. Table 6 | Methods and Fig. 2 legend: Wilcoxon rank-sum; Table S6: Welch t-test | Both tests are reported as p < 0.001 |
Figure
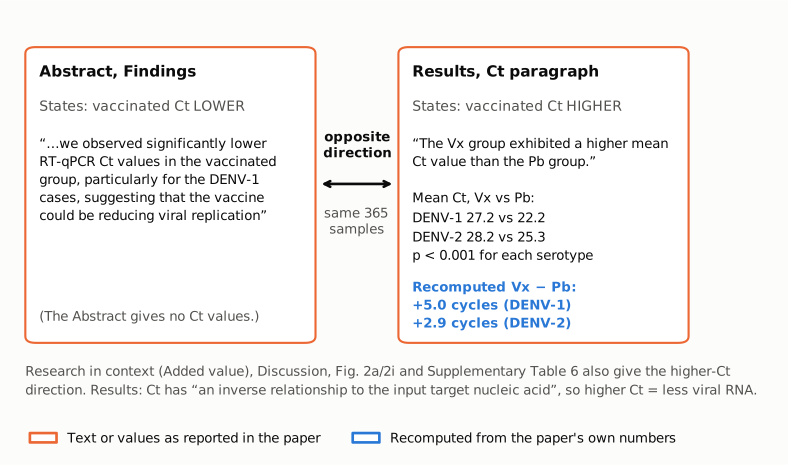
Figure 1. The two statements of the vaccinated-vs-placebo Ct comparison, quoted from the Abstract (Findings) and from the Results ("Characterization of RT-qPCR cycle threshold values"). Orange outlines mark text and values as reported in the paper; blue text is the difference recomputed from the Results means. The Abstract states that Ct was lower in the vaccinated group; the Results, which describe the same 365 samples, state and show that it was higher, by 5.0 cycles for DENV-1 and 2.9 cycles for DENV-2. The other places in the paper that give a direction (Research in context, Discussion, Fig. 2a/2i, Supplementary Table 6) agree with the Results.
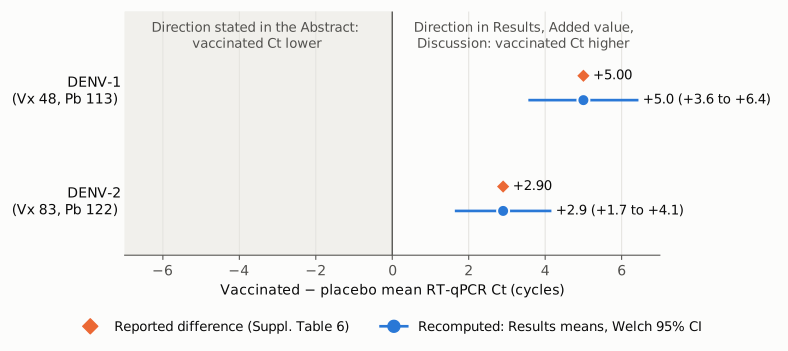
Figure 2. Difference in mean RT-qPCR Ct, vaccinated minus placebo, on one axis of Ct cycles. Orange diamonds are the differences printed in Supplementary Table 6 (5.00 and 2.90). Blue circles and lines are the differences recomputed from the Results means and SDs with the Table S6 group sizes, with Welch 95% confidence intervals (+3.6 to +6.4 and +1.7 to +4.1). The vertical line marks no difference. The shaded half is the direction the Abstract states (vaccinated Ct lower); both intervals lie entirely in the other half.
Why it matters
The Ct comparison is the only viral-load finding in the Abstract; the other findings there describe the sample, lineages and selection. Many readers, indexing services and secondary summaries rely on the Abstract alone. A reader who takes the Abstract's "significantly lower RT-qPCR Ct values in the vaccinated group" at face value would conclude that vaccinated participants with breakthrough infections carried more viral RNA than unvaccinated ones, which is the opposite of what the paper found and the opposite of the protective interpretation the paper draws.
The sentence also contradicts itself. Under the paper's own definition, lower Ct means more viral nucleic acid, so "lower Ct" cannot support "the vaccine could be reducing viral replication". A reader who knows the Ct scale will notice the conflict; a reader who does not may repeat either half. Press coverage of the study (for example Agência FAPESP) reported reduced viral load in vaccinated participants, which matches the body of the paper, so I found no sign that the reversed wording has been repeated, but the Abstract is the text that remains attached to the article in PubMed, Europe PMC and the publisher's site.
The error does not affect the size, significance or interpretation of the result in the body of the paper, nor its main phylogenetic conclusions (no lineage linked to breakthrough infections, no positive selection, similar intra-host mutation rates), which do not depend on Ct.
Explanations considered
- The Abstract refers to a different metric, such as viral load or ΔCt. This does not account for the text. The Abstract names "RT-qPCR Ct values" explicitly, and "lower viral load" is the phrase the paper uses elsewhere for the same finding (Research in context).
- The Abstract summarizes medians rather than means. This does not account for it. The Methods compare medians with Wilcoxon and Kruskal-Wallis tests, and the boxplots in Fig. 2a and 2i show the vaccinated group's box and median above the placebo group's for both serotypes, so medians and means point the same way.
- The Abstract summarizes a different subgroup or time window. This does not account for it. The Abstract and the Results both describe the same 365 DENV-positive samples. The analyses by days after vaccination (Fig. 2e–h and 2m–p) report no correlation and are not what the Abstract summarizes; in Fig. 2e and 2m the vaccinated curve also lies above the placebo curve over most of the range.
- The group labels are swapped in the body, and the Abstract is right. This is excluded by the paper's own numbers. With the Table S6 group sizes, the n-weighted group means reproduce the reported overall means (23.69 vs 23.7; 26.47 vs 26.5), whereas swapped labels would give 25.71 and 27.03. Fig. 2a/2i, Table S6, the Research in context panel and the Discussion all carry the same labelling.
- The Abstract uses an inverted convention for the Ct scale. This does not account for it. The paper states that Ct has "an inverse relationship to the input target nucleic acid", and the Abstract's own conclusion (reduced viral replication) only follows from higher Ct.
- A conversion or typesetting artifact in the archived text. This is excluded. The publisher's typeset PDF (Elsevier, 18 pages) carries the same word "lower" in the Summary on page 1 and "higher" on pages 2, 9 and 15, as do the PMC and Europe PMC full texts.
The remaining explanation consistent with all the evidence is that the word "lower" in the Abstract should read "higher".
Status
- Version of record. I checked the publisher's typeset PDF from the PMC Open Access dataset (PMC12703870.1; PDF metadata: creator Elsevier, "The Lancet Regional Health - Americas, 53 (2026) 101309", created 2025-11-29). It reads the same as the PMC-archived text in every passage quoted above. The publisher's web pages (thelancet.com, sciencedirect.com) refused automated access. Every quote above was confirmed verbatim against the PMC-archived text with
src/show.py, except the Supplementary Table 6 rows, which were read from the supplement file. - Supplements. The only supplement, mmc1.docx (from the Europe PMC supplementary-files bundle), was opened and its Supplementary Table 6 extracted; it is quoted above. I also viewed the publisher's Fig. 2 image (gr2.jpg) to confirm the direction of panels a, e, i and m; the figure is not reproduced here.
- Corrections and comments. As of 2026-10-23 I found no correction, erratum, expression of concern or retraction: Crossref lists no update relations for the DOI, and PMC and Europe PMC list no correction or comment links (PMID 41403717). The PubPeer API was blocked by a Cloudflare challenge, and a web search found no PubPeer entry for the DOI. A web search for the article found only press coverage.
- Sources. PMC article PMC12703870; PMC Open Access PDF (s3://pmc-oa-opendata/PMC12703870.1/PMC12703870.1.pdf); Europe PMC REST API (full text, supplementary files, metadata); Crossref; PubPeer; Agência FAPESP coverage.
Suggested correction
- In the Abstract (Findings), change "we observed significantly lower RT-qPCR Ct values in the vaccinated group" to "we observed significantly higher RT-qPCR Ct values (indicating lower viral load) in the vaccinated group". No other text, table or figure needs to change for this point.
- Minor, for Supplementary Table 6: check the Welch t-statistics (7.06 and 4.66 follow from the printed means, SDs and n, against 10.87 and 6.21 printed) and the DENV-2 Cohen's d (0.65 vs 0.86); reconcile the placebo count (113 + 122 = 235) with the 234 placebo participants and 365 samples in the Results; and state which test (Wilcoxon rank-sum, per the Methods, or Welch t, per the table) gives the reported p < 0.001.