← Back to the plain-language case
Abstract gives HIV-and-drug-use synergy the RERI that Table 2 reports for another pair
Lancet Reg Health Am (2025) · doi:10.1016/j.lana.2025.101305 · PMC12702379
Summary
The abstract's only interaction estimate says the strongest additive synergy was between HIV infection and drug use, "with a RERI of 225% [174–304%]", which is 2.25 [1.74–3.04] on the scale the tables use. Table 2 (composite unfavourable outcome) and the Results text both give the HIV & drug use RERI as 1.72 [1.28–2.28], and the row's own stratum-specific odds ratios reproduce 1.72 to 1.74. The value 2.25 [1.74–3.04], estimate and both confidence limits, is printed in Table 2 for a different pair, "Not PPL & retreatment", and that row's odds ratios reproduce it as well. So the abstract overstates the HIV and drug use estimate by about 31%, and its claim that this pair is "the strongest" does not hold for the composite outcome, where Not PPL & retreatment is larger. The corrected HIV and drug use interaction is still positive and its CI excludes 0, so the direction of the finding is unchanged.
What the paper reports
Abstract, Findings:
Interaction analyses revealed both synergistic and antagonistic effects, with the strongest additive synergy observed between HIV infection and drug use, with a RERI of 225% [174–304%].
Results, "Interactions among vulnerabilities impacting ATT outcomes", first paragraph (composite unfavourable outcome):
Particularly noteworthy was the synergistic interaction between HIV infection & drug use, which substantially elevated the risk beyond their independent effects on the additive scale (RERI = 1.72 [95% CI: 1.28–2.28]), however the ME indicated an antagonist effect (0.85 [0.81–0.89]).
Table 2, "Interaction effects of overlapping vulnerabilities on composite unfavorable ATT outcomes" (columns: RERI | AP | SI | multiplicative scale; the empty columns of each row are omitted):
HIV & drug use | 1.72 [1.28–2.28] | 0.28 [0.23–0.32] | 1.5 [1.4–1.62] | 0.85 [0.81–0.89]
Effect of HIV among non-drug users (A+ | B-) | 2.99 [2.71–3.3]
Effect of drug use among non–HIV (B+ | A-) | 2.42 [2.22–2.63]
Effect of HIV among drug users (A+ | B+) | 2.54 [2.27–2.83]
Effect of drug use among HIV (B+ | A+) | 2.05 [1.86–2.25]Not PPL & retreatment | 2.25 [1.74–3.04] | 0.49 [0.43–0.51] | 2.64 [2.48–2.81] | 1.63 [1.55–1.71]
Effect of not PPL among new cases (A+ | B-) | 1.78 [1.73–1.83]
Effect of retreatment among PPL (B+ | A-) | 1.59 [1.28–1.98]
Effect of not PPL among retreatment (A+ | B+) | 2.9 [2.78–3.02]
Effect of retreatment among not PPL (B+ | A+) | 2.6 [2.1–3.21]
("PPL" is the tables' label for people deprived of their liberty, so "Not PPL" means not incarcerated.)
Results, third paragraph (death, Table 3):
The interaction between PWH & drug use markedly increased the risk of death (RERI = 2.76 [95% CI: 1.92–3.86], no significant multiplicative interaction), consistent with the pattern observed in overall unfavorable outcomes.
Results, fifth paragraph (loss to follow-up, Table 4):
Finally, when focusing on LTFU cases, we found significant positive interactions including retreatment & not being incarcerated (RERI = 3.12 [95% CI: 2.41–4.25]; OR_INT = 1.94 [1.85–2.05], synergistic on both scales), underscoring that previously treated patients outside institutional settings face substantially increased risk of LTFU. Additionally, the interaction between living with HIV & drug use remained strongly synergistic (RERI = 1.98 [95% CI: 1.39–2.76], no significant multiplicative interaction), consistent with findings on unfavorable outcomes and mortality.
Methods, "Interaction analysis":
RERI was computed based on adjusted ORs from the GLM using the following formula:RERI = OR11 - (OR10 - OR01) + 1
What the paper's own numbers show
Method. Under each interaction row, Tables 2–4 print four stratum-specific odds ratios. (A+ | B−) is OR10 and (B+ | A−) is OR01, both against the doubly unexposed group. (A+ | B+) is OR11/OR01 and (B+ | A+) is OR11/OR10. So OR11 can be rebuilt two ways, as (A+ | B+) × OR01 and as (B+ | A+) × OR10. From the mean of the two I computed RERI = OR11 − OR10 − OR01 + 1, AP = RERI/OR11, SI = (OR11 − 1)/[(OR10 − 1) + (OR01 − 1)] and the multiplicative measure ME = OR11/(OR10 × OR01). This checks only that each row is internally consistent. Confidence intervals cannot be recomputed without the model's covariance matrix. I then converted the abstract's percentages to the tables' scale (divide by 100), compared them with every HIV & drug use estimate and with every other Table 2 row, and ranked the positive RERIs whose 95% CI excludes 0 in each table. recompute.py.txt prints every number below.
| Quantity | Location | Reported | Recomputed from the paper's numbers |
|---|---|---|---|
| RERI, HIV & drug use | Abstract | 225% [174–304%] | = 2.25 [1.74–3.04] on the tables' scale |
| RERI, HIV & drug use, composite outcome | Table 2; Results text | 1.72 [1.28–2.28] | OR11 = 2.54 × 2.42 = 6.15 or 2.05 × 2.99 = 6.13; RERI 1.73 (range 1.72–1.74); as a percentage, 172% [128–228%] |
| AP / SI / ME, HIV & drug use, composite | Table 2 | 0.28 / 1.5 / 0.85 | 0.28 / 1.51 / 0.85 (as percentages 28%, 150%, 85%, none of them 225%) |
| RERI, Not PPL & retreatment, composite outcome | Table 2 | 2.25 [1.74–3.04] | OR11 = 2.9 × 1.59 = 4.61 or 2.6 × 1.78 = 4.63; RERI 2.25 (range 2.24–2.26); ×100 = 225% [174–304%], identical to the abstract |
| AP / SI / ME, Not PPL & retreatment, composite | Table 2 | 0.49 / 2.64 / 1.63 | 0.49 / 2.64 / 1.63 |
| RERI, HIV & drug use, death | Table 3; Results text | 2.76 [1.92–3.86] | 2.77; ≠ 2.25 [1.74–3.04] |
| RERI, HIV & drug use, LTFU | Table 4; Results text | 1.98 [1.39–2.76] | 1.98 (joint OR rebuilt 6.05, as printed in Table 4); ≠ 2.25 [1.74–3.04] |
| Abstract value vs Table 2 HIV & drug use | Abstract vs Table 2 | 2.25 vs 1.72 | abstract is 30.8% higher |
| Largest positive RERI with CI excluding 0, composite | Table 2 | abstract: HIV & drug use | Not PPL & retreatment 2.25, then HIV & drug use 1.72, Not PPL & immigrants 0.61, HIV & alcohol 0.45, tobacco & alcohol 0.10 |
| Same ranking, death | Table 3 | (not stated in abstract) | HIV & drug use 2.76, then HIV & not diabetes 1.12, Not PPL & retreatment 1.03 |
| Same ranking, LTFU | Table 4 | (not stated in abstract) | Not PPL & retreatment 3.12, then HIV & drug use 1.98, Not PPL & immigrants 0.79 |
All five rebuilt rows agree with the printed RERI, AP, SI and ME to within 0.01. So the tables are internally consistent, and the discrepancy lies between the abstract and the tables.
Figure
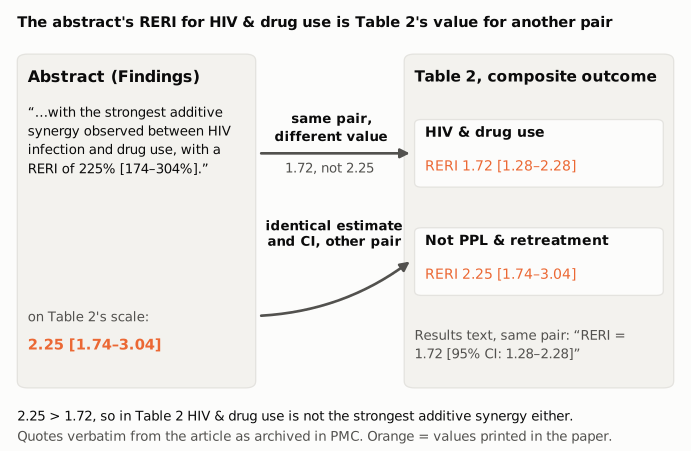
Figure 1. The abstract sentence (left) and the two Table 2 rows it could refer to (right), quoted from the article as archived in PMC. The abstract attributes 225% [174–304%], which is 2.25 [1.74–3.04] on the table's scale, to HIV infection and drug use. Table 2 and the Results text give 1.72 [1.28–2.28] for that pair. The abstract's estimate and both confidence limits are identical to the Table 2 row "Not PPL & retreatment" (not incarcerated and retreatment case). Because 2.25 is larger than 1.72, the abstract's "strongest additive synergy" also does not describe HIV and drug use on the composite outcome. Orange marks values printed in the paper.
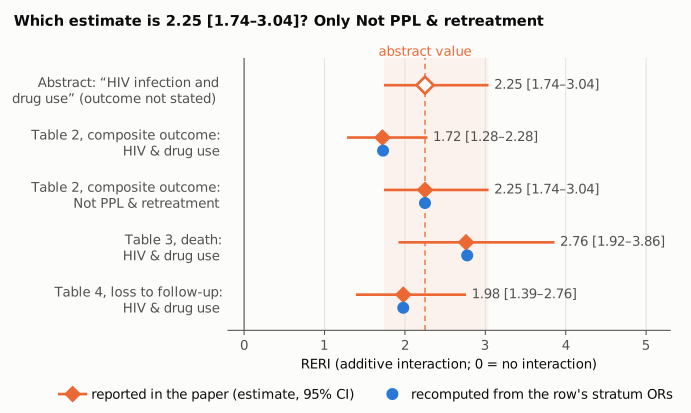
Figure 2. Every RERI estimate the paper prints for HIV and drug use, together with the Table 2 Not PPL & retreatment row and the abstract value, on one linear RERI axis (0 = no additive interaction, thin vertical line). Orange diamonds and bars are the estimates and 95% CIs as printed. The hollow diamond is the abstract figure divided by 100. Blue circles are point estimates that recompute.py.txt rebuilds from each row's stratum-specific odds ratios; CIs cannot be rebuilt from the published numbers. The dashed line and shaded band mark the abstract's estimate and interval. Only the Not PPL & retreatment row matches them exactly. None of the three HIV and drug use estimates (composite 1.72, death 2.76, LTFU 1.98) does.
Why it matters
The abstract sentence is the only quantitative interaction result the abstract gives. It reports the analysis the title names ("multivariate modelling with excess risk"), so readers who see only the abstract or an index entry will take it as the headline finding. As printed, it says that HIV infection with drug use adds an excess of 225% of the baseline odds beyond the sum of the two separate effects, and that this is the largest such excess in the study. The paper's own tables say three things instead:
- For the composite outcome the HIV and drug use excess is 1.72 [1.28–2.28]. The abstract's figure is about 31% higher, and its interval is shifted upward (1.74–3.04 against 1.28–2.28).
- For the composite outcome, and for loss to follow-up, the largest additive interaction is between not being incarcerated and being a retreatment case (2.25 and 3.12), not HIV and drug use. HIV and drug use is the largest significant RERI only for death (2.76), and that is not the number the abstract quotes.
- For the composite outcome, the multiplicative measure for HIV and drug use is below 1 (0.85 [0.81–0.89]), which the Results describe as "an antagonist effect". The abstract's "strongest ... synergy" holds on the additive scale only.
What survives is the qualitative conclusion. HIV and drug use show a positive additive interaction with a CI that excludes 0 for all three outcomes. The Interpretation and Research in context statements that this combination raises the risk of death and loss to follow-up beyond the separate effects are consistent with Tables 3 and 4. The error concerns the size of the headline estimate, its interval and the ranking claim, not the direction of the finding.
Explanations considered
- The abstract refers to a different outcome. The abstract sentence does not name the outcome. The paper's other HIV and drug use estimates are 2.76 [1.92–3.86] for death (Table 3) and 1.98 [1.39–2.76] for loss to follow-up (Table 4). Neither equals 2.25 [1.74–3.04]. This does not explain the number.
- A different scale or measure. Multiplying 1.72 [1.28–2.28] by 100 gives 172% [128–228%]. The other measures in the same row, AP 0.28, SI 1.5 and ME 0.85, give 28%, 150% and 85%. None of them is 225%. This does not explain the number.
- The Table 2 value 1.72 is the typo, and 2.25 is correct for HIV and drug use. The row's four stratum-specific odds ratios reproduce RERI 1.72–1.74, AP 0.28, SI 1.51 and ME 0.85, and the Results text independently prints 1.72 [1.28–2.28]. Rebuilding the row with the abstract's 2.25 would need OR11 ≈ 6.66, which neither (A+ | B+) × OR01 nor (B+ | A+) × OR10 gives. The table value is the one supported by the paper's numbers.
- A coincidental match. The abstract's estimate and both confidence limits (three numbers to two decimals) equal the Table 2 Not PPL & retreatment row, whose own stratum odds ratios reproduce 2.25 together with AP 0.49, SI 2.64 and ME 1.63. A three-number coincidence is implausible. The most direct reading is that the value from one Table 2 row was attached to another row's label. The write-up makes no claim about how this happened.
- A different version of the article. PubMed (PMID 41399540), Europe PMC and the PMC copy, all derived from the publisher's XML, carry the same abstract sentence and the same Table 2. A conversion artefact in one archive does not account for it.
- The Methods formula. As printed, the Methods formula reads "OR11 - (OR10 - OR01) + 1", which for HIV and drug use would give 6.57, not 2.25. The tables follow the standard OR11 − OR10 − OR01 + 1. This is a separate typographical point and does not produce the abstract value.
A separate observation, outside the claim above: the Results text cites the "Not PPL & immigrants" interaction as "RERI = -0.61 [95% CI: -0.08 to (-1.02)]" and calls it antagonistic, whereas Table 2 prints 0.61 [0.08–1.02], AP 0.22, SI 1.53. The table therefore shows a positive interaction for that pair.
Status
As of 2026-10-24:
- Version of record. The abstract sentence and Table 2 were checked in the PMC article page and the Europe PMC full-text XML, both supplied by the publisher. The PubMed record (PMID 41399540) and the Europe PMC abstract carry the same sentence, "RERI of 225% [174-304%]". The publisher's own landing pages could not be read: doi.org redirects to Elsevier linkinghub, which returned only a redirect stub, and thelancet.com returned HTTP 403.
- Supplement. mmc1.pdf (15 pages: Supplementary Methods, Supplementary Tables 1–11, Supplementary Figure 1) contains no interaction or RERI analysis ("RERI" does not appear in it), so it cannot settle the discrepancy. No source data or code is deposited.
- Corrections. None found. Crossref shows no update-to or updated-by relation. Crossref Labs, which carries the Retraction Watch data, lists no updates. PMC and Europe PMC show no correction, erratum, retraction or expression-of-concern notice, and the PubMed record lists no comment or correction links. A web search found no correction notice.
- PubPeer. A web search found no PubPeer thread. A direct check was not possible: pubpeer.com returned HTTP 403 to a DOI search, and the API endpoint queried returned "Not Found".
Suggested correction
In the abstract (Findings), replace
with the strongest additive synergy observed between HIV infection and drug use, with a RERI of 225% [174–304%].
with wording that matches Table 2, for example:
with significant additive synergy between HIV infection and drug use (RERI 1.72 [1.28–2.28]) and the largest additive interaction between non-incarceration and retreatment (RERI 2.25 [1.74–3.04]).
Alternatively, if the authors intended to refer to mortality, where HIV and drug use is the largest significant interaction, the sentence could name that outcome and quote RERI 2.76 [1.92–3.86] (Table 3). Separately, the Methods formula should read RERI = OR11 − OR10 − OR01 + 1, and the Results text for Not PPL & immigrants should match the sign printed in Table 2.