← Back to the plain-language case
Abstract calls a non-significant subgroup difference at seroconversion significant; Results and Table 3 report none
Diabetologia (2025) · doi:10.1007/s00125-025-06573-6 · PMC12686032
Summary
This DIPP cohort analysis compares 1334 children with islet autoimmunity in three groups: an affected first-degree relative (FDR) at birth (FDR+, n = 145), an FDR diagnosed during follow-up (FDR− FDR+, n = 87), and no affected FDR (FDR−, n = 1102). The abstract's Results state that at seroconversion both FDR+ and FDR− FDR+ children were "significantly more often positive for GADA and multiple autoantibodies" than FDR− children. The paper's own Table 3 gives non-significant results for the FDR− FDR+ group: GADA OR 1.3 (95% CI 0.9, 2.1), p = 0.201, and multipositivity OR 1.5 (0.9, 2.4), p = 0.106. The Results text and the Discussion both say this group did not differ from FDR− children at seroconversion, and a recomputation from the Table 2 counts agrees (p = 0.19 and 0.11). The abstract is the only place where the claim appears. A reader who sees only the abstract could reasonably conclude that a family history arising after birth already marks a distinct autoantibody profile at seroconversion, which the body of the paper does not show.
What the paper reports
Text is quoted from the PubMed Central archive, which writes the group label as "FDR- FDR+" with a hyphen; the version of record typesets it with a minus sign (FDR− FDR+).
Abstract, Results:
At seroconversion, both FDR+ and FDR- FDR+ children were significantly more often positive for GADA and multiple autoantibodies than children without affected FDRs (FDR-).
Results, fourth paragraph (beginning “We compared the islet autoantibody profiles”):
At seroconversion, there was a statistically significant difference between the three groups for GADA positivity and multipositivity (Table 2). In pairwise comparisons, at seroconversion, FDR+ children had a higher risk for GADA positivity and multipositivity than FDR- children, but no difference was observed between FDR- FDR+ and FDR- children (Table 3).
Table 3, "At seroconversion" rows (columns: FDR+ vs FDR− | p value | FDR− FDR+ vs FDR− | p value; footnote: "Values are OR (95% CI) by logistic regression analysis"):
GADA+ | 1.5 (1.1, 2.2) | 0.020 | 1.3 (0.9, 2.1) | 0.201
Multipositive | 1.8 (1.2, 2.6) | 0.002 | 1.5 (0.9, 2.4) | 0.106
Table 2, "At seroconversion" rows (columns: FDR+ (n=145) | FDR− FDR+ (n=87) | FDR− (n=1102) | p value; data are % (n); footnote: "The exact χ2 test was used for categorical variables"):
GADA+ | 62.8 (91) | 59.8 (52) | 52.5 (578) | 0.036
Multipositive | 35.2 (51) | 31.0 (27) | 23.3 (257) | 0.004
Discussion, seventh paragraph (beginning “In terms of the timing of type 1 diabetes in the FDRs”):
FDR- FDR+ children did not differ from FDR- children at seroconversion, but showed a significantly higher risk of being positive for IAA, GADA, IA-2A or multiple autoantibodies during the follow-up period than FDR- children (Table 3).
Methods, "Statistical analyses":
The standard normal distribution (SND) test was used for pairwise comparisons of categorical variables. Logistic regression analysis was used to estimate the risk of various islet autoantibody profiles and progression to type 1 diabetes in children with and without an FDR with the disease.
Abstract, Conclusions/interpretation (for comparison; this sentence does not mention the FDR− FDR+ group):
At seroconversion, genetically susceptible children who had one or more FDRs with type 1 diabetes, especially an affected father, were more often positive for GADA and multiple islet autoantibodies.
What the paper's own numbers show
Method. From the Table 2 counts I rebuilt each 2×2 table (group vs FDR−; positive vs not positive) at seroconversion. For each I computed the unadjusted odds ratio with a Woolf 95% CI and Wald p value. These are exactly what a logistic regression of the outcome on a single group indicator gives, and the Methods name no covariates. I also computed the pooled two-proportion z test (the "SND test" named in the Methods), Fisher's exact test, the likelihood-ratio test and the Yates-corrected χ² test, and repeated the three-group χ² tests from Table 2. Every number below is printed by recompute.py.txt.
| Quantity | Location | Reported | Recomputed from the paper's numbers |
|---|---|---|---|
| Group sizes | Abstract; Table 2 | 145 / 87 / 1102; total 1334 | 145 + 87 + 1102 = 1334 |
| GADA+ at seroconversion, FDR− FDR+ vs FDR− | Table 2; Table 3 | 59.8% (52) vs 52.5% (578); OR 1.3 (0.9, 2.1), p = 0.201 | 52/87 vs 578/1102; OR 1.35 (0.86, 2.10); Wald p = 0.189; SND p = 0.188; Fisher p = 0.220; LR p = 0.186 |
| Multipositive at seroconversion, FDR− FDR+ vs FDR− | Table 2; Table 3 | 31.0% (27) vs 23.3% (257); OR 1.5 (0.9, 2.4), p = 0.106 | 27/87 vs 257/1102; OR 1.48 (0.92, 2.38); Wald p = 0.106; SND p = 0.104; Fisher p = 0.117; LR p = 0.114 |
| GADA+ at seroconversion, FDR+ vs FDR− | Table 3 | OR 1.5 (1.1, 2.2), p = 0.020 | 91/145 vs 578/1102; OR 1.53 (1.07, 2.18); p = 0.020 |
| Multipositive at seroconversion, FDR+ vs FDR− | Table 3 | OR 1.8 (1.2, 2.6), p = 0.002 | 51/145 vs 257/1102; OR 1.78 (1.23, 2.58); p = 0.002 |
| Three-group test, GADA+ at seroconversion | Table 2 | p = 0.036 (exact χ²) | Pearson χ² = 6.71, df 2, p = 0.035 |
| Three-group test, multipositive at seroconversion | Table 2 | p = 0.004 (exact χ²) | Pearson χ² = 11.31, df 2, p = 0.004 |
| Abstract statement on FDR− FDR+ vs FDR− at seroconversion | Abstract, Results | "significantly more often positive for GADA and multiple autoantibodies" | not significant on either measure under any of the tests above; both 95% CIs include 1 |
The two disputed cells of Table 3 reproduce from Table 2: the odds ratios and intervals match to the printed precision, and the p values are close (printed 0.201, recomputed 0.189 for GADA; printed 0.106, recomputed 0.106 for multipositivity). The body of the paper is internally consistent. Only the abstract sentence departs from it.
Side observation, not part of the error. When every Table 3 cell is recomputed in the same way from the Table 2 counts, six other cells do not reproduce (rule applied in recompute.py.txt, section 7: the recomputed OR, rounded to one decimal, differs from the print by more than 0.1, or the p value differs by more than 0.05). Five are in the FDR− FDR+ vs FDR− column: IAA+ at seroconversion (printed 1.3 (0.8, 2.1), p = 0.181; recomputed 1.52 (0.97, 2.39), p = 0.070), IA-2A+ at seroconversion (printed 1.0 (0.5, 1.6), p = 0.937; recomputed 0.95 (0.52, 1.75), p = 0.869), ZnT8A+ at seroconversion (printed 0.8 (0.3, 1.5), p = 0.484; recomputed 0.89 (0.43, 1.81), p = 0.739), GADA+ during follow-up (printed 2.8 (1.1, 3.7), p = 0.021; recomputed 2.05 (1.12, 3.76), p = 0.020) and ZnT8A+ during follow-up (printed 1.2 (0.8, 1.8), p = 0.361; recomputed 1.48 (0.96, 2.30), p = 0.077). One is in the FDR+ vs FDR− column: ZnT8A+ during follow-up (printed 1.2 (0.8, 1.7), p = 0.227; recomputed 1.21 (0.86, 1.71), p = 0.278). For GADA+ during follow-up, the printed estimate 2.8 is far from the geometric midpoint of its interval (1.1, 3.7), which is 2.0, while the recomputed OR is 2.05; this suggests a typographical slip in the point estimate. None of these six changes which side of p = 0.05 a result falls on, and none bears on the abstract sentence.
Figure
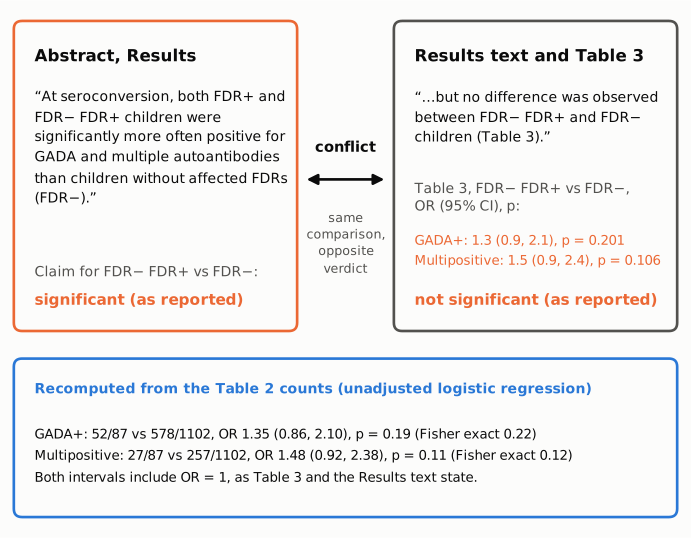
Figure 1. The left panel quotes the abstract's claim that FDR− FDR+ children were significantly more often GADA-positive and multipositive at seroconversion than FDR− children. The right panel quotes the Results sentence and the Table 3 estimates for the same comparison, which are non-significant. Values the paper reports are in orange. The blue panel gives the estimates recomputed from the Table 2 counts (unadjusted logistic regression, equivalent to the 2×2 odds ratio), with Fisher exact p values for comparison. Both recomputed intervals include OR = 1.
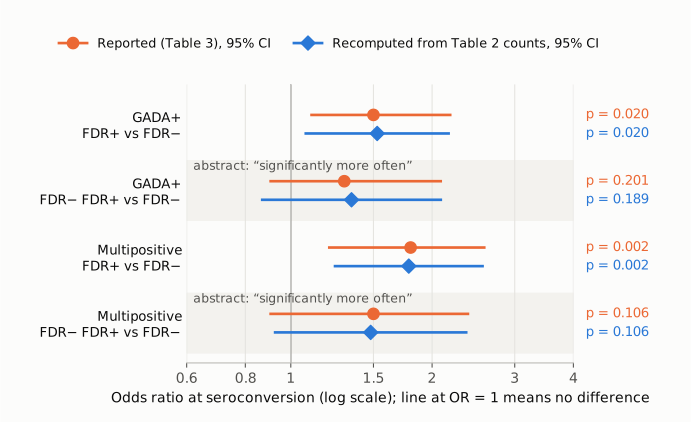
Figure 2. Odds ratios with 95% confidence intervals for the four pairwise comparisons at seroconversion, on a log scale with a thin reference line at OR = 1 (no difference). Orange circles show Table 3 as printed; blue diamonds show the values recomputed from the Table 2 counts, with the p value for each printed at the right. The two shaded rows are the FDR− FDR+ comparisons, which the abstract calls significant but Table 3 and the Results text do not. In both, the printed and the recomputed intervals cross 1. The two unshaded FDR+ rows, which the abstract also mentions, are significant and reproduce.
Why it matters
- The error is in the most-read part of the paper. The abstract is what most readers, indexers and citing authors see. Nothing in the abstract signals that the FDR− FDR+ comparison was non-significant, so a reader of the abstract alone cannot detect the problem.
- It changes a substantive interpretation. The FDR− FDR+ group is the paper's way of asking whether a family history that appears only after birth goes with a different autoimmune process. The abstract's sentence implies that these children already differ at the very start of islet autoimmunity. The paper's own analysis, and its Discussion, say instead that they differ from FDR− children only later, during follow-up.
- The headline conclusions are not affected. The FDR+ vs FDR− differences at seroconversion (p = 0.020 and 0.002) reproduce. So do the follow-up differences, the higher progression rates (55.9% vs 57.5% vs 38.9%), the shorter time to diabetes in FDR+ children, and the paternal vs maternal comparison. The abstract's Conclusions sentence does not name the FDR− FDR+ group; its wording (“had one or more FDRs”, “especially an affected father”) matches the paper's definition of the at-birth FDR+ group and is consistent with the body under that reading.
- Direction is unchanged, significance is not. The FDR− FDR+ point estimates are above 1 (GADA 59.8% vs 52.5%; multipositive 31.0% vs 23.3%), and they are close to the FDR+ estimates (FDR− FDR+ vs FDR+: Fisher p = 0.68 and 0.57). The data are therefore compatible with a modest difference, but the study cannot show one for this group of 87 children: the intervals run from about 0.9 to over 2. "Significantly more often" overstates what the analysis supports.
Explanations considered
- An adjusted model that would make the comparison significant. The Methods describe logistic regression with no covariates, and Table 3's footnote says only "by logistic regression analysis". The unadjusted odds ratios from the Table 2 counts reproduce the two disputed Table 3 cells (printed 1.3 and 1.5, recomputed 1.35 and 1.48; printed p = 0.201 and 0.106, recomputed 0.189 and 0.106). No adjusted analysis is reported anywhere in the paper or supplement. This does not account for the claim.
- A different pairwise test. The Methods name the SND test for pairwise comparisons of categorical variables. It gives p = 0.188 and 0.104. Fisher's exact test (0.220, 0.117), the likelihood-ratio test (0.186, 0.114) and the Yates-corrected χ² test (0.228, 0.135) are all non-significant too. Even a one-sided SND test, which the paper does not use, gives p = 0.094 and 0.052. This does not account for the claim.
- The three-group tests in Table 2. The exact χ² tests across all three groups are significant (p = 0.036 and 0.004; recomputed 0.035 and 0.004). An omnibus test shows only that the three groups are not all equal. It does not establish that each family-history group differs from FDR−, and the Results text itself moves from the omnibus result to pairwise comparisons that find "no difference" for FDR− FDR+. This does not account for the sentence, which makes a claim about each group ("both … were").
- A pooled reading ("children with any affected FDR"). If the 145 FDR+ and 87 FDR− FDR+ children are pooled (n = 232), the comparison with FDR− is significant (GADA OR 1.46 (1.09, 1.95), p = 0.011; multipositive OR 1.67 (1.23, 2.26), p = 0.001). The paper reports no pooled analysis, and the sentence names both groups separately. This could explain how a looser summary arose, but it does not make the sentence as written correct.
- A text-conversion artifact. The sentence was checked against the publisher's typeset PDF (Diabetologia (2026) 69:93–102) and the Europe PMC full-text XML. It reads the same in both, and the Table 3 values and Results sentence also match. Not an artifact.
- A supplement that reports a different analysis. The electronic supplementary material (ESM Methods and ESM Tables 1–4) covers HLA genotypes, father/mother/sibling splits and the multipositive subset. It contains no FDR− FDR+ vs FDR− comparison at seroconversion for the full cohort. It does not resolve the conflict.
Status
- Version of record. The abstract sentence, the Results sentence, Table 2 and Table 3 were compared with the publisher's typeset PDF, which is headed "Diabetologia (2026) 69:93–102", carries the same DOI, and is hosted by the University of Oulu repository (https://oulurepo.oulu.fi/handle/10024/59105), and with the Europe PMC full-text XML. All quoted passages are identical to the PMC archive. The publisher's own article page could not be loaded by automated access, which met a login or verification step.
- Supplement. 125_2025_6573_MOESM1_ESM.pdf (9 pages: ESM Methods, ESM Tables 1–4) was reviewed and does not change the comparison.
- Corrections and notices. No correction, erratum, retraction or expression of concern was found. Crossref lists no updates for the DOI, PubMed Central and Europe PMC list no notices, and the Europe PMC record (PMID 41204978) has no linked comments or corrections.
- PubPeer and the web. A web search for the title and DOI with "correction", "erratum" and "PubPeer" found no correction, PubPeer thread or published comment. PubPeer's own search could not be queried directly, because it required human verification, so a PubPeer thread cannot be fully ruled out.
- Checked as of 2026-10-23.
Suggested correction
In the abstract's Results, replace
At seroconversion, both FDR+ and FDR− FDR+ children were significantly more often positive for GADA and multiple autoantibodies than children without affected FDRs (FDR−).
with
At seroconversion, FDR+ children were significantly more often positive for GADA and multiple autoantibodies than children without affected FDRs (FDR−), whereas FDR− FDR+ children did not differ significantly from FDR− children (GADA OR 1.3 [95% CI 0.9, 2.1]; multipositivity OR 1.5 [0.9, 2.4]).
No change to the Results, Tables or Discussion is needed for this point. Separately, the authors may wish to check the six cells of Table 3 listed above (five in the FDR− FDR+ column, one in the FDR+ column) that do not reproduce from the Table 2 counts. One example is GADA+ during follow-up, printed as 2.8 (1.1, 3.7), where the counts give 2.05 (1.12, 3.76).