← Back to the plain-language case
Reported nationwide energy, cost and CO2 savings are 1,000 times what the paper's inputs give
Nat Commun (2025) · doi:10.1038/s41467-025-64962-2 · PMC12575868
Summary
The paper simulates an electrochromic smart window in office buildings in all 50 U.S. states and reports an average HVAC saving of 26.72 MJ/m² against low-e glass. It then applies that saving to the 97 billion ft² of U.S. commercial floor space and reports, in the Abstract, Results and Discussion, a nationwide saving of 66.87 billion MWh, worth $2.67–7.35 trillion and avoiding 0.87–66.94 billion t of CO2. The paper's own two inputs give 26.72 MJ/m² × 9.01 × 10⁹ m² = 2.41 × 10¹¹ MJ, which is 66.9 million MWh (66.9 TWh). The reported figure is 999.8 times larger, and the cost and CO2 totals, which Supplementary Eqs. S10–S11 compute from it, are 1,000 times too large as well: they should be about $2.7–8.4 billion and 0.87–67 million t. These totals are the abstract's headline impact claim. The reported energy figure is about 16 times all U.S. utility-scale electricity generation, so no reading of the inputs makes it possible.
What the paper reports
Abstract:
Simulations indicate that a large-scale deployment across the U.S. can save 66.87 billion MWh, amounting to $7.35 trillion, and reduce CO2 emissions by 66.94 billion tons.
With its rapid switching, long-term durability, and scalability, this device presents significant economic and environmental advantages for real-world applications.
Results, section "HVAC energy-saving capabilities as building smart windows", paragraph 4 (the "54" after "2018" is the citation to reference 54, the EIA Commercial Buildings Energy Consumption Survey):
As shown in Table S7 (Supplementary Information), the average energy savings across U.S. states is calculated to be 26.72 MJ m-2. The U.S. Energy Information Administration (EIA) reported that the total commercial building area in the U.S. was about 97 billion square feet in 201854, allowing for a calculation of total energy savings across the country to be as high as 66.87 billion MWh.
The economic costs of producing this large amount of electricity using nuclear, coal, gas, photovoltaic, onshore, and offshore wind power generation systems are estimated to range from $2.67 trillion to $7.35 trillion (Fig. 7d and Table S8, Eq. S10, Supplementary Information).
Even clean energy sources, like nuclear, photovoltaic, and wind, produce 0.87 billion tons of CO2, while coal, a highly polluting energy source, has an astounding 66.94 billion tons of CO2 emissions.
It holds significant economic and environmental value, aiding in energy conservation, emission reduction, and achieving net-zero energy buildings globally.
Discussion, paragraph 1:
The smart window consistently displayed higher energy efficiency across all states in the U.S., with an average value of 26.72 MJ m⁻². If implemented nationwide in office buildings, it is estimated to save 66.87 billion MWh of electricity. Depending on the power generation methods, the savings would translate into electricity costs ranging from $2.67 trillion to $7.35 trillion and a reduction in carbon emissions of between 0.87 billion and 66.94 billion tons.
Methods, building energy simulation:
A year-long simulation of monthly building energy consumption was performed for Phoenix, Arizona, along with an annual analysis of building energy consumption across various climate zones in all 50 U.S. states to investigate regional impacts.
Supplementary Information (MOESM1), Table S8 and Eqs. S10–S11. The equations are C = LCOE × E / 10¹² (trillion USD) and T = f × E / 10¹² (billion t CO2), "where … LCOE = levelized cost of electricity (USD/MWh), f = CO2 emission factor (kg CO2/MWh), and E = electricity consumption (MWh)". Table S8 lists the following LCOE (USD/MWh), cost (trillion USD), emission factor (kg/MWh) and CO2 (billion t): Nuclear 110 / 7.35 / 13 / 0.87; Coal 105 / 7.02 / 1001 / 66.94; Gas CCGT 60 / 4.01 / 486 / 32.50; Solar PV 55 / 3.68 / 43 / 2.88; Wind onshore 40 / 2.67 / 13 / 0.87; Wind offshore 125 / 8.36 / 13 / 0.87. The source data file (MOESM3, sheet "Fig. 7d") gives the same costs and CO2 totals.
All quotes from the article were checked verbatim against the PMC-archived text. The supplementary passages were read in the publisher's MOESM1 file.
What the paper's own numbers show
Method. I took the 50 per-state savings from Supplementary Table S7 and checked their mean and that each equals the low-e value minus the device value. I converted the stated floor area with the exact factor 1 ft² = 0.09290304 m², multiplied, and converted with 1 MWh = 3,600 MJ. I then applied the paper's own Eqs. S10–S11 and the Table S8 LCOE and emission factors to the recomputed energy. For scale, the recomputed and reported totals are compared with two EIA figures: U.S. utility-scale generation in 2023 and total energy use in U.S. commercial buildings in 2018. All calculations are in recompute.py.txt.
| Quantity | Location | Reported | Recomputed |
|---|---|---|---|
| Mean annual HVAC saving, 50 states | Results; Discussion; Table S7 | 26.72 MJ/m² | 26.716 MJ/m² (mean of the 50 rows; each row = low-e − device) |
| U.S. commercial floor area | Results (ref. 54) | 97 billion ft² | 97 × 10⁹ × 0.09290304 = 9.0116 × 10⁹ m² |
| Nationwide annual saving, energy | — | — | 26.72 × 9.0116 × 10⁹ = 2.408 × 10¹¹ MJ |
| Nationwide annual saving, electricity | Abstract; Results; Discussion | 66.87 billion MWh (6.687 × 10¹⁰ MWh) | 6.689 × 10⁷ MWh = 66.89 million MWh (66.9 TWh) |
| Ratio reported / recomputed | — | — | 999.8 |
| Same total in kWh | — | — | 66.89 billion kWh |
| Per-area saving implied by 66.87 billion MWh | derived | — | 26,714 MJ/m², which is 489 times the largest single-state saving (54.60 MJ/m², Hawaii) and 12.8 times the largest total annual HVAC use in Table S7 (2,080.05 MJ/m², Alaska, low-e glass) |
| Cost of the saved electricity (Eq. S10) | Abstract; Results; Discussion; Table S8 | $2.67–7.35 trillion | $2.68–7.36 billion for the technologies in the stated range; $8.36 billion for offshore wind |
| CO2 associated with the saved electricity (Eq. S11) | Abstract; Results; Discussion; Table S8 | 0.87–66.94 billion t | 0.87–66.95 million t |
| Unit values implied by the text ranges | derived | $2.67–7.35 trillion; 0.87–66.94 billion t | $39.9–109.9 per MWh and 13.0–1,001 kg CO2/MWh, which match the Table S8 LCOE and emission factors. The cost and CO2 totals are therefore Eq. S10–S11 applied to 66.87 billion MWh, and carry the same factor of 1,000 |
| Offshore wind cost vs stated range (secondary) | Table S8 vs Results text | Text: "$2.67 trillion to $7.35 trillion", including offshore wind | Table S8 lists offshore wind at 8.36 (125 USD/MWh), above the stated upper end |
| Solar PV CO2 vs text (secondary) | Table S8 vs Results text | Text: "nuclear, photovoltaic, and wind, produce 0.87 billion tons" | Table S8 gives 2.88 for solar PV (43 kg/MWh) |
| Pre-revision values (peer review file, MOESM2, Table R1) | — | 24.439 MJ/m² → "61.1"; 26.72 MJ/m² → "66.87", in a row labelled "(MWh)" | 61.18 and 66.89 million MWh; the same ratio of about 1,000 (998.8 and 999.8) if the listed values are read as billion MWh, as in the paper |
| Reported total vs U.S. utility-scale generation, 2023 (EIA: 4,178 TWh) | external | 66,870 TWh | Reported = 16.0 times all U.S. generation; recomputed = 1.60% of it |
| Reported total vs energy used in U.S. commercial buildings, 2018 (EIA CBECS: 6.8 quadrillion Btu = 1,993 TWh) | external | 66,870 TWh | Reported = 33.6 times all commercial-building energy; recomputed = 3.36% of it |
The recomputed electricity figure (66.89 million MWh) and the reported one (66.87 billion MWh) agree in their leading digits and differ only in the multiplier. The small difference in the last digit is consistent with rounding of the mean saving or of the conversion factor (with the unrounded Table S7 mean, the recomputed value is 66.88 million MWh). Applying Eqs. S10–S11 to the reported E reproduces every Table S8 entry to within 0.01, so the supplement is internally consistent with the inflated E. The discrepancy enters at the conversion of the energy product to MWh.
Figure
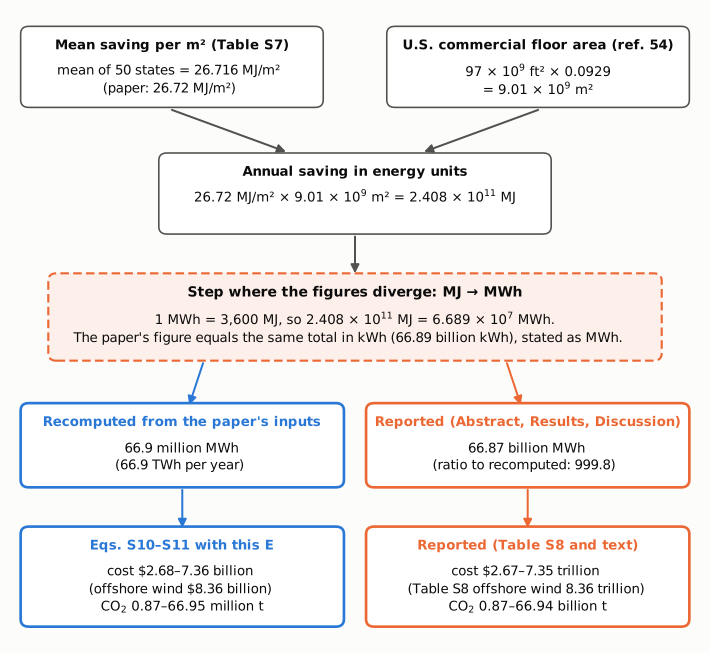
Figure 1. The arithmetic chain behind the nationwide totals, using only numbers stated in the paper and its supplement. The mean per-area saving (Table S7) and the commercial floor area (ref. 54, converted to m²) give 2.408 × 10¹¹ MJ per year. The highlighted, dashed step is the conversion to MWh. At 3,600 MJ per MWh the total is 66.9 million MWh (blue, left). The paper reports 66.87 billion MWh (orange, right), which equals the same total expressed in kWh. The bottom row applies the paper's Eqs. S10–S11 and Table S8 factors. With the recomputed energy, the costs are $2.68–7.36 billion ($8.36 billion for offshore wind) and the CO2 is 0.87–66.95 million t. The paper reports the same digits in trillions of dollars and billions of tonnes.
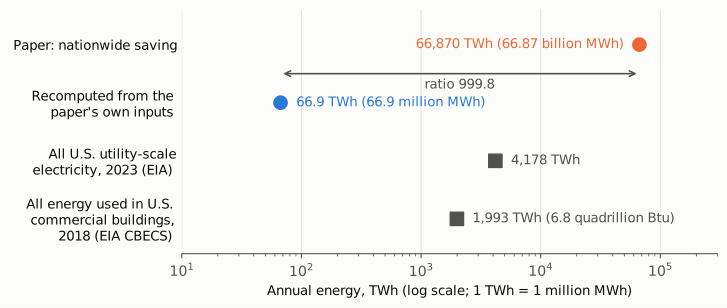
Figure 2. Annual energy on a single logarithmic axis, in TWh (1 TWh = 1 million MWh). The orange dot is the paper's reported nationwide saving (66,870 TWh). The blue dot is the value recomputed from the paper's own inputs (66.9 TWh). The ratio between them is 999.8. The gray squares are external reference points from the U.S. EIA: all U.S. utility-scale electricity generation in 2023 (4,178 TWh) and all energy used in U.S. commercial buildings in 2018 (6.8 quadrillion Btu, 1,993 TWh). The recomputed saving is 3.4% of commercial-building energy use. The reported saving is 33.6 times that use and 16 times the country's entire electricity output.
Why it matters
The nationwide totals are the only quantitative statement of the device's real-world impact in the Abstract. The abstract's closing claim of "significant economic and environmental advantages" rests largely on them, and the Results ("substantial economic and environmental benefits") and Discussion repeat them. As printed, they overstate the energy, money and CO2 saved by three orders of magnitude. A reader of the abstract would take away savings of trillions of dollars and tens of billions of tonnes of CO2 per year. These figures are larger than the entire U.S. electricity system, and the CO2 figure is larger than recent estimates of total global annual emissions. The values the paper's inputs actually support are billions of dollars and tens of millions of tonnes. That is still a meaningful result, but it is a different claim. The correct values appear nowhere in the paper or its supplement, so a reader can recover them only by redoing the calculation. Table S8, Fig. 7d and the Fig. 7d source data carry the inflated values, so anyone reusing the supplement would inherit the error.
The following are not affected: the device chemistry and electrochromic measurements (switching times of 1.6 s and 0.8 s, 64.23% optical modulation, capacity, energy recovery of 44.4% and 31.0%, cycling stability), the outdoor temperature test, the SHGC values, and the per-area EnergyPlus results (Fig. 7a–c, Tables S6–S7, including the 26.72 MJ/m² average). The direction of the comparison with low-e glass is unchanged.
Explanations considered
- Multi-year or lifetime horizon. A factor of 1,000 would need 1,000 years of annual savings. The Methods describe annual simulations, and the paper states no lifetime, discounting or multi-year multiplier anywhere. This does not explain the numbers.
- Floor area read in m² instead of ft². 26.72 MJ/m² × 97 × 10⁹ m² = 720 million MWh, a factor of 10.8 rather than 1,000. This does not explain the numbers.
- Per window area rather than per floor area. In the simulated building (20 m × 10 m floor, twelve 3 m × 2 m windows), floor area is 200 m² and window area is 72 m². Whichever area the 26.72 MJ/m² refers to, re-basing changes the total by a factor of about 3 at most, and the national window area is smaller than the national floor area. This does not explain the numbers.
- Primary vs site energy, or thermal vs electrical energy. Source-to-site multipliers for electricity are about 3, not 1,000, and the paper treats the saving directly as electricity ("save 66.87 billion MWh of electricity"). This does not explain the numbers.
- A larger building stock. The paper uses commercial floor area (and the Discussion says "office buildings", a subset). Even adding all U.S. residential floor space would multiply the area by a small single-digit factor, not by 1,000. This does not explain the numbers.
- Per-area saving larger than stated. For 66.87 billion MWh the average saving would have to be 26,714 MJ/m². That is 12.8 times the largest total annual HVAC consumption of any state in Table S7, which would mean saving more energy than the buildings use. This does not explain the numbers.
- Text-conversion artifact in PMC. The figures are written out in words ("billion MWh", "trillion", "billion tons"). They are identical in the PMC text, the publisher's HTML and the publisher's PDF, and they are carried consistently into Table S8, Fig. 7d and the source data. This does not explain the numbers.
- A kWh value labelled as MWh. The reported 66.87 is numerically the recomputed total expressed in billions of kWh (66.89 billion kWh). The pre-revision values in the peer review file show nearly the same relationship (24.439 MJ/m² gives 61.18 billion kWh; the file lists "61.1", a ratio of 998.8). This matches the numbers exactly, but it is a description of where the factor of 1,000 enters, not a justification: the paper's Eqs. S10–S11 define E in MWh and use it as MWh.
Status
As of 2026-10-23:
- Version of record. I fetched the publisher's article page (https://www.nature.com/articles/s41467-025-64962-2, published 2025-10-30) and its 12-page PDF. Both carry "66.87 billion MWh", "$7.35 trillion", "66.94 billion tons", "26.72 MJ m−2", "97 billion square feet" and "$2.67 trillion to $7.35 trillion", identical to the PMC-archived text. No correction or amendment notice appears on the page.
- Supplements. All three electronic supplementary files from the publisher were read. MOESM1 (Supplementary Information): Table S7 (50 states; mean saving 26.716 MJ/m²), Table S8, and Eqs. S10–S11 with E defined in MWh. MOESM3 (source data): sheets "Fig. 7c" (the same 50 savings) and "Fig. 7d" (the same costs in trillions and CO2 in billions of tonnes as Table S8). MOESM2 (peer review file): the added formulas (R10–R11) and a table of pre- and post-revision values ("Total energy savings across U.S. states (MWh)": 61.1 and 66.87). None of these contains a multiplier or definition that reconciles the inputs with the reported total, and none contains the correctly scaled value.
- Corrections. No correction, erratum or retraction was found. Sources: Crossref metadata for the DOI (no update-to, updated-by or relation entries), the Crossref
filter=updates:query (0 results), PMC and Europe PMC notices (none;src/known.py), and the publisher's article page (none). - PubPeer. The PubPeer search API returned a human-verification challenge and could not be queried directly. A web search for the title together with "pubpeer", "correction" or "erratum" found no thread or notice about this article.
- External reference values (used only for scale): EIA, "What is U.S. electricity generation by energy source?" (https://www.eia.gov/tools/faqs/faq.php?id=427), "about 4,178 billion kilowatthours" of utility-scale generation in 2023 (preliminary); EIA CBECS (https://www.eia.gov/consumption/commercial/), U.S. commercial buildings "consumed 6.8 quadrillion British thermal units of energy" in 2018.
Suggested correction
Abstract. Replace "can save 66.87 billion MWh, amounting to $7.35 trillion, and reduce CO2 emissions by 66.94 billion tons" with:
can save 66.9 million MWh (66.9 TWh) per year, amounting to up to $7.36 billion, and reduce CO2 emissions by up to 66.95 million tons.
Results, paragraph 4. Replace "as high as 66.87 billion MWh" with "as high as 66.9 million MWh (66.9 TWh)". Replace "from $2.67 trillion to $7.35 trillion" with "from $2.68 billion to $8.36 billion". This upper end includes offshore wind, which the sentence lists; alternatively, offshore wind can be removed from the list and the range given as $2.68–7.36 billion. Replace "0.87 billion tons" and "66.94 billion tons" with "0.87 million tons" and "66.95 million tons". For solar PV, the Table S8 factor gives 2.88 million tons, so "photovoltaic" should be dropped from the 0.87 group or given its own value.
Discussion, paragraph 1. Make the same replacements: 66.9 million MWh; $2.68–8.36 billion (or $2.68–7.36 billion); 0.87–66.95 million tons.
Supplementary Table S8 and Fig. 7d (and source data sheet "Fig. 7d"). Relabel the cost column "billions, USD" and the CO2 column "million tons" (the digits are correct for E = 66.9 million MWh to within rounding). Alternatively, keep the trillion/billion headings and divide every entry by 1,000. In Eqs. S10–S11, the stated units then become C in billion USD = LCOE × E / 10⁹ and T in million t = f × E / 10⁹, with E = 6.69 × 10⁷ MWh.