← Back to the plain-language case
Abstract calls a non-significant hemorrhage timing slope significant; the Results report a different, reproducible slope
Neurology (2025) · doi:10.1212/WNL.0000000000214184 · PMC12473174
Summary
This meta-analysis of nine observational studies (435 patients with mechanical heart valves who resumed anticoagulation after intracranial hemorrhage) uses a meta-regression on days off anticoagulation to time the restart, and its Abstract calls the inverse association with recurrent hemorrhage "significant" although the Abstract's own figures (coefficient −0.039, 95% CI −0.093 to 0.015, p = 0.13) are not significant. The Results report a different coefficient for the same analysis (−0.1094, SE 0.0517, p = 0.0345), and refitting the model from the study-level events in Figure 3A and the days off anticoagulation in Table 1 reproduces that value exactly, while no subset of studies or model variant reproduces the Abstract's coefficient with its interval. The Abstract's "50% reduction at 11 days" fits neither coefficient, and its ischemic stroke coefficient has the opposite sign to the one in the Results. The timing result is the paper's stated novelty and the basis of its 10–15 day recommendation, so the Abstract misstates the paper's central finding.
What the paper reports
The quotations are from the article as archived in PubMed Central. The archive prints minus signs as hyphens; the publisher's PDF prints the same numbers with true minus signs.
Abstract, Results:
Meta-regression demonstrated a significant inverse association between time to AC resumption and risk of recurrent ICH (regression coefficient -0.039; 95% CI -0.093 to 0.015; p = 0.13), corresponding to an approximate 50% relative reduction in risk at 11 days after ICH.
No significant time-dependent association was observed for ischemic stroke (coefficient -0.013; 95% CI -0.065 to 0.039; p = 0.61).
The pooled incidence of recurrent ICH after AC reinitiation was 11.4% (95% CI 8.2–15.6; I2 = 0%)
Abstract, Discussion:
Meta-regression suggested a lower risk of recurrent ICH with later AC resumption, with a potential risk reduction at approximately 11 days after ICH.
Methods, Statistical Analysis (the only meta-regression the paper describes):
To investigate whether the timing of VKA reinitiation influenced the risk of ischemic stroke and ICH, we performed meta-regression analyses using the number of days off AC as a continuous moderator.
Studies with zero events were handled by applying a continuity correction of 0.5 to all cells.
Results, "Recurrence of ICH After VKA Reinitiation Following ICH":
Between-study heterogeneity was low, with τ2 of 0.0365, τ of 0.1911, and I2 of 11.9% (95% CI 0.0%–53.4%).
Meta-regression analysis revealed a significant inverse association between the number of days off AC and the risk of recurrent ICH. The regression coefficient was -0.1094 (SE = 0.0517; p = 0.0345), indicating that each additional day without AC was associated with a statistically significant reduction in the log-odds of recurrence. The model explained all observed heterogeneity, and the test for residual heterogeneity was nonsignificant (p = 0.708) (Figure 3, panel B).
Using the regression model, we identified that a 25% relative reduction in risk occurred at approximately 3.4 days, a 50% reduction at 7.9 days, and a 75% reduction at 14.9 days after AC resumption.
Results, "Ischemic Stroke Before VKA Reinitiation After ICH":
Meta-regression revealed no significant association between the number of days off AC and the risk of AIS (coefficient: 0.0388, SE = 0.0765, p = 0.6123) (Figure 2, panel B).
The model predicted that a 25% increase in risk (to 5.0%) would occur after approximately 6.0 days, a 50% increase (to 6.0%) after 11.0 days, and a 75% increase (to 7.0%) after 15.2 days of AC interruption.
Results, "Time-Dependent Risk Modeling of AIS and ICH After AC Interruption":
The estimated baseline risk of ICH at day 0 was 20%, which declined progressively with longer AC interruption. A 25% risk reduction in ICH occurred at approximately 6 days, 50% at 7.9 days, and 75% at 3.4 days.
Figure 3 legend, panel C:
Key thresholds indicate when the risk drops to 75% (∼3.4 days), 50% (∼7.9 days), and 25% (∼14.9 days) of the initial value.
Discussion:
Our results suggest that the risk of ICH recurrence decreases significantly with longer AC interruption. Specifically, a 50% reduction in risk is expected at approximately 7.9 days, with a 25% and 75% reduction at 3.4 and 14.9 days, respectively.
These opposing temporal trajectories underscore a potential “window of opportunity” between 10 and 15 days after ICH where the balance of hemorrhagic and thrombotic risk may be most favorable.
In conclusion, our analysis suggests that a delay of approximately 10–15 days before resuming AC may optimize the balance between hemorrhagic and thromboembolic risk in patients with MHVs after ICH.
What the paper's own numbers show
Method. (1) For each printed coefficient with a 95% CI, I took the SE as (upper − lower) / (2 × 1.96) and the two-sided Wald p as 2·(1 − Φ(|b/SE|)). (2) I refitted the meta-regression myself. Events and totals per study come from the forest plots (Figure 3A for recurrent ICH, Figure 2A for ischemic stroke). The moderator is the "Days AC discontinued" column of Table 1. The model is an inverse-variance regression of logit proportions on days, with 0.5 added to the cells of zero-event studies, and τ² estimated by DerSimonian–Laird and by REML. As checks I also added 0.5 to every study, fitted a binomial logistic regression with no correction, dropped each study in turn, and searched every subset of three to nine studies. The inputs reproduce the paper's totals: 435 patients, 45 ICH events and 21 ischemic strokes. (3) The days to a given relative change in risk come from logit p(t) = logit p₀ + b·t, where p₀ is the day-0 risk from the model intercept. Every number below is printed by recompute.py.txt.
| Quantity | Location | Reported | Recomputed from the paper's numbers |
|---|---|---|---|
| ICH slope: CI vs "significant" | Abstract, Results | −0.039 (95% CI −0.093 to 0.015), p = 0.13, "significant" | CI contains 0; implied SE 0.0276, z = −1.42, p = 0.157 (one-sided 0.078). Not significant at 0.05, nor at the paper's 0.10 threshold for the Q test |
| ICH slope, SE, p | Results | −0.1094, SE 0.0517, p = 0.0345 | z = −2.12, p = 0.0343, 95% CI −0.211 to −0.008 |
| ICH slope refitted from Fig 3A + Table 1 | derived | — | −0.1094, SE 0.0517, p = 0.0345, τ² = 0 (DL and REML), residual QE = 4.61, p = 0.708: matches the Results exactly |
| ICH slope, other variants | derived | — | 0.5 added to all studies −0.1141 (p = 0.022); binomial GLM −0.1055 (p = 0.038); leave-one-out range −0.1215 to −0.0610 |
| ICH slope SE that the data allow | derived | Abstract implies 0.0276 | smallest SE over every subset of 3–9 studies = 0.0517; dropping studies can only widen the interval, so no subset gives the Abstract's interval |
| Abstract vs Results ICH slope | Abstract vs Results | −0.039 vs −0.1094 | ratio 2.81; SE ratio 1.88. Not a weeks/days rescaling (that would give a factor of 7, −0.766) |
| Days to 25/50/75% ICH reduction, b = −0.1094 | Results; Discussion; Fig 3C legend | 3.4 / 7.9 / 14.9 | 3.43 / 7.87 / 14.88 (day-0 risk 0.267 from the intercept) |
| Days to 50% ICH reduction | Abstract (Results and Discussion) | ~11 | 7.9 with b = −0.1094; 22.1 with b = −0.039 (17.8 on a log-risk scale). An 11-day halving would need b ≈ −0.078 |
| Same thresholds, second statement | Results, Time-Dependent Risk Modeling | 6 / 7.9 / 3.4 (25 / 50 / 75%) | the 75% value precedes the 25% value; the ICH section gives 3.4 / 7.9 / 14.9 |
| ICH day-0 risk | Results, Time-Dependent Risk Modeling | 20% | model intercept gives 26.7%; with 20%, b = −0.1094 gives 3.18 / 7.41 / 14.24 days, not 3.4 / 7.9 / 14.9 |
| Ischemic stroke slope | Abstract vs Results | Abstract −0.013 (CI −0.065 to 0.039), p = 0.61; Results +0.0388, SE 0.0765, p = 0.6123 | opposite signs; Abstract p from CI 0.624, Results p 0.612; the Results SE is 2.9 times the Abstract's |
| Ischemic stroke slope refitted from Fig 2A + Table 1 | derived | — | +0.0198 (p = 0.79); 0.5 added to all studies +0.0251; GLM +0.1139. Not +0.0388 exactly, but every variant is positive |
| Days to 25/50/75% stroke increase | Results | 6.0 / 11.0 / 15.2 (baseline 4%) | 6.02 / 10.99 / 15.24 with b = +0.0388. With the Abstract's −0.013 the risk never rises |
| Recurrent ICH I² | Abstract vs Results, Fig 3A | 0% vs 11.9% | not recomputable from the printed data; the two statements conflict |
The Results coefficient is reproduced to four decimals from the paper's own study-level data, together with its SE, its p value and the residual-heterogeneity p value. Its threshold days also follow from it. The Abstract's coefficient sits at the midpoint of its own interval, so the Abstract figures agree with one another. But they cannot come from these nine studies under the model the Methods describe, because the interval is about half as wide as the full dataset allows. Taken on their own terms they also describe a non-significant association, which the Abstract calls significant.
Figure
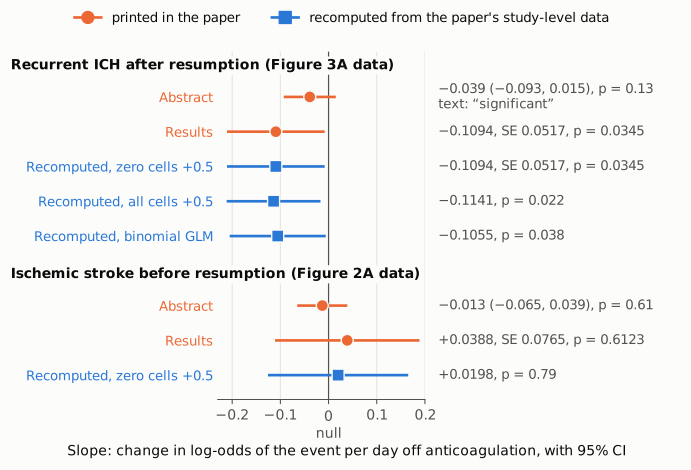
Figure 1. Slope of the meta-regression of event risk (log-odds) on days off anticoagulation, with 95% CIs, for recurrent ICH (top) and ischemic stroke (bottom). Orange circles are values printed in the paper. For the Abstract the interval is the printed one; for the Results it is ±1.96 × the printed SE. Blue squares are refits from the events and totals in Figures 2A and 3A and the days in Table 1. They use a logit inverse-variance meta-regression with 0.5 added to zero-event studies (the version that reproduces the Results) or to every study, or a binomial logistic regression. The vertical line marks a slope of 0 (no association). For recurrent ICH, the Abstract's interval crosses 0 although the Abstract calls the association significant. Every refit lies near the Results value of −0.1094, and none lies near −0.039. For ischemic stroke the Abstract's slope is negative while the Results' slope and the refit are positive.
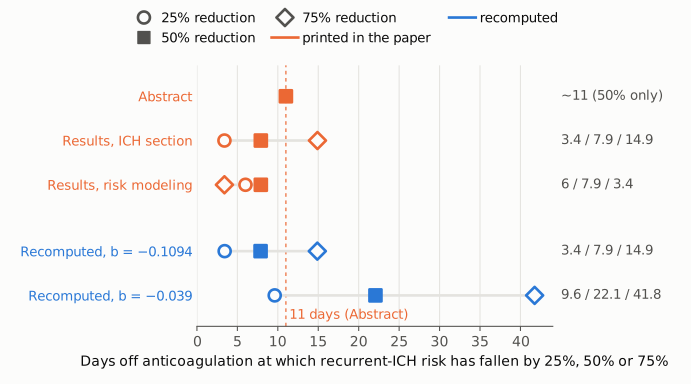
Figure 2. Days off anticoagulation at which the modeled recurrent-ICH risk has fallen by 25% (open circle), 50% (filled square) and 75% (open diamond). Orange rows are printed in the paper: the Abstract gives only a 50% value (about 11 days, dashed line). The Results' ICH section gives 3.4 / 7.9 / 14.9, and the Results' risk-modeling section gives 6 / 7.9 / 3.4. Blue rows are computed from the logit model with the day-0 risk of 26.7% given by the refitted intercept, once with the Results slope (−0.1094) and once with the Abstract slope (−0.039). The Results slope reproduces 3.4 / 7.9 / 14.9. The Abstract slope gives 9.6 / 22.1 / 41.8. Neither puts the 50% reduction at 11 days.
Why it matters
The paper presents the meta-regression of risk on time off anticoagulation as its "key element of novelty". The 25/50/75% thresholds derived from it support the Discussion's "window of opportunity" and the final recommendation of a delay of about 10–15 days. The Abstract is the part most readers and indexing services see. It reports this result with a coefficient, interval and p value that show no significant association, calls the association significant, and attaches a time point (11 days) that follows from neither coefficient. A reader of the Abstract cannot tell whether the timing effect is supported. Its reported numbers say it is not, while the body says it is, with a 50% reduction at 7.9 days rather than 11.
The body's estimate is reproducible from the published study-level data, so the Abstract, not the Results, appears to misreport the analysis. Two further points matter for interpretation. They are context, not errors. First, the significance of the reproduced slope (p = 0.034) rests on nine study-level points, and dropping either the 165-patient cohort or the 66-patient cohort removes it (p = 0.36 and p = 0.19). The leave-one-out analysis that the paper reports covers the pooled proportions, not the meta-regression. Second, the moderator mixes means and medians of days off anticoagulation, a limitation the Methods acknowledge.
The ischemic stroke mismatch (−0.013 in the Abstract, +0.0388 in the Results) does not change the paper's conclusion that there is no significant association. It does change direction, though, and only the positive slope produces the rising stroke-risk curve and the 6.0 / 11.0 / 15.2 day thresholds that the window argument uses.
Explanations considered
- A different model in the Abstract (adjusted, subgroup or sensitivity analysis). The Methods describe one meta-regression per outcome with days off anticoagulation as the only moderator. No other model, adjustment or subgroup is described, and the Abstract does not label its numbers as coming from a different analysis. This explanation is not supported by the text.
- A different continuity correction, τ² estimator or link. I refitted with 0.5 added to zero-event studies only (−0.1094, the Results value), with 0.5 added to every study (−0.1141), and as a binomial logistic regression with no correction (−0.1055). τ² was estimated as 0 by both DerSimonian–Laird and REML, so the random-effects and fixed-effect slopes coincide. None of these variants is near −0.039. It does not account for the numbers.
- A smaller or earlier set of studies. The Abstract gives the search end as "December 2023" and the Methods give "22 April 2025", so the Abstract may describe a different dataset. Leaving out any single study gives slopes from −0.1215 to −0.0610. Some subsets of four to six studies give a slope near −0.039, but with SEs of 0.073 to 0.107. Removing studies cannot narrow the interval, and the smallest SE in any subset is 0.0517, against the 0.0276 that the Abstract's interval implies. The Abstract's interval cannot be obtained from these studies with this model. Even if it came from other data, the word "significant" would still contradict it.
- A rescaled moderator (weeks or log days). Expressing time in weeks multiplies the per-day slope by 7 (−0.766), and log(days) gives −0.509. The Abstract and Results values differ by a factor of 2.81, so no rescaling of this kind links them.
- A different significance convention. The only relaxed threshold in the paper is p < 0.10 for the Cochran Q heterogeneity test. Even at 0.10, p = 0.13 (or 0.157 recomputed from the interval) is not significant, and a t reference distribution (7–8 df) gives a larger p of about 0.20. This does not account for "significant".
- One-sided testing. The one-sided p implied by the interval is 0.078, which is still above 0.05, and the paper does not describe one-sided tests. This does not account for "significant".
- A typesetting or conversion artifact. The publisher's typeset PDF (the version of record, as deposited in PMC) and the Europe PMC full-text XML carry the same numbers as the PMC archive. The mismatch is in the version of record.
- The 11 days as a rounding of 7.9 or as another model's output. Rounding cannot turn 7.9 into 11. In the body, 11 days appears only as the time to a 50% increase in ischemic stroke risk (11.0 days). This report does not infer how the number came to be in the Abstract.
Status
As of 2026-10-24:
- Version of record. I checked the publisher's typeset PDF (Wolters Kluwer on behalf of the AAN, 10 pages, deposited in the PMC open-access set as PMC12473174.1). The Abstract's −0.039 / −0.093 to 0.015 / p = 0.13 / "significant" / 11 days, the ischemic stroke −0.013, the Results' −0.1094 (SE 0.0517, p = 0.0345) and the Results' +0.0388 all appear there as quoted. Publication history in the PDF: received June 11, 2025; accepted July 22, 2025. The Figure 3B fitted line (publisher image) falls by about 0.1 log-odds per day, consistent with −0.1094, and Figure 3C marks 3.4 / 7.9 / 14.9 days.
- Supplement. The article lists online supplementary material (eTables 1–2, eFigures, eMethods). It is not in the PMC or Europe PMC deposit, and the publisher site returned HTTP 403, so I could not inspect it. It was not needed for the recomputation, because the study-level inputs are in the main text (Figures 2A and 3A, Table 1).
- Corrections and notices. Crossref update metadata, PMC notices and Europe PMC notices list no correction, erratum, expression of concern or retraction (checked with
src/known.py). A web search found no correction or published comment. - PubPeer. An earlier lookup through the PubPeer API in this review returned no comments for doi:10.1212/WNL.0000000000214184. A re-check on 2026-10-24 was blocked by the site (HTTP 403), and a web search for the DOI found no PubPeer thread.
Sources: doi:10.1212/WNL.0000000000214184; PMC12473174; PMC open-access bucket s3://pmc-oa-opendata/PMC12473174.1/ (PDF and figure images); Crossref and Europe PMC APIs; PubPeer.
Suggested correction
- Abstract, Results. Report the meta-regression that the Results describe and that the published study-level data reproduce. For example: "Meta-regression showed an inverse association between time to AC resumption and risk of recurrent ICH (regression coefficient −0.109 per day; 95% CI −0.211 to −0.008; p = 0.034), corresponding to an approximate 50% relative reduction in risk at 7.9 days." If the Abstract's −0.039 (95% CI −0.093 to 0.015; p = 0.13) is the intended result, describe the analysis it comes from and remove "significant", because the interval includes 0.
- Abstract, Discussion. Change "approximately 11 days" to the value that the chosen coefficient implies (7.9 days for −0.1094).
- Abstract, ischemic stroke. Replace "coefficient -0.013; 95% CI -0.065 to 0.039; p = 0.61" with the Results value (0.039 per day; SE 0.077; 95% CI −0.111 to 0.189; p = 0.61), or explain the difference.
- Abstract, recurrent ICH heterogeneity. Reconcile I² = 0% with the Results and Figure 3A value of 11.9%.
- Abstract, Methods. Reconcile the search end date ("December 2023") with the Methods ("22 April 2025").
- Results, Time-Dependent Risk Modeling. Change "25% ... at approximately 6 days, 50% at 7.9 days, and 75% at 3.4 days" to 3.4 / 7.9 / 14.9 days, and reconcile the stated 20% day-0 ICH risk with the model, whose intercept implies about 27% and whose thresholds use that value.
- Optional, for interpretation. Report a leave-one-out analysis for the meta-regression itself. Without the 165-patient cohort or the 66-patient cohort the slope is no longer significant (p = 0.36 and 0.19).