← Back to the plain-language case
Abstract and Discussion give near-loop median PFS as 11.1 months; Results and source data give 5.5
Nat Commun (2025) · doi:10.1038/s41467-025-61817-8 · PMC12460621
Summary
The paper's exploratory ZENITH20 analysis compares progression-free survival (PFS) under poziotinib between 63 patients with near-loop and 19 with far-loop EGFR exon 20 insertions. The abstract and the Discussion give the near-loop median PFS as 11.1 months (vs 3.5, p = 0.016). The Results paragraph that reports the Kaplan-Meier analysis (Fig. 5c) gives 5.5 months (vs 3.5, log-rank p = 0.015, HR 0.42, 95% CI 0.21-0.86). The paper's own patient-level Source Data reproduce the Results values exactly (5.45 vs 3.55 months, p = 0.0153, Cox HR 0.42, 0.21-0.86). The abstract values are reproduced exactly (11.14 vs 3.48 months, p = 0.0160) only when the progression/censoring indicator is reversed. The direction and significance of the near-loop advantage are unchanged, but the abstract roughly doubles the headline near-loop estimate and puts it close to the 12.0 months it reports for mobocertinib.
What the paper reports
All quotations were checked verbatim against the PMC-archived text with src/show.py.
Abstract:
Although the study’s primary efficacy endpoint was not met in the overall cohort, the exploratory analysis indicates poziotinib has superior benefit in EGFRex20 near- versus far-insertions showing greater mean tumor size reduction (-25.9% vs. -9.8%, p = 0.0014) and progression-free survival (PFS, 11.1 vs. 3.5 months, p = 0.016). In comparison, in the previously published EXCLAIM trial (NCT02716116), mobocertinib demonstrates similar activities across both groups in tumor size reduction (-38.5% vs. -34.1%, p = 0.59) and PFS (12.0 vs. 13.0 months, p = 0.99).
Results, section "Clinical response with poziotinib in near- vs. far- EGFRex20ins NSCLC", second paragraph:
In this cohort, 98 patients had at least one tumor measurement after poziotinib treatment, among those, 82 patients had exon 20 insertions location information per local next-generation sequencing (NGS) testing, with 63 (77%) patients whose tumor mutation were in the near-loop amino acids A767-P772 and 19 (23%) in the far-loop H773-C775 amino acids.
The median progression-free survival (PFS) was also significantly different in patients with near- vs far-loop insertions at 5.5 months (near) vs. 3.5 months (far) (Log Rank p = 0.015), with a PFS hazard ratio of 0.42 (near- vs. far- 95% Confidence Interval [CI] 0.21-0.86, Fig. 5c).
Results, same section, first paragraph (all treated patients):
Among the 17 responders, the median duration of response (DoR) was 7.4 months (95% CI, 3.7 to 9.7, Fig. 4b), and median progression-free survival (PFS) for all treated patients was 4.2 months (95% CI, 3.7 to 6.6).
Discussion, second paragraph:
In the ZENITH20 trial cohort 1, the clinical efficacy was limited in the total population, not meeting the previously defined efficacy endpoint, however, the near-loop insertions responded better to poziotinib both at tumor size reduction and at PFS (11.1 months [near] vs. 3.5 months [far]).
Methods, "Retrospective analysis of patient outcomes by mutation location":
progression-free survival (PFS), which was measured as time from the beginning of TKI treatment until radiologic progression or death
Methods, "Statistics and reproducibility":
Median PFS was determined using the Kaplan-Meier method. Hazard ratios and p-values were determined using GraphPad Prism software and the Mantel-Cox Log Rank method.
Fig. 5 legend, panel c:
c Kaplan-Meier plot of progression-free survival of patients with near loop and far loop mutants. The long-Rank Mantel-Cox approach was used to determine the p-value.
Supplementary Data 1 (MOESM3), column header in sheets "Near 64" and "Far 20":
Censor, 0=PD, 1=censor
What the paper's own numbers show
Method. The Source Data file (MOESM7, Fig 5.xlsx, sheet "Fig 5a-c") has one row per patient for the Fig. 5a-c analysis, with insertion location, best response, PFS in months and a PFS_status column. It has 63 near-loop and 19 far-loop rows, the same as the text. The sheet does not say which value of PFS_status marks progression, so I worked that out from two other sources in the paper's own files. (1) All 14 patients whose best response was progressive disease have PFS_status = 1. (2) Of the 75 patients who appear in both the Source Data and Supplementary Data 1, every one with PFS_status = 1 has "Censor" = 0 (= PD) in Supplementary Data 1, and every one with PFS_status = 0 has "Censor" = 1 (= censor), 51 and 24 patients respectively. Their PFS times are identical in the two files. So PFS_status = 1 is progression or death. With my own Kaplan-Meier and Mantel-Cox log-rank code and a one-covariate Cox model (Efron ties), I computed the near- vs far-loop medians, p-value and hazard ratio twice: once with PFS_status = 1 as the event, and once with the indicator reversed. Every number below is printed by recompute.py.txt, which downloads both files from the publisher.
| Quantity | Location | Reported | Recomputed from the paper's own numbers |
|---|---|---|---|
| Near-loop median PFS | Abstract; Discussion | 11.1 months | 5.45 months with PFS_status = 1 as event (42 of 63 events); 11.14 months only with the indicator reversed (21 events) |
| Near-loop median PFS | Results (Fig. 5c) | 5.5 months | 5.45 months |
| Far-loop median PFS | Abstract; Results; Discussion | 3.5 months | 3.55 months (11 of 19 events); 3.48 months with the indicator reversed |
| Log-rank p, near vs far | Abstract | 0.016 | 0.0153; 0.0160 with the indicator reversed |
| Log-rank p, near vs far | Results; Fig. 5c | 0.015 | 0.0153 |
| HR near vs far (95% CI) | Results | 0.42 (0.21-0.86) | 0.42 (0.21-0.86), Cox with Efron ties; 0.35 (0.14-0.85) with the indicator reversed |
| Near-minus-far difference in medians | Abstract/Discussion vs Results | 7.6 vs 2.0 months | 1.90 months; 7.66 with the indicator reversed |
| Gap between the two near-loop medians printed | Abstract vs Results | 11.1 vs 5.5 | 5.6 months; ratio 2.02 |
| Pooled KM median, all 82 patients with known location | not reported (all 115 treated: 4.2, 95% CI 3.7-6.6) | n/a | 4.99 months; 11.14 with the indicator reversed |
| Near-loop patients with PFS ≥ 12 months | Fig. 5c number at risk | n/a | 5 of 63 |
Under the coding that matches Supplementary Data 1, the Source Data reproduce every Results value to the printed precision: both medians, the p-value, the hazard ratio and both CI limits. Reversing the indicator, so that censored patients are treated as progressing, reproduces both abstract and Discussion numbers to the printed precision (11.14 → 11.1, 3.48 → 3.5, 0.0160 → 0.016). It does not reproduce the reported hazard ratio. No other coding I tried reproduces 11.1. Under the reversed coding the pooled Kaplan-Meier median of all 82 patients is also 11.14 months, far outside the 95% CI of 3.7 to 6.6 months reported for all 115 treated patients. The pooled median under the documented coding is 4.99 months, inside that interval. The populations differ (82 patients with at least one tumor measurement and a known insertion location vs all 115 treated), so this comparison is a plausibility check only.
Figure
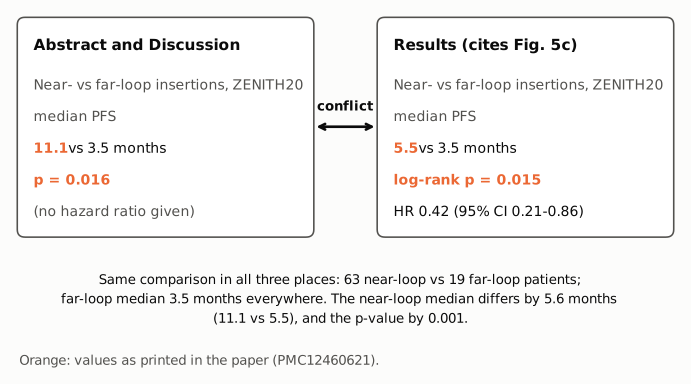
Figure 1. The two versions of the same ZENITH20 near- vs far-loop PFS comparison, as printed. Left: the abstract and Discussion (11.1 vs 3.5 months, p = 0.016; neither gives a hazard ratio). Right: the Results paragraph citing Fig. 5c (5.5 vs 3.5 months, log-rank p = 0.015, HR 0.42, 95% CI 0.21-0.86). The patient groups (63 near-loop, 19 far-loop) and the far-loop median are the same in all three places. The conflicting values are in orange.
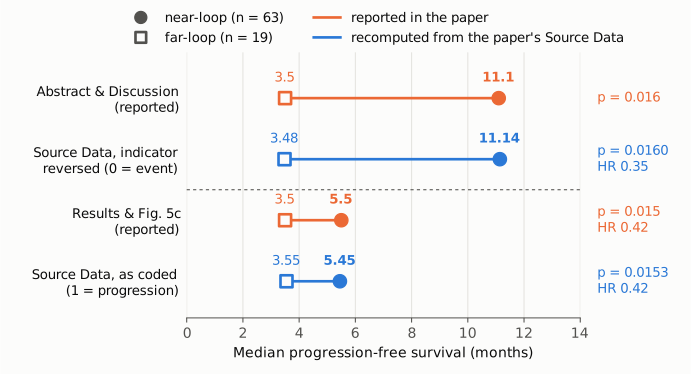
Figure 2. Median PFS by insertion location, in months, on a linear axis starting at 0. Filled circles are near-loop medians, open squares far-loop medians. Orange rows are values printed in the paper; blue rows are recomputed by recompute.py.txt from the paper's Source Data (sheet "Fig 5a-c", 63 near-loop and 19 far-loop patients). The p-values and hazard ratios on the right are log-rank and Cox (Efron) estimates, near vs far. The bottom pair: with PFS_status = 1 as progression, the coding confirmed by Supplementary Data 1, the data reproduce the Results and Fig. 5c (5.45 vs 3.55 months, p = 0.0153, HR 0.42). The top pair: the abstract and Discussion values are reproduced only when censored and progressing patients are swapped (11.14 vs 3.48 months, p = 0.0160). That swap gives HR 0.35, not the reported 0.42.
Why it matters
- The headline estimate is about twice the supported value. The abstract is the only place most readers see the result, and it gives near-loop poziotinib patients a median PFS of 11.1 months. The paper's own analysis (Results, Fig. 5c, Source Data) supports 5.5 months. The near-minus-far difference becomes 7.6 months in the abstract instead of about 2 months.
- It changes the drug comparison the abstract invites. The next sentence of the abstract reports mobocertinib PFS of 12.0 (near) and 13.0 (far) months in EXCLAIM. With 11.1 months, poziotinib in near-loop disease looks almost as good as mobocertinib. With 5.5 months it is less than half. The two trials are separate single-arm studies, so this comparison is informal either way, but the abstract places the numbers side by side.
- The 11.1-month figure also conflicts with the cohort as a whole. The paper reports a median PFS of 4.2 months (95% CI 3.7-6.6) for all 115 treated patients, and the trial did not meet its primary endpoint. Near-loop patients are 77% of those with known location, so a near-loop median of 11.1 months is hard to reconcile with the overall figure. The value recomputed from the source data, 5.5 months, is consistent with it.
- What does not change. Under the documented coding the near-loop group still has significantly longer PFS than the far-loop group (log-rank p = 0.015, HR 0.42, 95% CI 0.21-0.86). The paper's qualitative conclusion, that insertion location affects poziotinib sensitivity, is supported by its own Results. The tumor-shrinkage comparison (-25.9% vs -9.8%) is not affected.
Explanations considered
- A different population or subgroup. Not supported. The abstract, Results and Discussion all refer to ZENITH20 cohort 1 and the near- vs far-loop comparison, and the far-loop median is 3.5 months in all three places. The Results define the groups as 63 near-loop and 19 far-loop patients, and the Source Data sheet behind Fig. 5a-c has exactly those 82 patients. The 11.1-month value is reproduced from this same set of 82 patients, so it is not a figure for another subset. It is also not the earlier single-center trial the Results cite (ref. 22), and not one of the EXCLAIM values (12.0 and 13.0 months).
- A different endpoint, time point or model. Not supported. The Methods define PFS once (from TKI start to radiologic progression or death) and describe one Kaplan-Meier and Mantel-Cox analysis. No second data cut-off, adjusted model or alternative endpoint is described.
- The Results value is the one in error. Not supported. Fig. 5c, which the Results cite, prints p = 0.015. The Source Data reproduce the Results medians, p-value, hazard ratio and CI limits exactly under the coding confirmed by Supplementary Data 1 and by the best-response column.
- Uncertainty about which
PFS_statusvalue means progression. Resolved from the paper's own files. All 14 patients with best response "PD" havePFS_status= 1. All 75 patients who appear in both files havePFS_status= 1 exactly when Supplementary Data 1 marks them "0=PD". With the reversed coding, none of the 14 PD patients would count as progressing, which cannot be right. - How the 11.1 arose. The abstract and Discussion values (11.1, 3.5 and p = 0.016) are all reproduced to the printed precision by one specific change to the data: counting censored patients as events and events as censored. This is consistent with a second run of the analysis using the inverted indicator. The paper does not say how the abstract numbers were produced, so this is a mechanism that fits the numbers, not an established account.
- A conversion or typesetting artifact. Ruled out. The numbers are plain decimals in running text, with no superscripts, signs or table cells. They are identical in the publisher's HTML, the Europe PMC full-text XML and the PMC text.
- Side observations, not part of the main finding. (1) Supplementary Data 1 lists 64 near-loop and 20 far-loop patients, 75 of whom are among the 82 in the Source Data (7 are only in the Source Data, 9 only in Supplementary Data 1). On its own 84 patients it gives 5.26 vs 3.55 months (log-rank p = 0.0036), which also does not support 11.1. (2) The Results define the far-loop group as "H773-C775" and the Methods as "between H773-R776". (3) Only the Cox model with Efron ties reproduces the reported HR and CI. The Mantel-Haenszel and O/E-ratio estimates from the same data are 0.33 (0.13-0.81) and 0.46 (0.20-1.10). The Methods attribute hazard ratios to the Mantel-Cox method, so the authors may wish to say which estimator was used.
Status
- Version of record. I downloaded the publisher's HTML page (nature.com/articles/s41467-025-61817-8) and checked the Europe PMC full-text XML. Both carry the same three passages as the PMC archive: "11.1 vs. 3.5 months, p = 0.016" in the abstract, "5.5 months (near) vs. 3.5 months (far) (Log Rank p = 0.015)" with HR 0.42 (0.21-0.86) in the Results, and "11.1 months [near] vs. 3.5 months [far]" in the Discussion. The publisher's Fig. 5c prints p = 0.015, with 63 near-loop and 19 far-loop patients at risk at time 0. Every quotation above was checked verbatim against the PMC-archived text with
src/show.py. - Supplements. The article lists seven ESM files. I read MOESM1 (Supplementary Information), MOESM3 (Supplementary Data 1, ZENITH20 near/far patient-level data), MOESM4 (Supplementary Data 2, EXCLAIM) and MOESM7 (Source Data ZIP, including
Fig 5.xlsx). The analysis uses MOESM7 sheet "Fig 5a-c" (SHA-256 of the ZIP: 8dd564f4…c583) and MOESM3 (SHA-256 552de51f…ee95). None of the supplementary files gives an 11.1-month near-loop median under the documented coding, and none explains the abstract value. - Corrections and comments. As of 2026-10-24 I found no correction, erratum, retraction or expression of concern.
src/known.pyreturns no Crossref update relations, no PMC notices and no Europe PMC notices. The Crossref record has empty update-to and updated-by fields, and the Europe PMC record (PMID 40993146) has no comment or correction entries. The PubPeer API returned no record (HTTP 404) for the DOI, and a web search for the title together with "PubPeer" found no thread. - Sources. PMC article PMC12460621; publisher article page and ESM files at https://doi.org/10.1038/s41467-025-61817-8 (static-content.springer.com, MOESM1, MOESM3, MOESM4, MOESM7); Europe PMC full text and record; Crossref; PubPeer.
Suggested correction
In the abstract, replace
progression-free survival (PFS, 11.1 vs. 3.5 months, p = 0.016)
with
progression-free survival (PFS, 5.5 vs. 3.5 months, p = 0.015)
and in the second paragraph of the Discussion, replace
(11.1 months [near] vs. 3.5 months [far])
with
(5.5 months [near] vs. 3.5 months [far])
These are the values in the Results, in Fig. 5c and in the Source Data under the coding that matches Supplementary Data 1. The authors may also wish to state that the hazard ratio of 0.42 comes from a Cox model, if that is how it was estimated. They may also wish to reconcile the patient lists of Supplementary Data 1 (64/20) and the Source Data (63/19), and the far-loop range given in the Results (H773-C775) and the Methods (H773-R776).