← Back to the plain-language case
Abstract reports overall-cohort length-of-stay estimates as the results for hypotensive patients
JAMA Netw Open (2025) · doi:10.1001/jamanetworkopen.2025.33266 · PMC12457976
Summary
The abstract states that, among patients with hypotension on admission, splenic angioembolization (SAE) and observation were each associated with a shorter hospital length of stay (HLOS) than open splenectomy (OS): SAE β = -1.44 (95% CI, -1.79 to -1.09; P < .001) and observation β = -1.41 (95% CI, -1.73 to -1.09; P < .001). These six numbers are identical to the paper's Table 2 rows for the total cohort (n = 7567). Table 2's rows for the hypotension subgroup (SBP <90 mm Hg, n = 651) are different: SAE β = -1.65 (-3.24 to -0.06; P = .04) and observation β = -0.13 (-1.58 to 1.32; P = .86). The Results text reports only the SAE figure for this subgroup. For observation, the abstract therefore reports a highly significant benefit of about 1.4 days where the paper's own subgroup analysis, and its inverse-probability-weighted (IPW) sensitivity analysis, show no significant difference. The claim is repeated in words in the main-text Conclusions, and it supports the headline statement that nonoperative management had "favorable outcomes ... even in patients with hypotension on admission".
What the paper reports
Abstract, Results:
Among patients with hypotension, there was no mortality difference, but shorter hospital length of stay was found in the SAE (β = -1.44; 95% CI, -1.79 to -1.09; P < .001) and observation (β = -1.41; 95% CI, -1.73 to -1.09; P < .001) groups.
Results, "Multivariable Analysis for Other Outcomes". This paragraph gives the same two estimates for the total cohort, then reports the hypotension subgroup separately and names only SAE:
Multivariable linear regression analysis of continuous variable outcomes is given in Table 2. SAE (β = -1.44; 95% CI, -1.79 to -1.09; P < .001) and observation (β = -1.41; 95% CI, -1.73 to -1.09; P < .001) showed a negative association with HLOS days.
The same results were observed in normal SBP subgroup. In the hypotension subgroup, SAE was also negatively associated with HLOS days (β = -1.65; 95% CI, -3.24 to -0.06; P = .04) and ICULOS days (β = -1.45; 95% CI, -2.62 to -0.29; P = .01).
Table 2, "SAE or Observation vs OS Outcomes Using Multivariable Linear Regression and IPW". Columns: outcome | No. | mean (SD) | regression β (95% CI) | P value | IPW β (95% CI) | P value. Total block, HLOS days:
SAE | 1547 | 6.35 (4.17) | -1.44 (-1.79 to -1.09) | <.001 | -1.77 (-2.24 to -1.30) | <.001
Observation | 4521 | 6.04 (5.00) | -1.41 (-1.73 to -1.09) | <.001 | -1.60 (-2.05 to -1.14) | <.001
Table 2, SBP <90 mm Hg block, HLOS days (block total 651; OS row 323 | 9.40 (8.31) | 0 [Reference]):
SAE | 124 | 7.48 (4.80) | -1.65 (-3.24 to -0.06) | .04 | -1.67 (-2.89 to -0.46) | .007
Observation | 204 | 8.74 (8.01) | -0.13 (-1.58 to 1.32) | .86 | -0.48 (-2.00 to 1.04) | .54
Main-text Conclusions:
Furthermore, in patients with hypotension on admission, nonoperative management (either with SAE or observation) was associated with no increased risk of complications or mortality and shorter LOS.
Key Points, "Findings" (the abstract's Conclusions and Relevance uses the same closing phrase):
In this cohort study of 7567 patients, nonoperative management (angioembolization or observation) was associated with favorable outcomes when compared with surgery in isolated severe blunt splenic injury, even in patients with hypotension on admission.
What the paper's own numbers show
Method. I compared the abstract's two "hypotension" estimate-and-CI triples with every HLOS row in Table 2 (total, SBP <90, SBP ≥90 and failure blocks, regression and IPW columns). I then checked each row's internal consistency with a Wald approximation from the printed interval: SE = (upper − lower)/(2 × 1.96), z = β/SE, two-sided P = 2Φ(−|z|). I checked that the block sizes add up, and I compared CI widths with the group sizes. As a further check I computed the unadjusted mean differences and Welch t tests from the Table 2 means and SDs. Patient-level data are not available, so the adjusted models cannot be refitted. Every number below is printed by recompute.py.txt.
| Quantity | Location | Reported | Recomputed from the paper's numbers |
|---|---|---|---|
| HLOS β, SAE vs OS, "among patients with hypotension" | Abstract | -1.44 (-1.79 to -1.09), P < .001 | Identical to the Table 2 Total row; matches no SBP <90 row |
| HLOS β, observation vs OS, "among patients with hypotension" | Abstract | -1.41 (-1.73 to -1.09), P < .001 | Identical to the Table 2 Total row; matches no SBP <90 row |
| HLOS β, SAE, hypotension subgroup | Table 2, SBP <90; Results | -1.65 (-3.24 to -0.06), P = .04 | SE 0.811, z = -2.03, P = 0.042: consistent with itself |
| HLOS β, observation, hypotension subgroup | Table 2, SBP <90 | -0.13 (-1.58 to 1.32), P = .86 | SE 0.740, z = -0.18, P = 0.861; CI includes 0 |
| IPW HLOS β, SAE / observation, hypotension subgroup | Table 2, SBP <90, IPW | -1.67 (-2.89 to -0.46), P = .007 / -0.48 (-2.00 to 1.04), P = .54 | P = 0.007 / 0.536; observation CI includes 0 |
| HLOS β, total cohort, SAE / observation | Table 2, Total | -1.44 (-1.79 to -1.09) / -1.41 (-1.73 to -1.09), both P < .001 | z = -8.06 / -8.64, both P < 10⁻¹⁵ |
| HLOS β, normotension subgroup, SAE / observation | Table 2, SBP ≥90 | -1.44 (-1.80 to -1.09) / -1.53 (-1.86 to -1.20) | Close to, but not identical with, the abstract (observation -1.53 vs -1.41) |
| Abstract's failure-subgroup HLOS figures (control) | Abstract vs Table 2, Failure | 2.50 (1.27-3.73); 0.71 (0.07-1.35) | Identical to the Table 2 Failure rows: the abstract's other subgroup result is transcribed correctly |
| Group sizes, HLOS blocks | Table 2 | 7567; 651; 6916 | 1499 + 1547 + 4521 = 7567; 323 + 124 + 204 = 651; 1176 + 1423 + 4317 = 6916; 651 + 6916 = 7567 |
| CI width, abstract vs SBP <90 row | Abstract; Table 2 | 0.70 vs 3.18 (SAE); 0.64 vs 2.90 (observation) | The subgroup intervals are 4.5 times as wide as the abstract's |
| Residual SD implied by each CI, SE/√(1/n_arm + 1/n_OS) | Table 2 | HLOS SD 7.69 (SBP <90), 5.27 (total) | SBP <90 rows: 7.68 and 8.27; total rows: 4.93 and 5.48. The abstract's CIs placed at the SBP <90 group sizes would imply 1.69 and 1.83, so covariates would have to explain about 95% of the HLOS variance in that subgroup, while the table's own subgroup rows show almost no such reduction |
| ICULOS β, observation, hypotension subgroup | Table 2, SBP <90 | -0.49 (-1.59 to 0.61), P = .38 | P = 0.383; CI includes 0 |
| Unadjusted mean HLOS difference vs OS, hypotension subgroup | Table 2 means (SD) | OS 9.40 (8.31), SAE 7.48 (4.80), observation 8.74 (8.01) | SAE -1.92 days (Welch P = 0.003); observation -0.66 days (Welch P = 0.364) |
Each Table 2 row is internally consistent: the printed P values follow from the printed intervals, and the block sizes add to the cohort total. The table is not misaligned. The discrepancy lies between the abstract sentence and the subgroup rows it describes. The CI-width check points the same way. The abstract's intervals are as narrow as one would expect from about 3000-6000 patients per comparison, not from the 447 (SAE) and 527 (observation) patients in the hypotension comparisons.
Figure
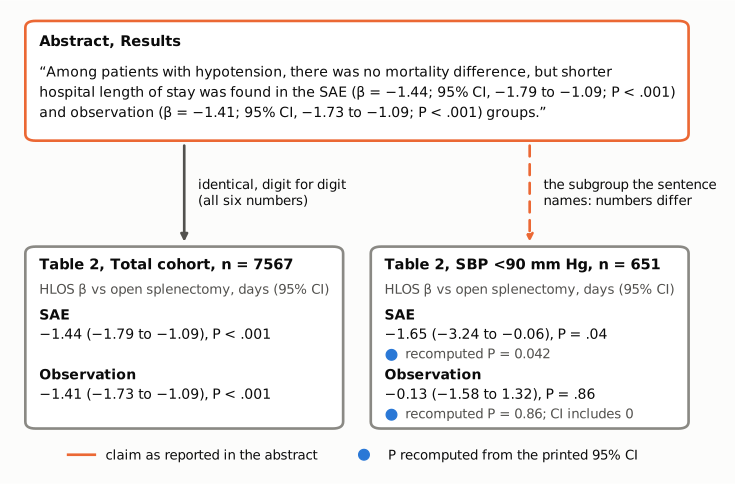
Figure 1. The abstract's sentence on patients with hypotension (top, orange outline) quoted next to the two Table 2 blocks it could refer to. All six numbers, for both arms, match the Total-cohort block (n = 7567) exactly. The SBP <90 mm Hg block (n = 651), which is the subgroup the sentence names, gives a different SAE estimate with an interval 4.5 times as wide, and an observation estimate of -0.13 days whose 95% CI includes 0. The blue markers give the P values recomputed from each printed interval with a Wald approximation. They agree with the table's own P values (.04 and .86), so the table rows are internally consistent.
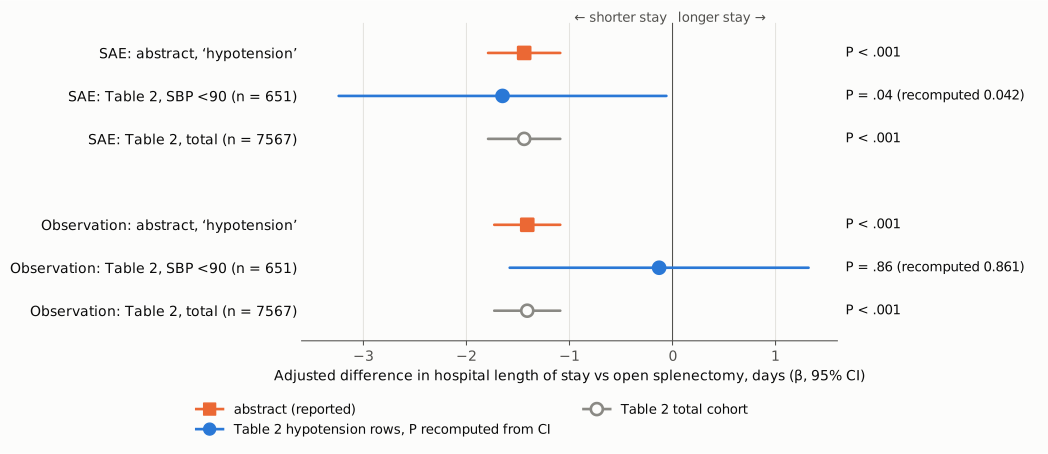
Figure 2. The same estimates on one axis, in days of hospital stay relative to open splenectomy. The orange squares are the abstract's "hypotension" values, the blue circles are the Table 2 SBP <90 rows, and the hollow gray circles are the Table 2 total-cohort rows. The orange and gray intervals coincide. For observation, the subgroup interval (blue) crosses the null line at 0, and the abstract's (orange) does not. The right-hand column gives each printed P value, with the Wald P recomputed from the printed CI for the subgroup rows.
Why it matters
Whether nonoperative management, and observation in particular, is reasonable for hemodynamically unstable patients with high-grade splenic injury is a clinically consequential question. The abstract is the part of the paper most readers rely on. In the hypotension subgroup, Table 2 and the Results show no difference in mortality (HR 0.95 for SAE, 1.08 for observation) or in any complication (OR 0.71, P = .30; OR 1.15, P = .62). That leaves length of stay as the only outcome on which the subgroup shows a benefit. For observation, that benefit is not present in the paper's own subgroup analysis: β = -0.13 days (95% CI, -1.58 to 1.32; P = .86), with IPW giving -0.48 days (P = .54). The unadjusted difference is also small and not significant (-0.66 days, P = .36). The main-text Conclusions ("nonoperative management (either with SAE or observation) was associated with ... shorter LOS") and the Key Points' "favorable outcomes ... even in patients with hypotension on admission" both rest partly on the abstract's version.
For SAE the direction is unchanged, but the abstract overstates the precision. The subgroup estimate is -1.65 days with a CI reaching almost to 0 (-0.06) and P = .04, not P < .001 with a 0.7-day-wide interval.
The paper's other main findings do not depend on this sentence. These are lower morbidity and shorter stay in the overall cohort, the same in the normotension subgroup, no mortality difference, and the failure-subgroup results. A null result does not show that observation has no effect on length of stay in hypotensive patients. It shows only that this analysis does not support the significant effect the abstract reports.
Explanations considered
- The abstract reports a different model or weighting from the table. The abstract's two triples match no other HLOS row in Table 2: not the SBP <90 regression or IPW rows, the SBP ≥90 rows, or the total-cohort IPW rows. They match only the total-cohort regression rows, digit for digit. This does not account for the numbers.
- "Patients with hypotension" means something other than SBP <90 mm Hg. The Methods define the subgroup as "patients presenting with hypotension (SBP <90 mm Hg)", and the total cohort is not a hypotension group. The total cohort is 91% normotensive (6916 of 7567). This does not account for the numbers.
- The table rows are misaligned or mislabeled. Each row's printed P value follows from its own interval (SBP <90 SAE P = 0.042 vs .04 printed; observation 0.861 vs .86; IPW 0.007 and 0.536). The block sizes sum correctly (323 + 124 + 204 = 651). The SBP <90 intervals are as wide as their group sizes and SDs imply. The abstract's intervals would require covariates to remove about 95% of the outcome variance in that subgroup, far more than the table's own subgroup rows show. The Results text also quotes -1.65 for the hypotension subgroup, which confirms the table's SBP <90 values. This does not account for the numbers.
- The supplement holds a different hypotension analysis. Supplement 1 (eAppendix and eTables 1-8) gives only unadjusted HLOS medians for the hypotension subgroup (eTable 4: OS 7, SAE 6, observation 6; three-group P = .003). It reports no pairwise regression coefficients and nothing matching -1.44 or -1.41 for that subgroup. This does not account for the numbers.
- A text-conversion artifact. The abstract sentence, the Results paragraph and Table 2 read the same in the publisher-supplied JATS XML. The values are plain text, not images. This does not account for the numbers.
- The abstract sentence is meant to combine two findings: no mortality difference in hypotension, and shorter stay overall. The sentence attaches the length-of-stay result to "Among patients with hypotension" grammatically. The main-text Conclusions repeat the subgroup claim explicitly for both SAE and observation. Under this reading the abstract would still say nothing correct about length of stay in the subgroup. It would at most reduce the error to ambiguous wording, and the Conclusions sentence would still be unsupported for observation.
Status
As of 2026-10-23:
- Version of record. The publisher page (jamanetwork.com, reached via doi.org) returned a bot check (HTTP 403) to automated access, so it was not read directly. The wording was confirmed in the publisher-supplied JATS full text in Europe PMC (PMC12457976) and in the PMC archive text (read with
src/show.py). Both have the abstract sentence, the Results paragraph and the Table 2 cells as quoted. - Supplements. Supplement 1 (eAppendix, eTables 1-8) was read. It does not report the hypotension-subgroup HLOS regression coefficients and does not change Table 2. Supplement 2 is the data sharing statement (ACS-TQIP registry data, no patient-level data).
- Corrections and notices. None found. Crossref update records, PMC notices and Europe PMC notices for doi:10.1001/jamanetworkopen.2025.33266 are all empty. A web search for a correction or erratum returned none.
- PubPeer. The PubPeer search and API returned a human-verification challenge to automated access, so they could not be queried directly. A web search for the title returned no PubPeer entry. This is not a definitive negative.
- Sources. Article (doi); PMC12457976; Europe PMC full-text XML and supplementary files for PMC12457976; Crossref and Europe PMC REST records for the DOI.
Suggested correction
In the Abstract, Results, replace the hypotension sentence with the Table 2 SBP <90 mm Hg values, for example: "Among patients with hypotension, there was no mortality difference; hospital length of stay was shorter in the SAE group (β = -1.65; 95% CI, -3.24 to -0.06; P = .04) but not significantly different in the observation group (β = -0.13; 95% CI, -1.58 to 1.32; P = .86)." The main-text Conclusions should then be revised: in patients with hypotension, shorter LOS was found for SAE only. The phrase "even in patients with hypotension on admission" in the Key Points and in the Abstract's Conclusions and Relevance should be checked against the subgroup results as corrected. In that subgroup, mortality and complications did not differ, and the LOS benefit applies to SAE only.