← Back to the plain-language case
Testosterone–volume regressions report F(1,88) values that give p ≈ 0.08, not the stated 0.005 and 0.007
Hum Brain Mapp (2025) · doi:10.1002/hbm.70356 · PMC12442050
Summary
The Results report that testosterone significantly predicts larger Right Lobule I–IV and Right Crus II volumes: "adjusted R2 = 1, F(1,88) = 3.15, … p = 0.005" and "adjusted R2 = 0.1, F(1,88) = 3.09, … p = 0.007", with testosterone said to explain "approximately 14% of the variance". These numbers cannot all be true. Each model has a single predictor, and for such a model F(1,88) = 3.15 and 3.09 give p = 0.079 and 0.082, above the paper's own threshold of 0.05, and imply R2 ≈ 0.035 (adjusted ≈ 0.023). An adjusted R2 of 1 is impossible with any finite F, and Figure 9 labels the same models with yet other values (R2 = 0.185 and 0.128, both p = 0.005). This is the paper's only significant hormone–structure result, and the Discussion builds on it, so as published the result cannot be checked.
What the paper reports
Results, section "Sex Steroid Hormones Are Associated With Lobular Cerebellar Volume", only paragraph (the PMC text flattens the superscript in "R 2"):
The regression results indicated that only T levels were significantly associated with volume in the Right I–IV and Right Crus II (Figure 9). These results indicate that higher T levels are significantly associated with larger volumes in the Right I–IV (adjusted R 2 = 1, F(1,88) = 3.15, beta = 1.49E-06, p = 0.005) and Right Crus II (adjusted R 2 = 0.1, F(1,88) = 3.09, beta = 4.18E-06, p = 0.007) regions. The T hormone can explain approximately 14% of the variance in the volumes of these regions. No significant results were found for other hormones.
Methods, "Structural Data Statistical Analysis", third paragraph:
For these analyses, ROI volumes were normalized to each subject's TIV, generating a percentage to account for individual differences in brain size. Each model included hormone level as the independent variable and the TIV-normalized volume of the ROI as the dependent variable. Statistical significance was assessed using p < 0.05.
Methods, "Participants":
A total of 138 participants (mean age = 57 ± 13.3 years, range = 35–86; 54% female) were included.
Figure 9 legend:
Linear regression analysis of testosterone levels predicting cerebellar subregion volumes in Right I–IV and Right Crus II.
Figure 9 panel labels (text inside the figure image, HBM-46-e70356-g001.jpg, read from the image): "R² = 0.185, p = 0.005" (Right I–IV) and "R² = 0.128, p = 0.005" (Right Crus II). The y-axes are labelled "Right I-IV (mm³)" and "Right Crus II (mm³)".
Discussion, fifth paragraph:
Interestingly, testosterone also showed a significant relationship with cerebellar structure, with higher levels predicting larger volumes in Lobules I–IV and Right Crus II in our sample. This suggests that testosterone may contribute to cerebellar preservation during aging, potentially supporting the maintenance of motor and cognitive functions (Volman et al. 2011).
Discussion, sixth paragraph:
Moreover, the ability of testosterone to predict larger cerebellar volumes in Right I–IV and Right Crus II underscores its potential as a biomarker for brain health and aging (Moffat 2005; Andersen et al. 2011; Yeap and Flicker 2022).
What the paper's own numbers show
Method. Methods state that each hormone–volume model has hormone level as its only predictor. For an ordinary least-squares regression with an intercept and one predictor, the overall F(1, n − 2) equals the squared t statistic of the slope, so the model p value and the slope p value are the same number. The model also satisfies R2 = F / (F + df2) and adjusted R2 = 1 − (1 − R2)(n − 1)/(n − 2), which for df2 = 88 reduces to (F − 1)/(F + 88). With df2 = 88, n = 90. I computed p from the upper tail of the F(1,88) distribution (scipy), then derived R2 and adjusted R2 from F, and worked backwards from each reported p and R2 to the F it would need. Every number below is printed by recompute.py.txt.
| Quantity | Location | Reported | Recomputed from the paper's own numbers |
|---|---|---|---|
| p, Right I–IV | Results | 0.005 | 0.079 from F(1,88) = 3.15 |
| p, Right Crus II | Results | 0.007 | 0.082 from F(1,88) = 3.09 |
| Critical F at the paper's α = 0.05 | Methods (p < 0.05) | — | F(1,88) = 3.95; both reported F values fall below it |
| F needed for the reported p | Results | 3.15 / 3.09 | 8.29 (for p = 0.005) / 7.63 (for p = 0.007) |
| Adjusted R2, Right I–IV | Results | 1 | 0.024 (R2 = 0.035); adjusted R2 = (F − 1)/(F + 88) < 1 for every finite F |
| Adjusted R2, Right Crus II | Results | 0.1 | 0.023 (R2 = 0.034); an adjusted R2 of 0.1 would need F(1,88) = 10.89 (p = 0.0014) |
| Variance explained by testosterone | Results | "approximately 14%" | 3.5% and 3.4%; R2 = 0.14 would need F(1,88) = 14.33 (p = 0.00028) |
| R2 and p, Right I–IV | Figure 9 | R² = 0.185, p = 0.005 | at df (1,88), R² = 0.185 gives F = 19.98, p = 2.3 × 10⁻⁵ |
| R2 and p, Right Crus II | Figure 9 | R² = 0.128, p = 0.005 | at df (1,88), R² = 0.128 gives F = 12.92, p = 0.00054; the same p for two different R² at the same n is not possible |
| Sample size of the models | Methods vs Results | 138 participants; df2 = 88 | df2 = 88 means n = 90; n = 138 would give df2 = 136 |
Three sets of values describe the same two regressions, and no two of them agree: the F values (p ≈ 0.08, R2 ≈ 0.03), the text's p values and adjusted R2 (p = 0.005 and 0.007; adjusted R2 1 and 0.1; "14%"), and Figure 9's labels (R2 0.185 and 0.128, both p = 0.005). Only the F values fall short of significance. The others place the association anywhere from p = 0.007 down to p ≈ 2 × 10⁻⁵. The 90 versus 138 gap is not counted as an error here (see Explanations considered).
Figure
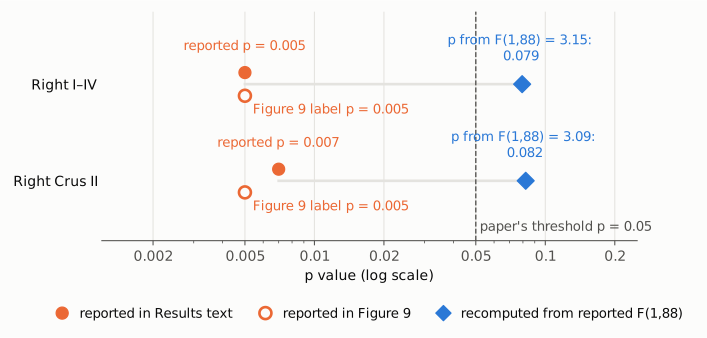
Figure 1. P values for the two testosterone–volume regressions, on a log scale. Filled orange circles are the p values given in the Results text (0.005 and 0.007); open orange circles are the p values printed on the Figure 9 panels (0.005 for both). Blue diamonds are the p values that the reported F(1,88) = 3.15 and 3.09 imply for a one-predictor regression (0.079 and 0.082). The dashed line marks the paper's significance threshold, p = 0.05. The reported and recomputed values sit on opposite sides of it, 16 and 12 times apart. The log scale is used because p values span orders of magnitude; the plot does not otherwise rescale the difference.
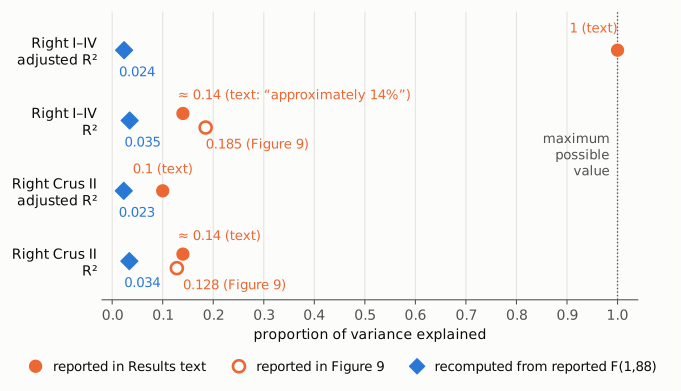
Figure 2. Proportion of variance explained for the same two models, on a linear axis from 0 to 1. Filled orange circles are values in the Results text (adjusted R2 = 1 and 0.1; "approximately 14%", shown on both R2 rows because the text gives one figure for both regions). Open orange circles are the R2 labels on Figure 9 (0.185 and 0.128). Blue diamonds are the R2 and adjusted R2 implied by the reported F(1,88) values (0.035 and 0.024 for Right I–IV; 0.034 and 0.023 for Right Crus II). The dotted line at 1 is the largest value R2 can take, which an adjusted R2 reaches only with a perfect fit. Small vertical offsets within a row only keep markers from overlapping.
Why it matters
- The paper's only significant hormone–structure result rests on these numbers. The Introduction gives as the "second primary aim" whether hormone levels were "associated with cerebellar structure and connectivity". For structure, the Results report that "only T levels were significantly associated with volume", and that "No significant results were found for other hormones". If the F values are correct, neither association reaches p < 0.05. If the p values are correct, the F values and the variance-explained figures are wrong. From what is published, a reader cannot tell which.
- Conclusions built on the result. The Discussion states that testosterone "showed a significant relationship with cerebellar structure", that it "may contribute to cerebellar preservation during aging", and that its prediction of larger volumes "underscores its potential as a biomarker for brain health and aging" and could inform "potential hormone-based interventions". It also says testosterone "was also notable in its associations especially with structure". The final paragraph states "we demonstrated novel associations between sex steroid hormones and both connectivity patterns and structure", and the abstract's last sentence refers to "the significant role of sex steroid hormones in modulating cerebellar connectivity and structure". For structure, each of these rests only on these two regressions.
- The effect size is overstated whichever way it is resolved. The text's "approximately 14%" exceeds what any of the reported test statistics imply: 3.4–3.5% from the F values, about 8–9% if the p values are taken as correct (F of 7.6 to 8.3).
- What is not affected. The functional-connectivity results, which have their own tables with T(127) and FDR-corrected p values, and the sex and age-group differences in volume do not depend on these regressions.
Explanations considered
- A one-sided test. Does not account for the numbers. A one-sided p from t = √F is 0.040 (Right I–IV) and 0.041 (Right Crus II), not 0.005 or 0.007, and the Methods describe no directional test.
- The values printed as F are really t statistics. This partly reconciles the numbers but does not fit them. Read as t(88), 3.15 and 3.09 give F = 9.92 and 9.55, R2 = 0.101 and 0.098, and adjusted R2 = 0.091 and 0.088, which round to the 0.1 given for Right Crus II. But the two-sided p would be 0.0022 and 0.0027, not 0.005 and 0.007; the adjusted R2 for Right I–IV would still not be 1; and neither the "14%" nor Figure 9's R2 of 0.185 and 0.128 would match. Nothing in the paper indicates that these are t values.
- Different degrees of freedom. Does not account for the numbers. With the full sample (df2 = 136) or the df of the functional tables (T(127)), F = 3.15 still gives p = 0.078 and F = 3.09 gives p = 0.081.
- The df of 88 reflects missing hormone data. Possible, and so the 90 versus 138 gap is not counted as an error. The paper does not say how many participants had usable hormone values for these models. A low-resolution copy of Figure 9 appears to hold more than 90 points (a rough automated marker count gives about 120 to 130; overlapping markers make an exact count impossible), so the analysed n is uncertain. Whatever n is, it does not reconcile F, p and R2: the F-to-p conversion barely changes with df2 (above), and with n = 129 or 138 Figure 9's R2 values would give p below 10−4.
- Covariates in the models. Ruled out by the Methods, which name hormone level as the only independent variable. Extra covariates would also not make an adjusted R2 of 1 compatible with F = 3.15.
- "Adjusted R2 = 1" is a typo for 0.1. Likely for that single value. The bioRxiv preprint (PMC11230255, Table 10) gives "Adjusted R2=.1" for both regions, so the published "1" most likely differs from ".1" only by a lost leading decimal point. This does not resolve the conflict: F = 3.15 implies an adjusted R2 of 0.024, and an adjusted R2 of 0.1 would need F = 10.89. The preprint has the same F values (3.15 and 3.09) alongside the same slope p values (0.005 and 0.007), and says "The models explain approximately 14% of the variance".
- The p values belong to the slope and the F to the model. Does not account for the numbers. In a one-predictor regression the two tests are the same test (t2 = F), so they cannot differ.
- Figure 9 shows a different model. Possible. Its y-axes are in mm³, whereas the Methods say the regressions used TIV-normalised volumes, so its R2 values may come from a regression on raw volumes. But this does not account for the text. Within the figure, R2 = 0.185 and 0.128 cannot both have p = 0.005 at the same n: at n = 90 they give p = 2.3 × 10⁻⁵ and 0.00054, and p = 0.005 would need n of about 42 and 61 respectively.
- A PMC conversion or typesetting artifact. Ruled out. The Europe PMC JATS XML and the live PMC page carry the same numbers with the superscript of R² and the minus signs intact. The numbers are in running text, not table cells. The Figure 9 values are in the publisher's own image.
- A correction already issued. None found (see Status).
- Side note, not part of the finding. The abstract gives the age groups as 38 EMA, 48 LMA and 42 OA, which sum to 128. The Methods give 48 EMA, which with the same LMA and OA counts sums to the stated 138.
Status
- Version of record. The publisher's site (Wiley Online Library, reached through doi.org) returned HTTP 403 to automated requests, so the typeset PDF was not read. The publisher-supplied JATS text was checked in the Europe PMC full-text XML and on the live PMC page: both show the passages quoted above, in section 3.3.2. Figure 9 was read from the publisher's image file (
HBM-46-e70356-g001.jpg) in the Europe PMC supplementary bundle. Every text quotation was checked verbatim against the PMC-archived text withsrc/show.py. - Supplements. Data S1 (
HBM-46-e70356-s001.docx), the only supplementary file, holds Supplementary Tables 1–3: coordinates, T statistics and pFDR for the functional-connectivity correlations with testosterone and progesterone. It has no output for the structural regressions, no n and no standard errors. The earlier bioRxiv preprint (doi:10.1101/2024.06.24.600454; PMC11230255, Table 10) was also checked, as described above. - Corrections and comments. As of 2026-10-24 I found no correction, erratum, retraction or expression of concern.
src/known.pyreturns no Crossref update relations, no PMC notices and no Europe PMC notices. The Crossref record has empty update-to, updated-by and relation fields. The Europe PMC record (PMID 40960201) lists only the preprint ("Update of"). The PubPeer API returned no record (HTTP 404) for the DOI, and a web search for the title together with "PubPeer" found no thread. - Sources. PMC article PMC12442050; Europe PMC full-text XML, metadata and supplementary files for PMC12442050; bioRxiv preprint PMC11230255 (Europe PMC full-text XML); Crossref; PubPeer; https://doi.org/10.1002/hbm.70356.
Suggested correction
The authors could re-run the two testosterone–volume regressions and report, for each, the analysed n, R2, adjusted R2, F with its degrees of freedom, the slope with its standard error and units, and the p value, all from the same model output. If the corrected statistics confirm p < 0.05, the passage in section 3.3.2 should be replaced with those values, the Figure 9 labels made consistent with them (or labelled as a separate raw-volume model, if that is what they show), and the "approximately 14%" changed to the R2 actually obtained. If the F values of 3.15 and 3.09 are correct, the associations are not significant at the paper's α = 0.05 (p = 0.079 and 0.082). In that case the Results sentence "only T levels were significantly associated with volume" should be withdrawn, along with the Discussion statements that testosterone "showed a significant relationship with cerebellar structure" and "underscores its potential as a biomarker", and the structural part of the closing claims. It would also help to state why the models have df2 = 88 when 138 participants were included, and to correct the EMA group size in the abstract (38) to match the Methods (48).