← Back to the plain-language case
Week-24 HDRS-17 difference reported as P < .001; its t129 = 0.71 gives P = .48
JAMA Netw Open (2025) · doi:10.1001/jamanetworkopen.2025.29427 · PMC12406064
Summary
This randomized trial compared measurement-based care (MBC) with standard care for major depressive disorder. For the secondary outcome of change in HDRS-17 score at week 24, it reports a reduction of 18.1 points (95% CI, 16.4–19.6) with MBC and 17.0 points (95% CI, 15.6–18.5) with standard care, with "t129 = 0.71; P < .001". The same values appear in the Abstract, the Results and Table 3, and the Abstract calls the difference "significantly but modestly greater". The printed statistic gives a two-sided P of 0.48: on 129 degrees of freedom, P < .001 needs |t| ≥ 3.37. Rebuilding the test from the printed group CIs gives t = 1.02 and P = 0.31, and the 95% CI of the 1.1-point difference (−1.04 to 3.24) includes zero. As printed, the Abstract presents the trial's prespecified end-of-study outcome for change in symptom severity as a significant benefit of MBC, but the paper's own numbers show no significant difference. The other week-24 efficacy results were already nonsignificant. The primary time-to-event outcomes are not affected.
What the paper reports
Abstract, Results:
After week 24, reduction in mean HDRS-17 scores was significantly but modestly greater in the MBC group than in the standard care group (-18.1 [95% CI, 16.4-19.6] points vs -17.0 [95% CI, 15.6-18.5] points; t129 = 0.71; P < .001).
The sentence just before it in the Abstract reads:
At week 24, there were no significant differences in rates of response or remission between groups.
Results, fourth paragraph (beginning "After week 24, the response rates..."):
After week 24, the reduction in mean HDRS-17 scores was larger in the MBC group than in the standard care group (-18.1 [95% CI, 16.4-19.6] points vs -17.0 [95% CI, 15.6-18.5] points; t129 = 0.71; P < .001) (Table 3)
Table 3 (Efficacy Outcomes), last row (measure | MBC group | standard care group | P value):
Change in HDRS-17 score, mean (95% CI), points | 18.1 (16.4-19.6) | 17.0 (15.6-18.5) | <.001
Methods, Statistical Analysis:
Baseline HDRS-17 scores, antidepressant doses, number of clinic visits, changes in HDRS-17 at week 24, and number of adverse effects were compared with independent, 2-tailed t tests or Mann-Whitney tests, as appropriate. The significance threshold was 2-tailed P < .05 for all analyses.
Supplement 1 (trial protocol and statistical analysis plan), Statistical analysis, in both the protocol and the SAP section:
Analysis of covariance will be used to compare the changes in HDRS scores between the two groups.
(The protocol version reads "changes in HDRS and YMRS scores".) In the same documents, independent-sample t tests, Mann-Whitney U tests and χ² tests are planned for sociodemographic and clinical characteristics, discontinuation, response and remission rates, and side effects. The published Methods instead list changes in HDRS-17 at week 24 among the outcomes compared with independent t tests or Mann-Whitney tests.
Table 2, week 24 (MBC vs standard care): "No." 64 vs 67; "HDRS-17 score, mean (SD)" 5.6 (4.2) vs 6.7 (4.7), P value ".14".
In the archived text, "t129" is t with subscript 129 (the degrees of freedom). The publisher's HTML prints the two changes as −18.1 and −17.0 with a true minus sign. All quotes were checked verbatim against the PMC-archived article text.
What the paper's own numbers show
Method. I made three independent checks, all with scipy (see recompute.py.txt).
- I converted the printed statistic, t = 0.71 on 129 df, to a two-sided P value.
- I rebuilt the between-group test from the printed group means and 95% CIs. I took each group's standard error as (upper − lower) / (2 × t₀.₉₇₅, n−1), using the week-24 sample sizes of 64 and 67 from Table 2. These sizes also match Table 3's percentages (57/64 = 89.1%, 58/67 = 86.6%) and the printed df (64 + 67 − 2 = 129). From those SEs I ran a pooled-variance t test, and as a check a Welch test and a normal approximation. To allow for rounding, I shifted each of the six printed values by ±0.05 and recomputed t at every combination of shifts.
- I recomputed the Table 2 week-24 comparison of HDRS-17 levels from the printed means, SDs and sample sizes.
- I approximated the analysis the protocol planned, an analysis of covariance (ANCOVA) of the change with baseline HDRS-17 as covariate. From the identity SD(change)² = SD(baseline)² + SD(week 24)² − 2r·SD(baseline)·SD(week 24), the pooled SDs (baseline 4.66 from Table 2, week 24 4.46 from Table 2, change 6.17 from the Table 3 CIs) give the baseline-to-week-24 correlation r. The ANCOVA residual SD is then SD(week 24)·√(1 − r²). This is approximate: Table 2's baseline SDs (5.0 and 4.3) are for all 154 randomized participants, not only the 131 week-24 completers. The completers' baseline means implied by Table 2 and Table 3 (18.1 + 5.6 and 17.0 + 6.7) are both 23.7, so baseline adjustment leaves the 1.1-point difference unchanged.
| Quantity | Location | Reported | Recomputed |
|---|---|---|---|
| Two-sided P for t = 0.71, df = 129 | Abstract; Results, 4th paragraph | P < .001 | 0.479 (one-sided 0.239); 0.476–0.482 for t from 0.705 to 0.715 |
| |t| needed for two-sided P < .001 at df = 129 | derived | — | 3.37 (for P < .05: 1.98) |
| Degrees of freedom | Abstract; Table 2 week-24 "No." | 129 | 64 + 67 − 2 = 129, consistent with a two-group comparison |
| Difference in mean change, MBC − standard care | Table 3 | 18.1 vs 17.0 | 1.1 points |
| Group SEs implied by the 95% CIs | Table 3 | CI widths 3.2 and 2.9 | 0.80 (SD 6.41) and 0.73 (SD 5.94) |
| Between-group t from the CIs (pooled) | Table 3 | t129 = 0.71; P < .001 | t = 1.02, df 129, P = 0.31 (Welch t = 1.02, df 127, P = 0.31; normal approximation z = 1.00, P = 0.32) |
| Same, with ±0.05 rounding on all printed values | Table 3 | — | t 0.90 to 1.15; P 0.25 to 0.37 |
| 95% CI of the 1.1-point difference | derived from Table 3 | not reported | −1.04 to 3.24 (includes 0) |
| SE of the difference that P < .001 would need | derived | — | ≤ 0.33; the CIs imply 1.08, about 3.3 times larger |
| SE and 95% CI implied by the printed t = 0.71 | derived | — | SE 1.55; CI −1.97 to 4.17 (includes 0) |
| ANCOVA adjusted for baseline (protocol's planned analysis) | Supplement 1; Tables 2–3 SDs | not reported | residual df 128, so F₁,₁₂₈, not t₁₂₉; implied r ≈ 0.08 (0.04 and 0.13 by group); F₁,₁₂₈ ≈ 2.0, P ≈ 0.16 |
| Correlation the ANCOVA would need for P < .001 | derived | — | residual SD ≤ 1.87, i.e. r ≥ 0.91 (for P < .05: r ≥ 0.70) |
| Week-24 HDRS-17 level, 5.6 (4.2) n = 64 vs 6.7 (4.7) n = 67 | Table 2 | P = .14 | t = −1.41, df 129, P = 0.16 (also nonsignificant) |
| Within-group change from baseline (one-sample t) | from Table 3 CIs | — | MBC t = 22.6, df 63; standard care t = 23.4, df 66; both P < 10⁻³⁰ |
| Week-4 HDRS-17 level, 8.3 (4.9) vs 12.6 (8.1) | Table 2 | P < .001 | t = −3.72, df 135, P = 0.0003 (consistent) |
| Weeks 2, 8, 12 HDRS-17 level | Table 2 | .05, .02, .04 | 0.056, 0.017, 0.034 (consistent) |
| Response at week 24, 57/64 vs 58/67 | Table 3; Results, 4th paragraph | χ² = 0.19; P = .79 | Pearson χ² = 0.19, P = 0.66; Fisher exact P = 0.79 |
| Remission at week 24, 47/64 vs 42/67 | Table 3; Results, 4th paragraph | χ² = 1.74; P = .20 | Pearson χ² = 1.74, P = 0.19; Fisher exact P = 0.20 |
| Response at week 12, 58/64 vs 46/68 | Table 3 | P < .001 | Pearson P = 0.0012; Fisher exact P = 0.0013 |
Every check of the week-24 change comparison gives a P value between about 0.16 and 0.48. None comes near .001. The other HDRS-17 comparisons in Table 2 and the response and remission comparisons in Table 3 reproduce closely; the dose and visit comparisons in Table 2 were not checked. Two of them have small discrepancies that do not change significance: the week-24 rate P values match Fisher's exact test rather than the Pearson χ² printed beside them, and the week-12 response P is 0.0012–0.0013, not < .001. Those two points are outside the scope of this report. The printed t of 0.71 is not exactly reproducible from the printed CIs either (they give t ≈ 1.02). Whichever of the two is used, the result is clearly nonsignificant.
Figure
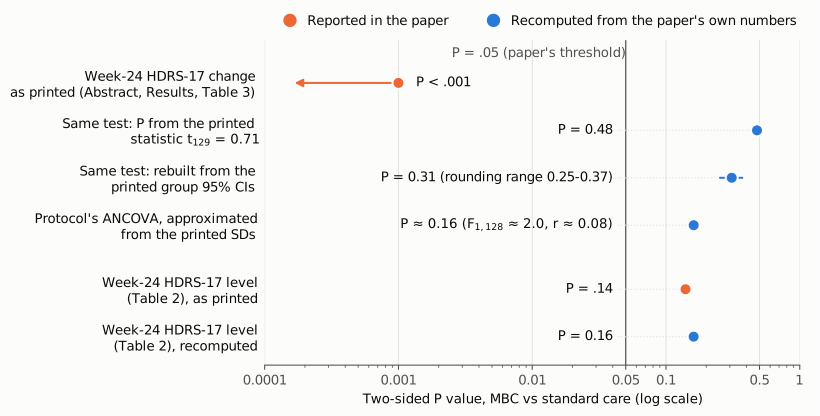
Figure 1. Two-sided P values for MBC versus standard care at week 24, on one log-scaled axis. The thin vertical line marks the paper's significance threshold of P = .05. Orange marks values printed in the paper and blue marks values recomputed from the paper's own numbers. The top row is the printed P < .001 for the difference in HDRS-17 change; the arrow shows that the printed value is an upper bound. The next three rows recompute the same comparison: from the printed statistic t129 = 0.71 (P = 0.48); from the printed group 95% CIs (P = 0.31; the short bar is the range when each printed value is shifted by ±0.05 for rounding, 0.25–0.37); and as the ANCOVA planned in the protocol, approximated from the printed SDs (P ≈ 0.16 at the implied baseline-to-week-24 correlation r ≈ 0.08). Each row's value is printed to the left of the threshold line, joined to its marker by a dotted leader. The bottom two rows show the closely related week-24 comparison of HDRS-17 levels in Table 2, as printed (P = .14) and as recomputed (P = 0.16). Only the printed P for the change score lies below the threshold.
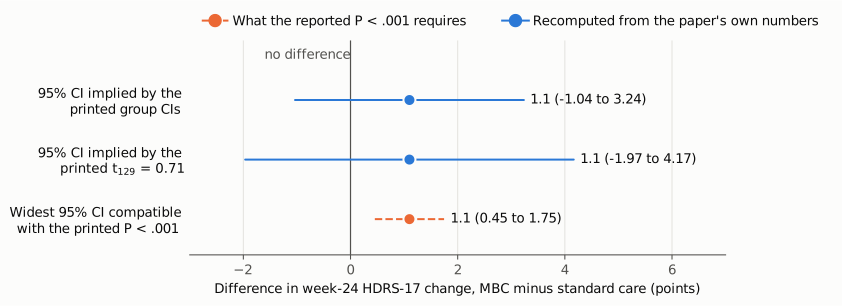
Figure 2. The between-group difference in week-24 HDRS-17 change (MBC minus standard care, 1.1 points), on a points scale with zero (no difference) marked. Blue: the 95% CI of the difference implied by the printed group CIs (−1.04 to 3.24) and by the printed t129 = 0.71 (−1.97 to 4.17). Both include zero. Orange, dashed: the widest 95% CI that a 1.1-point difference could have if the printed P < .001 were correct (0.45 to 1.75, SE ≤ 0.33). That interval is about one third as wide as the one the paper's own CIs imply.
Why it matters
Change in HDRS-17 score at week 24 is a prespecified secondary outcome: the trial's end-of-study outcome for change in symptom severity. The Abstract reports it as the one positive week-24 efficacy finding ("significantly but modestly greater ... P < .001"), immediately after stating that week-24 response and remission rates did not differ. With the P value corrected, no week-24 efficacy outcome favours MBC significantly: response P = .79, remission P = .20, HDRS-17 level P = .14 (Table 2), and HDRS-17 change P ≈ .48 (from the printed t), ≈ .31 (from the printed CIs) or about .16 (the protocol's ANCOVA, approximated from the printed SDs). The difference still favours MBC by 1.1 points, but its 95% CI runs from about −1 to +3 points. That interval is compatible with no difference.
As printed, a reader of the Abstract would conclude that MBC produced both faster improvement and a reliably greater reduction in severity by the end of the study. The paper's own numbers support only the first. The error is repeated in three places (Abstract, Results, Table 3), with no correct value given anywhere in the paper.
Not affected: the primary outcomes, time to response and time to remission (log-rank P = .001 for both; Cox HR 1.53 and 1.80); the week-12 rate differences; and the formal Conclusions, which rest on the time-to-event results. The Key Points do not cite this result.
Explanations considered
- A within-group (change-from-baseline) test. This is the only reading that yields P < .001: the one-sample t statistics are 22.6 and 23.4, with P < 10⁻³⁰. It does not fit the paper, though. Each within-group test has 63 or 66 df, not 129. The reported t is 0.71, not over 20. The P value sits in Table 3's between-group P value column. Both text passages describe a comparison ("greater in the MBC group than in the standard care group"). It does not account for the numbers.
- A one-sided test. One-sided P = 0.24. The Methods specify 2-tailed tests. It does not account for the numbers.
- A Mann-Whitney test instead of a t test. The Methods allow either "as appropriate". The printed statistic, however, is a t with 129 df, not a U or z statistic. The summary data show a 1.1-point difference against within-group SDs of about 6 (a standardized difference of about 0.18). A rank test with P < .001 would need a much larger separation between the groups than these summaries suggest. A rank-based result cannot be fully ruled out from summary data alone, but nothing in the paper reports one, and it would not match the t129 = 0.71 printed next to the P value.
- A covariate-adjusted analysis. The trial protocol and statistical analysis plan (Supplement 1) planned exactly this: "Analysis of covariance will be used to compare the changes in HDRS scores between the two groups." The published Methods instead name independent t tests or Mann-Whitney tests for the change at week 24. An ANCOVA still does not fit the printed result. With baseline as a covariate, the model has 64 + 67 − 3 = 128 residual df, and the group effect would be reported as F on 1 and 128 df, not as t129. On the numbers, P < .001 for a 1.1-point adjusted difference needs F ≥ 11.3, which means a residual SD of at most 1.87 and a baseline-to-week-24 correlation of at least 0.91. The printed SDs (baseline 5.0 and 4.3, week 24 4.2 and 4.7, change about 6.17 from the CIs) imply a correlation of about 0.08 (0.04 in the MBC group, 0.13 with standard care). That is approximate, because the baseline SDs are for all randomized participants, but it is far below 0.91. At that correlation the ANCOVA gives F₁,₁₂₈ ≈ 2.0 and P ≈ 0.16; even r = 0.7 would give only P ≈ .05. It does not account for the numbers.
- The t statistic is the misprint, not the P value. If P < .001 were correct, |t| would have to be at least 3.37 and the SE of the difference at most 0.33. The printed group CIs independently imply an SE of about 1.08 and t ≈ 1.02. Table 2's week-24 levels (P = .14) also show no significant difference. The P value is the number that conflicts with everything else, whichever of the two printed statistics is used.
- Rounding, or asymmetric CIs. Shifting all six printed values by ±0.05 keeps P between 0.25 and 0.37. The MBC interval is slightly asymmetric (1.7 below the mean, 1.5 above), which may mean it is not a plain t interval (for example, a bootstrap interval). Even if both group SEs were halved, t would be about 2 and P about .04, still far from .001. Rounding does not account for the numbers.
- Text-conversion artifact. The publisher's current HTML, the PMC page and the Europe PMC JATS XML all carry the same values. In the XML, the statistic is marked up as italic t with subscript 129, "0.71" uses a normal decimal point, and "<" encodes "<". The Table 3 row has four cells, with "<.001" in the P value column. A conversion artifact is ruled out.
Status
As of 2026-10-23:
- Version of record. The DOI resolves to the publisher's article page (jamanetwork.com/journals/jamanetworkopen/fullarticle/2838317). I fetched it on 2026-10-23. It is the current, corrected version and carries the notice "This article was corrected on July 14, 2026, to fix the values reported in the last 3 rows of Table 1." Its Abstract, Results and Table 3 still read "t129 = 0.71; P < .001" and "<.001", as quoted above. The PMC HTML page and the Europe PMC JATS XML match.
- Corrections. There is one correction: "Errors in Table 1" (doi:10.1001/jamanetworkopen.2026.26785; PMC13370302; July 2026). It concerns only the annual participant income, household income and time-since-diagnosis medians and IQRs in Table 1, which had been calculated with the SPSS "HAVERAGE" method. It does not address the week-24 HDRS-17 change result. Crossref update metadata and PMC notices list nothing else; Europe PMC lists only this correction.
- Supplements. I read all three supplementary PDFs from the Europe PMC supplementary-files archive. Supplement 1 is the trial protocol and statistical analysis plan. It plans independent-sample t tests, Mann-Whitney U tests and χ² tests for baseline characteristics, discontinuation, response and remission rates and side effects, and specifies analysis of covariance for the between-group comparison of HDRS changes; the published Methods specify independent t tests or Mann-Whitney tests for that comparison. Supplement 1 contains no outcome numbers. Supplement 2 contains eTables 1–3 (MBC schedule, adherence, adverse effects) and the eFigure (time to discontinuation); none of them analyses week-24 HDRS-17 change. Supplement 3 is the data sharing statement. Nothing in the supplements resolves the inconsistency.
- PubPeer and other discussion. An earlier audit step on the same day found no PubPeer thread for the DOI or title. The secondary news coverage that was read (2 Minute Medicine) does not mention the inconsistency. The full text of the linked invited commentary (doi:10.1001/jamanetworkopen.2025.29440) could not be accessed: the publisher page returned a bot-verification page, the PDF text was not extractable, and it is not in PMC or Europe PMC full text. Whether it mentions the inconsistency is therefore unknown. The PubPeer search page and API returned a human-verification challenge (HTTP 403). A repeat web search for this write-up was not possible because the session's search allowance was used up.
- Sources. https://doi.org/10.1001/jamanetworkopen.2025.29427; https://pmc.ncbi.nlm.nih.gov/articles/PMC12406064/; Europe PMC full text and supplementary files for PMC12406064; https://doi.org/10.1001/jamanetworkopen.2026.26785 (PMC13370302); Supplement 1 (jamanetwopen-e2529427-s001.pdf, Europe PMC supplementary files); https://www.2minutemedicine.com/measurement-based-care-to-enhance-antidepressant-treatment-outcomes-in-major-depressive-disorder-a-randomized-clinical-trial/.
Suggested correction
The authors should check the analysis output for the week-24 change comparison. The P value is 0.48 if the printed t129 = 0.71 is right, and about 0.31 if the printed group CIs are right; whichever value the analysis produces should be reported with the matching statistic. Adding the between-group difference and its 95% CI would let readers check the result directly. Using the printed t:
Abstract, Results. Replace "After week 24, reduction in mean HDRS-17 scores was significantly but modestly greater in the MBC group than in the standard care group (... t129 = 0.71; P < .001)." with:
After week 24, reduction in mean HDRS-17 scores did not differ significantly between the MBC group and the standard care group (−18.1 [95% CI, 16.4-19.6] points vs −17.0 [95% CI, 15.6-18.5] points; t129 = 0.71; P = .48).
Results, fourth paragraph. Replace "the reduction in mean HDRS-17 scores was larger in the MBC group than in the standard care group (... t129 = 0.71; P < .001)" with:
the reduction in mean HDRS-17 scores did not differ significantly between the MBC group and the standard care group (−18.1 [95% CI, 16.4-19.6] points vs −17.0 [95% CI, 15.6-18.5] points; t129 = 0.71; P = .48)
Table 3, last row. Replace the P value "<.001" with ".48", or with the value from the verified analysis.
With these changes, the Abstract sentence "No differences were observed in other secondary outcomes" would also cover HDRS-17 change. The Conclusions do not need to change.