← Back to the plain-language case
Reported overall 90-day mortality of 63.7% conflicts with the paper's own counts of 408 deaths
Lancet Reg Health Eur (2025) · doi:10.1016/j.lanepe.2025.101317 · PMC12266187
Summary
The abstract and the Results give the overall 90-day mortality of the 1109 included patients as "63.7% (n = 707)". Every breakdown of those same 1109 patients in the paper adds up to 408 deaths (36.8%) and 701 survivors (63.2%). The breakdowns are the three PROMISE risk groups, the two GRIm risk groups, and the PROMISE and GRIm death counts in the four cancer-type subgroups. The reported median overall survival of 4.78 months is longer than 90 days, which on its own requires 90-day mortality below 50%. The printed figure therefore overstates the cohort's primary-outcome event rate by 299 deaths, about 27 percentage points. It is also used in the Discussion to argue that mortality was higher than in the cohort in which PROMISE was developed.
What the paper reports
The headline figure, in the abstract:
PROMISE and GRIm scores were calculated for all 1109 patients, while CTI score was assessed in 333 patients with complete laboratory data. The 90-day mortality rate was 63.7% (n = 707).
— Abstract, Findings
The same figure opens the outcome paragraph of the Results, followed directly by the stratified counts:
The overall 90-day mortality rate was 63.7% (n = 707). For the PROMISE score, 271 patients (97.5%) in the low-risk group survived, with a 90-day mortality rate of 2.5% (n = 7). In the intermediate-risk group, 176 patients (81.9%) survived, and the 90-day mortality rate was 18.1% (n = 39). In the high-risk group, 254 patients (41.2%) survived, with a 90-day mortality rate of 58.8% (n = 362) (p < 0.0001). According to the PROMISE score, the median overall survival (OS) for the entire cohort was 4.78 months (95% CI: 4.29–5.28). For the GRIm score, the 90-day survival rate was 87.8% (n = 449) for low-risk patients and 42.2% (n = 252) for high-risk patients (p < 0.0001). The estimated median OS for the entire cohort was 4.63 months (95% CI: 4.14–5.12).
— Results, overall outcome paragraph
The risk-group sizes:
According to the PROMISE score, 278 patients (25.1%) were categorized as low risk, 215 patients (19.4%) as intermediate risk, and 616 patients (55.5%) as high risk. The GRIm score classified 511 patients (46.0%) as low risk and 598 patients (54.0%) as high risk.
— Results, patient characteristics paragraph (Table 1 column headers give the GRIm groups as "Low risk, n = 510 (46.0%) | High risk, n = 599 (54.0%)")
The cancer-type subgroups (PROMISE and GRIm sentences only; the CTI sentences refer to the 333-patient subset):
For lung cancer patients (n = 283), mortality rates based on the PROMISE score were 2.4% (n = 1) in the low-risk group, 3.6% (n = 2) in the intermediate-risk group, and 51.9% (n = 96) in the high-risk group (p < 0.0001). [...] The GRIm score showed a 7.9% (n = 9) mortality rate in the low-risk group and 53.3% (n = 90) in the high-risk group (p < 0.0001).
For gastrointestinal cancer patients (n = 350), the PROMISE score demonstrated mortality rates of 6.0% (n = 5) in the low-risk group, 23.7% (n = 18) in the intermediate-risk group, and 63.2% (n = 120) in the high-risk group (p < 0.0001). [...] The GRIm scores indicated a 13.6% (n = 20) mortality rate in the low-risk group compared to 60.6% (n = 123) in the high-risk group (p < 0.0001).
For breast cancer patients (n = 92), the PROMISE score revealed 90-day mortality rates of 2.8% (n = 1) in the low-risk group, 21.4% (n = 3) in the intermediate-risk group, and 59.5% (n = 25) in the high-risk group (p < 0.0001). [...] The GRIm score demonstrated mortality rates of 6.8% (n = 3) in the low-risk group compared to 54.2% (n = 26) in the high-risk group (p < 0.0001).
For patients with other cancers (n = 384), PROMISE score analysis showed no 90-day mortality in the low-risk group (n = 0), a mortality rate of 23.2% (n = 16) in the intermediate-risk group, and 60.8% (n = 121) in the high-risk group (p < 0.0001). [...] The GRIm scores revealed a 14.6% (n = 30) mortality rate in the low-risk group and 59.8% (n = 107) in the high-risk group (p < 0.0001).
— Results, section "Subgroup analysis by cancer type" ([...] marks omitted median-OS sentences)
The separately reported subset of 333 patients with a CTI score:
In this study, the 90-day mortality rate among 333 patients assessed using the CTI score was 35.1% (n = 117).
— Results, CTI subset paragraph
The Discussion:
According to the results of our study, the 90-day mortality rate was higher compared to the study by Mirallas et al., in which the PROMISE score was developed.
In the study by Mirallas et al., survival rates for low, intermediate, and high-risk groups were reported as 83.6%, 68.0%, and 33.4%, respectively.
— Discussion
Each quotation was checked against the article as archived in PubMed Central (src/show.py PMC12266187). Each one occurs exactly once (passages joined by [...] were checked sentence by sentence), and recompute.py.txt reruns that check.
What the paper's own numbers show
Method. The paper states that PROMISE and GRIm were calculated for all 1109 patients, and the PROMISE group sizes (278 + 215 + 616) and the cancer-type subgroup sizes (283 + 350 + 92 + 384) each sum to 1109. Each of these breakdowns is therefore exhaustive, and summing its death counts gives the cohort's total number of 90-day deaths. For PROMISE the paper gives deaths and survivors per group. For GRIm it gives survivors per group, so deaths are group size minus survivors, using either the text's or Table 1's group sizes. For the cancer types it gives deaths per risk group under each score. As an independent check, the Kaplan–Meier median OS is compared with the 90-day time point. The 333-patient CTI subset is recomputed the same way. No number was estimated; every input is a count or percentage printed in the text or Table 1. recompute.py.txt prints every value below and redraws both figures.
| Quantity | Location | Reported | Recomputed from the paper's own numbers |
|---|---|---|---|
| Overall 90-day mortality, 1109 patients | Abstract, Findings; Results, outcome paragraph | 63.7% (n = 707) | 408 deaths, 36.8% (every row below). Arithmetic check: 707/1109 = 63.75% |
| PROMISE deaths, low + intermediate + high | Results, outcome paragraph | 7, 39, 362 (2.5%, 18.1%, 58.8% of 278, 215, 616) | 7 + 39 + 362 = 408. Group percentages reproduce exactly |
| PROMISE survivors | Results, outcome paragraph | 271, 176, 254 | 271 + 176 + 254 = 701; 408 + 701 = 1109 |
| GRIm deaths (group size − survivors) | Results, outcome paragraph; Table 1 | survivors 449 (87.8%), 252 (42.2%); n 510/599 (Table 1) or 511/598 (text) | (510 − 449) + (599 − 252) = 61 + 347 = 408; with text n, 62 + 346 = 408. Survivors 449 + 252 = 701 |
| Deaths by cancer type, PROMISE | Results, "Subgroup analysis by cancer type" | lung 1+2+96, GI 5+18+120, breast 1+3+25, other 0+16+121 | 99 + 143 + 29 + 137 = 408 (n = 1109) |
| Deaths by cancer type, GRIm | Results, "Subgroup analysis by cancer type" | lung 9+90, GI 20+123, breast 3+26, other 30+107 | 99 + 143 + 29 + 137 = 408; per cancer type identical to PROMISE |
| Median OS vs 90-day mortality | Results, outcome paragraph | median OS 4.78 months ("According to the PROMISE score"); 4.63 months (stated after the GRIm results) | Both exceed 90 days (2.96 months), so Kaplan–Meier survival at 90 days is above 50% and 90-day mortality is below 50%. 707 deaths within 90 days would force Kaplan–Meier mortality at 90 days to at least 63.8% and the median below 90 days |
| CTI subset, 333 patients | Results, CTI subset paragraph | 35.1% (n = 117) | 117/333 = 35.1%. Also (166 − 147) + (167 − 69) = 117; PROMISE within subset 3 + 12 + 102 = 117; Combined score 0 + 1 + 116 = 117; CTI by cancer type 21 + 40 + 20 + 36 = 117. Consistent |
| Gap between stated and recomputed | — | 707 (63.7%) | 707 − 408 = 299 deaths; 63.75 − 36.79 = 27.0 percentage points |
Four exhaustive breakdowns, drawn from two scores and two different groupings of the same patients, agree on 408 deaths. They also agree on 701 survivors where survivors are given. The subset of 333 patients, reported the same way, is fully consistent, so the reporting of the stratified counts can be reproduced throughout. Only the single overall figure departs from them. Its percentage, 63.7%, is close to the share who survived (701/1109 = 63.2%), not the share who died.
Figure
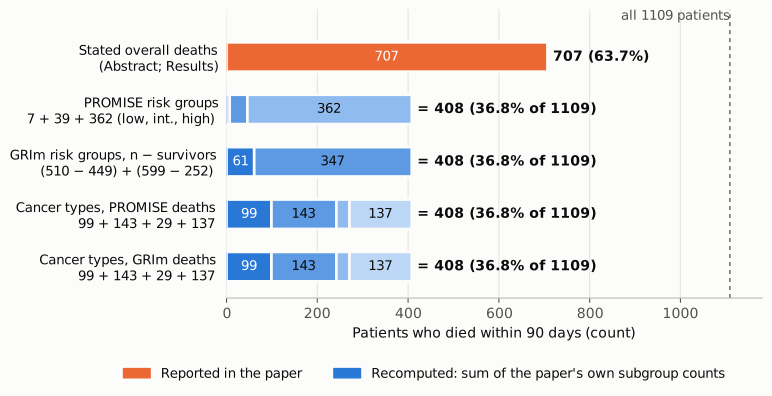
Figure 1. Number of the 1109 included patients who died within 90 days. The orange bar is the overall figure printed in the abstract and Results (707, "63.7%"). Each blue bar sums the death counts the paper itself reports for one exhaustive breakdown of the same 1109 patients: the three PROMISE risk groups, the two GRIm risk groups (group size from Table 1 minus reported survivors), and the PROMISE and GRIm deaths in the four cancer-type subgroups. Segments are drawn in the order the formula on each row lists them; unlabeled thin segments are 7, 39 and 29. The dashed line marks the cohort size. All four breakdowns give 408 deaths (36.8%). Values come from the article text and Table 1 and are recomputed by recompute.py.txt.
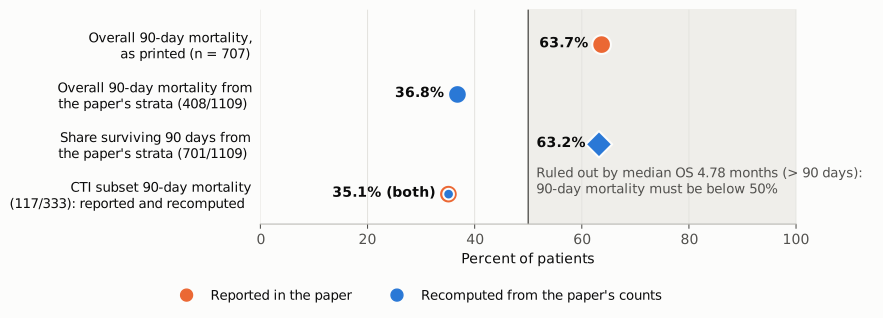
Figure 2. The same comparison as percentages on one 0–100% axis. The printed overall mortality (orange, 63.7%) lies in the shaded region that the paper's own median OS of 4.78 months rules out. A Kaplan–Meier median longer than 90 days means fewer than half the patients had died by day 90. The mortality recomputed from the strata (36.8%) lies outside it. The printed value sits next to the recomputed survival share (blue diamond, 63.2%). The bottom row shows the separately reported CTI subset, where the reported value (orange ring) and the recomputed value (blue dot) coincide at 35.1%.
Why it matters
- The abstract misstates the event rate of the primary outcome. 90-day mortality is the outcome the scores are validated against. A reader taking the abstract at face value would conclude that nearly two in three patients with an unplanned oncology admission died within three months. The paper's own data indicate a little over one in three.
- The Discussion's comparison with the development cohort rests on it. The paper says 90-day mortality "was higher compared to the study by Mirallas et al." and attributes the difference to access to palliative care and to palliative patients being admitted to oncology wards. That comparison and its explanation should be re-examined with 36.8%. The stratum-level survival figures the Discussion quotes for the development study (83.6%, 68.0%, 33.4%) are each lower than this cohort's (97.5%, 81.9%, 41.2%). The paper does not report the development cohort's overall rate, so whether any difference remains cannot be judged from this article.
- Baseline risk used by readers. Anyone using the abstract as a baseline risk for this setting, for example to turn sensitivity and specificity into predictive values for local use, would start from the wrong figure.
- What is not affected by this error. The stratum-level mortality percentages, the Kaplan–Meier comparisons and the 333-patient CTI-subset counts do not use the 707 figure and are internally consistent. The direction of the main finding, that PROMISE and CTI separate low-risk from high-risk patients, does not depend on it.
- A separate observation, not part of this finding. Table 2 (n = 333) reports sensitivity, specificity, PPV, NPV and accuracy for each score. With the subset's own prevalence of 35.1% (117/333), the reported sensitivity and specificity imply different predictive values. For PROMISE, for example, they imply PPV 57.4%, NPV 91.3% and accuracy 72.9%, against the reported 78.0%, 83.0% and 79.9%. Taken one at a time, the reported PPV, NPV and accuracy correspond to prevalences of roughly 50–65%, not 35.1%. Table 2 gives no 2×2 counts, so the source of this cannot be determined. It is recorded here only so that Table 2 is not assumed to be unaffected;
recompute.py.txtprints the calculation (section 9).
Explanations considered
- A different denominator or population. Does not account for it. The 707 is attached to the full cohort in the abstract ("all 1109 patients") and the Results ("overall"). The PROMISE, GRIm and cancer-type breakdowns each cover exactly 1109 patients. The CTI subset has its own figure (117 of 333), which is consistent.
- Survivors labelled as deaths. Possibly related, but not an exact match. The paper's survivors total 701 (63.2%), not 707 (63.7%), so swapping the labels does not reproduce the printed numbers exactly. The closeness of 63.7% to 63.2% is consistent with a survival-type figure, or a mistyped count, having been entered in place of the mortality figure. The article does not allow this to be settled.
- A different time point (for example, deaths over the whole follow-up). Does not account for it. Both the abstract and the Results say "90-day mortality". The stratified counts that sum to 408 are explicitly 90-day counts. A median OS of 4.78 months (or 4.63 months) is incompatible with more than half the cohort dying by day 90.
- Patients excluded from the stratified analyses, for example censored before 90 days. Does not account for it. The stratified breakdowns account for all 1109 patients as either deaths or survivors (408 + 701 = 1109), leaving no patients unclassified. No patients are left over (1109 − 408 − 701 = 0) to supply 299 additional deaths.
- GRIm group sizes differ between text and Table 1 (511/598 vs 510/599). A minor separate inconsistency that does not affect the result: either version gives 408 deaths.
- Rounding. Does not account for it. Rounding only concerns the last digit: 707/1109 = 63.75%, which rounds to 63.8% rather than the printed 63.7%. The 27-point gap is unaffected.
- Conversion or typesetting artifact. Ruled out. The figures are plain prose and identical in the publisher-deposited JATS XML (Europe PMC) and the live PMC article. They involve no symbols, superscripts or table cells.
- A published correction. None found (see Status).
Status
- Version of record. The Elsevier and Lancet pages (linkinghub, ScienceDirect, thelancet.com HTML and PDF) returned HTTP 403 or a redirect page to scripted access, so the typeset page could not be read directly. The publisher-deposited JATS XML in Europe PMC and the live PMC article contain the same sentences in the abstract and the Results. The publisher's own Figure 2 image (from the Europe PMC supplementary bundle) gives numbers at risk at 3 months of 271/176/254 for PROMISE and 449/252 for GRIm, which sum to 701 in each case. These are consistent with 408 patients no longer at risk by about 90 days, not 707. That figure is cited here, not reproduced.
- Supplement. The single supplementary file (mmc1.docx, "Supplementary Figures S1–S6 and Table S1") was read in full. It contains univariable odds ratios, calibration statistics, Kaplan–Meier curves by cancer type, and baseline characteristics by CTI availability (333 vs 776). It reports no overall 90-day death count and does not resolve the discrepancy. No dataset is deposited.
- Corrections and notices. No correction, erratum, retraction or expression of concern was found. Crossref has no update-to or updated-by relations, and a Crossref
updatesfilter search returned none. PMC and Europe PMC list no notices; Europe PMC lists only the article (PMID 40672056) and a linked commentary in the same journal (PMC12173626). - PubPeer. PubPeer's search and API return a human-verification challenge to scripted access, so it could not be queried directly. A web search for the title and DOI found no PubPeer thread.
- Sources. Article as archived in PMC (PMC12266187); Europe PMC full-text XML and supplementary files; Crossref record for doi:10.1016/j.lanepe.2025.101317.
- As of 2026-10-23.
Suggested correction
In the abstract (Findings) and in the first sentence of the Results outcome paragraph, replace "63.7% (n = 707)" with the figure supported by the stratified data, which on the paper's counts is 36.8% (n = 408), after confirming it against the source dataset. In the Discussion, revisit the statement that 90-day mortality was higher than in the PROMISE development study, and the explanation offered for it, in light of the corrected rate. Two further points could be checked at the same time. One is the GRIm group sizes (511/598 in the text vs 510/599 in Table 1). The other is the predictive values in Table 2, which do not correspond to the 35.1% event rate of the 333-patient subset; giving the underlying 2×2 counts would let readers verify them.