← Back to the plain-language case
The abstract says RNF213 loss lowers IFN-β-induced ISG expression, but Fig 2A shows no difference
PLoS Pathog (2025) · doi:10.1371/journal.ppat.1013333 · PMC12251097
Summary
The abstract states that RNF213 deficiency "decreases the expression of interferon-stimulated genes (ISGs) in response to IFN-β stimulation and Acinetobacter baumannii infection." For the IFN-β condition the Results say the opposite: the IFN-β-induced increases in Cxcl9 and Cxcl10 "were comparable between WT and Rnf213–/– MSFs," and all 8 IFN-β comparisons of Cxcl9/Cxcl10 in Fig 2A (two cell types, two genes, two time points) are labelled "ns." Bar heights read off the published Fig 2A give a knockout-to-wild-type ratio of about 0.91–1.31 (geometric mean 1.04) under IFN-β, with the knockout numerically higher in half of the comparisons, versus about 0.30–0.63 (geometric mean 0.44, all 16 significant) under A. baumannii or LPS. This matters because the paper uses the intact IFN-β response as its evidence that RNF213 acts upstream of the IFN-α/β receptor (IFNAR), so the abstract sentence points to the opposite location in the pathway from the one the paper argues for.
What the paper reports
In the abstract:
RNF213 deficiency impairs type I interferon (IFN-I) production and decreases the expression of interferon-stimulated genes (ISGs) in response to IFN-β stimulation and Acinetobacter baumannii infection.
— Abstract
In the body, the same experiment (Fig 2A) is described as follows:
The increases in the expression of Cxcl9 and Cxcl10 induced by A. baumannii infection and LPS stimulation were much lower in Rnf213–/– MSFs than in WT MSFs (Fig 2A).
However, the increases in the expression of Cxcl9 and Cxcl10 induced by IFN-β treatment were comparable between WT and Rnf213–/– MSFs (Fig 2A).
Taken together, our results indicate that RNF213 positively regulates IFN-I signaling possibly by mediating events upstream of IFNAR binding.
— Results, section "IFN-I signaling is impaired in Rnf213–/– MSFs and BMECs"
RNF213 deficiency inhibited TBK1 phosphorylation and IFN-I production in response to LPS stimulation and A. baumannii infection but not in response to IFN-β treatment, suggesting that RNF213 positively regulates IFN-I signaling by acting on targets upstream of IFNAR (Figs 2D, 2E, S3C and S3D).
— Results, section "RNF213 targets TRAF3", first sentence
The cited figure is described in its legend as:
qRT-PCR analysis of Rnf213, Cxcl9 and Cxcl10 in WT and Rnf213–/– MSFs and BMECs without treatment or infected with A. baumannii (50 MOI); or stimulated with LPS (200 ng/mL) and IFN-β (2 ng/mL) for indicated times (n = 4 technical replicates; 3 independent experiments).
— Fig 2 legend, panel A
Each quotation was checked character for character against the article as archived in PubMed Central (src/show.py PMC12251097). Each one occurs exactly once; recompute.py.txt reruns that check.
What the paper's own numbers show
Method. The claim is about direction (a decrease versus no change), so the check has two parts.
- The significance label printed above each wild-type/knockout pair in Fig 2A was transcribed exactly, for every stimulated Cxcl9 and Cxcl10 comparison (3 stimuli × 2 cell types × 2 genes × 2 time points = 24). The legend states these labels come from two-sided Student's t-tests without multiple-comparison correction.
- To show the size of each difference, the article's Data Availability statement reports no numeric source data, so the bar heights (gene/Hprt) were measured on the publisher's large Fig 2 image. For each panel a straight line was fit through the printed y-axis tick marks (largest residual 0.2% of the axis maximum), and the top edge of each outlined bar was read against it. Where the replicate dots cover a bar's top, the value is bracketed between the top of the bar outline and the middle of the dot cluster; that range is carried through to the ratio. These readings are approximate. The conclusion does not rest on them: the printed "ns" labels and the Results text already state there is no difference under IFN-β.
recompute.py.txt prints every value below and redraws both figures.
| Quantity | Location | Reported | Recomputed from the paper's own data |
|---|---|---|---|
| Effect of RNF213 deficiency on ISG expression after IFN-β | Abstract | "decreases the expression of interferon-stimulated genes (ISGs) in response to IFN-β stimulation" | Not supported: no IFN-β ISG comparison in the paper shows a decrease (rows below) |
| Same effect, as described in the body | Results, Fig 2A paragraph | "comparable between WT and Rnf213–/– MSFs" | Agrees with Fig 2A |
| Cxcl9/Cxcl10 after IFN-β, MSFs + BMECs, 3 h and 6 h (8 comparisons) | Fig 2A, IFN-β row | All 8 labelled "ns" | Knockout ÷ WT ≈ 0.91–1.31; geometric mean 1.04; knockout numerically higher in 4 of 8 |
| MSF Cxcl10, 6 h, IFN-β | Fig 2A | "ns" | Knockout ÷ WT ≈ 1.31 (≈ 0.61 vs ≈ 0.47; knockout higher) |
| Cxcl9/Cxcl10 after A. baumannii, MSFs + BMECs, 3 h and 6 h (8 comparisons) | Fig 2A, A. baumannii row | All *, ** or *** | Knockout ÷ WT ≈ 0.35–0.63; geometric mean 0.44 |
| Cxcl9/Cxcl10 after LPS, MSFs + BMECs, 6 h and 12 h (8 comparisons) | Fig 2A, LPS row | All ** or *** | Knockout ÷ WT ≈ 0.30–0.57; geometric mean 0.44 |
| A. baumannii and LPS together (16 comparisons) | Fig 2A | 16 of 16 significant | Knockout ÷ WT ≈ 0.30–0.63 (largest upper bound of a reading range 0.72); geometric mean 0.44 |
| IFN-I production / TBK1 phosphorylation after IFN-β | Results, "RNF213 targets TRAF3" | "but not in response to IFN-β treatment" | No panel cited there (Figs 2D, 2E, S3C–D) includes IFN-β-stimulated cells; their legends list only untreated, A. baumannii and LPS conditions |
So under bacterial infection or LPS, knockout cells induce roughly 40–45% as much Cxcl9/Cxcl10 as wild-type cells (geometric mean 0.44 for both stimuli), and every one of the 16 comparisons is marked significant. Under IFN-β the two genotypes are indistinguishable: the ratios scatter on both sides of 1 (geometric mean 1.04; knockout numerically higher in 4 of 8), and all 8 are marked "ns." The paper's body reports exactly this pattern. Only the abstract sentence departs from it.
Figure
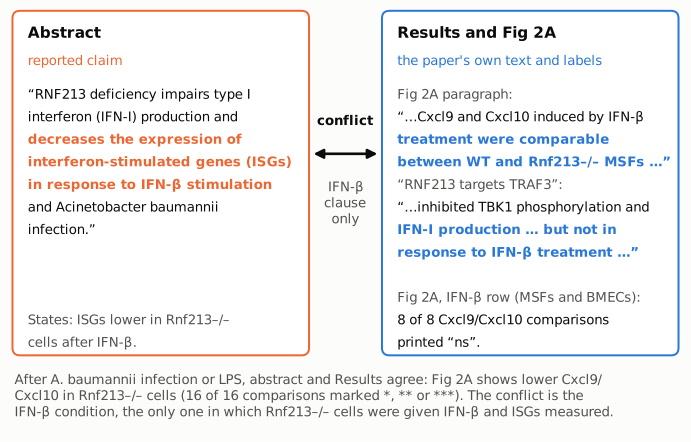
Figure 1. The conflicting statements, side by side. Left (orange): the abstract sentence, with the IFN-β ISG clause highlighted. Right (blue): the Fig 2A Results sentence, the first sentence of "RNF213 targets TRAF3" (which concerns TBK1 phosphorylation and IFN-I production and cites Figs 2D, 2E, S3C–D), and a count of the significance labels in the IFN-β row of Fig 2A. The abstract's ISG clause and the Fig 2A sentence describe the same experiment and disagree only on the IFN-β condition; on A. baumannii and LPS the abstract and Results agree.
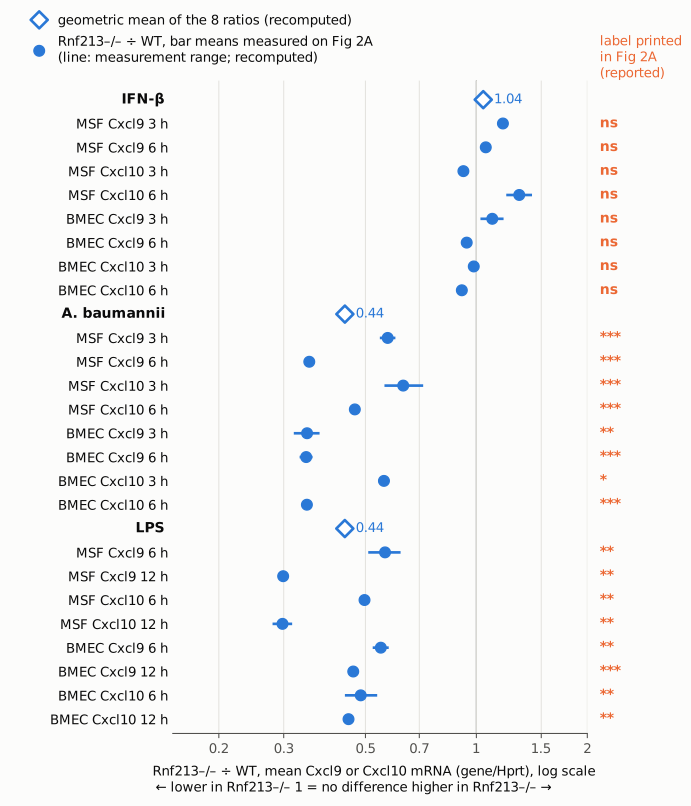
Figure 2. Size of the knockout effect for each stimulus in Fig 2A. Each filled blue dot is the ratio Rnf213–/– ÷ WT of mean Cxcl9 or Cxcl10 mRNA (gene/Hprt) for one cell type, gene and time point, from bar heights measured on the published Fig 2A; the short blue line is the range left by the measurement where replicate dots cover a bar top. Open blue diamonds are the per-stimulus geometric means. The orange label at right is the significance label printed in Fig 2A for that pair. The x-axis is logarithmic and the vertical line at 1 marks no difference. The 8 IFN-β ratios cluster around 1 (geometric mean 1.04) and all are "ns"; the 16 A. baumannii/LPS ratios sit between about 0.30 and 0.63 (geometric mean 0.44 for each stimulus) and all are *, ** or ***. The two clusters are far apart relative to the reading uncertainty.
Why it matters
- The abstract conflicts with the paper's own mechanistic inference. The body argues that RNF213 acts upstream of IFNAR, at TRAF3, precisely because knockout cells respond normally to exogenous IFN-β while producing less IFN-I after bacterial or LPS stimulation ("suggesting that RNF213 positively regulates IFN-I signaling by acting on targets upstream of IFNAR"). If RNF213 deficiency also reduced ISG induction by IFN-β, as the abstract states, RNF213 would be required downstream of the receptor, and this experiment would no longer support the upstream placement. A reader who sees only the abstract, as in indexing services, gets the mechanism wrong on this point.
- The main conclusions are unaffected and are in fact supported by the correct reading. RNF213 promotes K27-linked polyubiquitination of TRAF3 at K160, drives IFN-I production, and maintains blood–brain barrier integrity during A. baumannii infection. The title, author summary, figures, Results and Discussion all agree with the Results passages quoted above. The error is confined to one abstract sentence. The internal rescue experiment (Fig 4C), in which IFN-β restores Claudin-5/Occludin/Pecam1 expression in Rnf213–/– BMECs, likewise requires an intact IFN-β response and so agrees with the body, not the abstract.
- No numeric estimate is affected. The problem is a wrong statement of direction for one condition, not a miscalculated value.
Explanations considered
- "In response to IFN-β stimulation" modifies only "IFN-I production," not the ISG clause. This does not resolve the conflict. The paper never measures IFN-I production after IFN-β stimulation (the ELISA panels Fig 2B–C cover only A. baumannii and LPS), and IFN-β is itself a type I interferon, so "IFN-I production in response to IFN-β" is not a coherent separate readout. Under the parsing that attaches the phrase to ISG expression, it contradicts Fig 2A; under the other parsing, the Results already say IFN-I signaling is unaffected by IFN-β. Neither reading matches the body.
- The abstract refers to a different cell type or experiment. The only experiment in which Rnf213–/– cells are stimulated with IFN-β and ISGs are measured is Fig 2A, which covers both MSFs and BMECs; all 8 Cxcl9/Cxcl10 comparisons are "ns." Fig 1B–C uses IFN-β to induce Rnf213 in WT versus Ifnar–/– cells, a different genotype contrast. Fig 4C uses IFN-β pretreatment of BMECs, and the Results/Discussion describe the outcome as a rescue ("reversed by treatment with IFN-β" / "rescued by treatment with IFN-β"), which is the opposite of a reduced response. None of the eight supplementary figure legends reports IFN-β-stimulated ISG data in knockout versus WT cells.
- The Rnf213 transcript itself. In the IFN-β row of Fig 2A the Rnf213 panels are "***" because the gene is deleted in the knockout. Rnf213 is IFN-inducible (Fig 1B–C), but it is the targeted gene, not an ISG readout of the knockout's downstream signalling capacity, and neither the abstract nor the Results presents it as one.
- Low statistical power (absence of evidence). One could argue that "ns" with n = 4 technical replicates does not exclude a small decrease. But the abstract asserts a decrease, which "ns" does not support either way, and the point estimates show no tendency toward one: the geometric-mean ratio is 1.04 and the knockout is numerically higher in half the comparisons. With the same design the same figure detects 2- to 3-fold decreases under A. baumannii and LPS.
- Conversion or typesetting artifact. Ruled out. The same wording appears in the PMC-archived text, the Europe PMC full-text XML and the publisher's HTML version of record (labelled "Version 2").
- Already corrected or discussed. No correction, erratum, expression of concern or retraction was found (see Status).
None of these accounts for the conflict. The most plausible benign reading is that the abstract meant "LPS" where it wrote "IFN-β," since the Results support a decrease under LPS. That is a conjecture about wording and does not change the fact that the abstract as published contradicts the Results.
Status
As of 2026-10-23:
- Version of record: checked. The publisher's article page (journals.plos.org, reached through doi.org) offers "Version 2 / Version 1 / Uncorrected Proof." The current version carries all quoted passages verbatim: the abstract sentence, both Fig 2A Results sentences ("much lower" and "comparable"), the "but not in response to IFN-β treatment" sentence, and the Fig 4C "reversed by treatment with IFN-β" sentence. The same passages appear once each in the Europe PMC full-text XML.
- Figure data: Fig 2A has no numeric source data (Data Availability: all data are within the manuscript and its supporting files). The published Fig 2 image was measured for Fig 2 of this write-up, and the significance labels were transcribed from it. Every stimulated Cxcl9/Cxcl10 comparison was included.
- Supplements: the legends of all supporting items (S1–S8 Fig, S1–S2 Table) were read. None reports IFN-β-stimulated ISG data in Rnf213–/– versus WT cells. S3C–D, cited by the "RNF213 targets TRAF3" sentence, covers only untreated, A. baumannii and LPS conditions.
- Corrections and notices:
src/known.pyreturns only a publisher "New version" record dated 2025-07-11, which is PLOS's routine versioning (Uncorrected Proof → Version 1 → Version 2), not a correction. PubMed Central and Europe PMC list no notices. The publisher's page shows no correction, erratum, expression of concern or retraction. - Comments and PubPeer: the PLOS reader-comments page shows "Reader Comments (0)." PubPeer could not be queried directly (its search and API returned HTTP 403 / Cloudflare), and the one available web search for the title plus "pubpeer" could not run because the session's search budget was exhausted, so a PubPeer thread cannot be positively ruled out.
- Peer review: the open peer-review history published with the article was read (Europe PMC XML sub-articles r001–r004) along with the author response attachment. In Decision Letter 1, Reviewer #3 proposed the wording that became the "RNF213 targets TRAF3" sentence, including "but not in response to IFN-β treatment," and the authors adopted it. In the author response, the authors themselves wrote that "RNF213 deficiency did not affect the expression of ISGs during IFN-β stimulation (Fig 2)," which agrees with the Results and not the abstract. No review comment or author response addresses the abstract's IFN-β wording.
- Sources: PMC12251097 (
src/show.py);src/known.py 10.1371/journal.ppat.1013333; https://doi.org/10.1371/journal.ppat.1013333; the PLOS article, figure-image and reader-comments pages; https://www.ebi.ac.uk/europepmc/webservices/rest/PMC12251097/fullTextXML (including peer-review sub-articles and the author response supplementary file).
Suggested correction
Restrict the IFN-β clause in the abstract to what the data show. For example:
RNF213 deficiency impairs type I interferon (IFN-I) production and decreases the expression of interferon-stimulated genes (ISGs) in response to Acinetobacter baumannii infection and LPS stimulation, whereas ISG induction by IFN-β is unaffected.
Alternatively, delete "IFN-β stimulation and" from the sentence. Separately, the first sentence of "RNF213 targets TRAF3" states that TBK1 phosphorylation and IFN-I production were unaffected after IFN-β treatment, yet none of the panels it cites (Figs 2D, 2E, S3C, S3D) includes IFN-β-treated samples; Fig 2A holds only Cxcl9/Cxcl10/Rnf213 mRNA after IFN-β, not TBK1 or IFN-I readouts. That sentence could restrict its IFN-β clause to ISG induction and cite Fig 2A (for example, "…but did not affect Cxcl9 and Cxcl10 induction by IFN-β treatment (Fig 2A)"), or drop the IFN-β clause for the TBK1/IFN-I readouts, for which no IFN-β-treated samples are shown.