← Back to the plain-language case
Abstract reports two obesity-group odds ratios as the overweight and obesity estimates for EPT use
JAMA Netw Open (2025) · doi:10.1001/jamanetworkopen.2025.19236 · PMC12235495
Summary
The study pools 31 case-control studies to estimate associations between exogenous hormone use and intrinsic-like breast cancer subtypes, stratified by body mass index (BMI). The abstract says the associations of current estrogen-progestin therapy (EPT) use with luminal A–like and luminal B–ERBB2-like tumors "were attenuated but remained" for women with overweight (OR 1.40, 95% CI 1.02–1.92) or obesity (OR 1.68, 95% CI 1.01–2.78). In the paper's own Results text and in Supplement 1 eTable 3, both of these values come from the obesity stratum: 1.40 is the luminal A–like OR and 1.68 is the luminal B–ERBB2-like OR. The overweight estimates, 2.18 (1.83–2.61) for luminal A–like and 1.83 (1.32–2.55) for luminal B–ERBB2-like, do not appear in the abstract. No direction or significance changes, but an abstract reader would take the overweight luminal A–like excess odds to be about a third of what the paper's own data show, and would see a BMI pattern (1.40 for overweight, then 1.68 for obesity) that the full results do not show.
What the paper reports
Abstract, Results:
Current EPT users with healthy weight were more likely to be diagnosed with luminal A–like (odds ratio [OR], 2.51 [95% CI, 2.26-2.80]) or luminal B–ERBB2-like (OR, 1.95 [95% CI, 1.61-2.37]) subtypes. These associations were attenuated but remained for individuals with overweight (OR, 1.40 [95% CI, 1.02-1.92]) or obesity (OR, 1.68 [95% CI, 1.01-2.78]).
Results, "Combined EPT Use and Tumor Subtypes", paragraph 2:
In women with healthy weight, current EPT users were more likely to be diagnosed with luminal A–like (OR, 2.51 [95% CI, 2.26-2.80]), luminal B–like (OR, 1.47 [95% CI, 1.17-1.86]), or luminal B–ERBB2–like (OR, 1.95 [95% CI, 1.61-2.37]) breast tumors, with significant heterogeneity across subtypes (P < .001 for heterogeneity).
Results, "Combined EPT Use and Tumor Subtypes", paragraph 3:
In women with overweight, current EPT use was positively associated with luminal A–like (OR, 2.18 [95% CI, 1.83-2.61]) and luminal B–ERBB2-like (OR, 1.83 [95% CI, 1.32-2.55]) tumors but not with other subtypes (P < .001 for heterogeneity). In women with obesity, associations for luminal A–like (OR, 1.40 [95% CI, 1.02-1.92]) and luminal B–ERBB2-like (OR, 1.68 [95% CI, 1.01-2.78]) tumors were seen, with smaller effect sizes and nonsignificant heterogeneity (P < .11 for heterogeneity).
Methods, Statistical Analysis (the only BMI definition in the paper):
To evaluate heterogeneity in associations by BMI, associations were stratified by BMI categories as follows: lean or healthy weight (hereinafter, healthy weight) (18.5-<25 [calculated as weight in kilograms divided by height in meters squared]), overweight (25-<30), or obesity (≥30).
Supplement 1, eTable 3 (EPT use by intrinsic-like subtype, stratified by BMI), "Current use" rows: Lean/normal, luminal A-like 2.51 (2.26,2.80) and luminal B-ERBB2-like 1.95 (1.61,2.37). Overweight, 2.18 (1.83,2.61) and 1.83 (1.32,2.55). Obese, 1.40 (1.02,1.92) and 1.68 (1.01,2.78).
All quotes from the article were checked verbatim against the PMC-archived text with src/show.py PMC12235495 --grep. The eTable values were read from the supplement PDF.
What the paper's own numbers show
Method. I took every current-EPT odds ratio and 95% CI for luminal A–like and luminal B–ERBB2-like tumors from the Results text, and checked that each CI is symmetric about its OR on the log scale. I checked the text values against Supplement 1 eTable 3. I then matched each (OR, lower, upper) triple in the abstract against every BMI-by-subtype cell in the Results. To size the discrepancy, I compared the abstract's "overweight" value with the paper's overweight estimates as a ratio of ORs and as excess odds (OR − 1). I computed a z statistic for the difference of log ORs, using standard errors taken from the CI widths. That z treats the overweight and obesity strata as independent, which holds because they are disjoint groups of women. All calculations are in recompute.py.txt.
| Quantity | Location | Reported | Recomputed |
|---|---|---|---|
| Healthy weight, luminal A–like | Abstract; Results para. 2; eTable 3 | 2.51 (2.26–2.80) | Abstract and Results identical; geometric CI midpoint 2.516 |
| Healthy weight, luminal B–ERBB2-like | Abstract; Results para. 2; eTable 3 | 1.95 (1.61–2.37) | Abstract and Results identical; midpoint 1.953 |
| Overweight, luminal A–like | Results para. 3; eTable 3 | 2.18 (1.83–2.61) | Midpoint 2.185, consistent; not in the abstract |
| Overweight, luminal B–ERBB2-like | Results para. 3; eTable 3 | 1.83 (1.32–2.55) | Midpoint 1.835, consistent; not in the abstract |
| Obesity, luminal A–like | Results para. 3; eTable 3 | 1.40 (1.02–1.92) | Midpoint 1.399, consistent |
| Obesity, luminal B–ERBB2-like | Results para. 3; eTable 3 | 1.68 (1.01–2.78) | Midpoint 1.676, consistent |
| Abstract value labelled "overweight" | Abstract, Results | 1.40 (1.02–1.92) | Equals only the obesity, luminal A–like cell; matches no overweight cell |
| Abstract value labelled "obesity" | Abstract, Results | 1.68 (1.01–2.78) | Equals only the obesity, luminal B–ERBB2-like cell |
| Overweight luminal A–like vs abstract "overweight" | Results vs Abstract | 2.18 vs 1.40 | Ratio of ORs 1.56; excess odds 1.18 vs 0.40, so the abstract shows 34% of it; z = 2.39 for the difference |
| Overweight luminal B–ERBB2-like vs abstract "overweight" | Results vs Abstract | 1.83 vs 1.40 | Ratio of ORs 1.31; excess odds 0.83 vs 0.40 (48%); z = 1.15 |
| BMI gradient, luminal A–like | Results paras. 2–3 | 2.51 → 2.18 → 1.40 | Falls steadily with BMI |
| BMI gradient, luminal B–ERBB2-like | Results paras. 2–3 | 1.95 → 1.83 → 1.68 | Falls steadily with BMI |
| BMI gradient as the abstract presents it | Abstract | overweight 1.40, obesity 1.68 | Rises from overweight to obesity, which no subtype in the Results does |
| Significance, overweight and obesity cells | Results para. 3 | All four CIs exclude 1 | z (log OR / SE) = 8.60, 3.60, 2.09, 2.01; unchanged |
| Fully adjusted model (sensitivity) | eTable 7 | Overweight 2.18 (1.82–2.61), 1.81 (1.30–2.52); obese 1.41 (1.02–1.93), 1.65 (0.99–2.75) | No overweight cell equals 1.40 (1.02–1.92) |
Every value in the Results text agrees with eTable 3, and every CI is consistent with its point estimate. The other four current-EPT values in the abstract (2.51, 1.95 and 1.47 for healthy weight, 1.68 for obesity) match Results values for the BMI group they are given under. The only mismatch is the BMI label on the first of the two higher-BMI values.
Figure
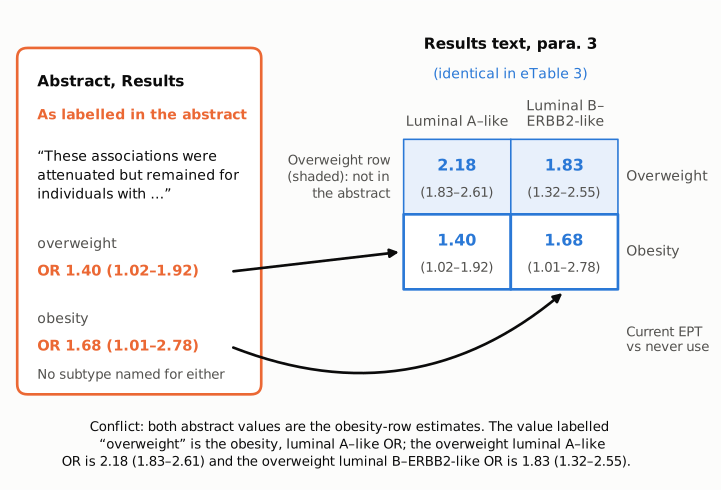
Figure 1. On the left (orange) is the abstract's sentence on attenuation, with the value attached to each BMI group as printed. On the right (blue) are the current-EPT odds ratios (95% CI) for women with overweight and obesity from Results paragraph 3, which are identical to the Supplement 1 eTable 3 "Current use" rows. Arrows link each abstract value to the only Results cell that has the same OR and CI. Both arrows end in the obesity row. The abstract's "overweight" value is the obesity, luminal A–like estimate. The shaded overweight row (2.18 and 1.83) is not reported anywhere in the abstract.
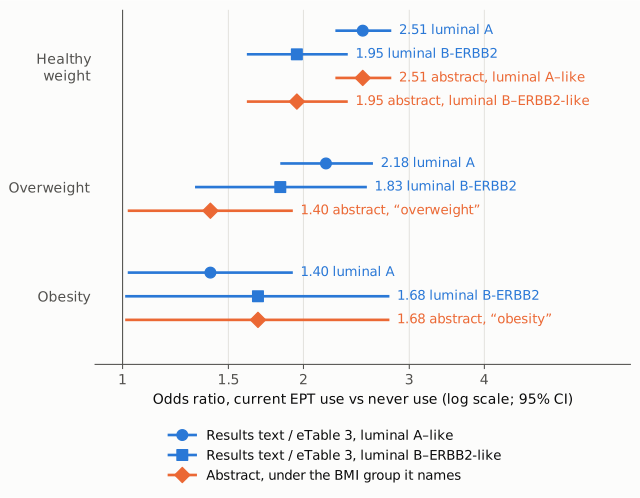
Figure 2. Odds ratios with 95% CIs for current EPT use vs never use, on a log axis with a thin reference line at OR = 1. Blue: values from the Results text and eTable 3 (circles, luminal A–like; squares, luminal B–ERBB2-like). Orange diamonds: the abstract's values, drawn under the BMI group the abstract names. In the healthy-weight and obesity groups each orange interval repeats a blue one. In the overweight group the abstract's interval (1.02–1.92) matches neither overweight estimate. It reproduces the obesity, luminal A–like interval one group lower. The blue luminal A–like estimates fall steadily from 2.51 to 2.18 to 1.40.
Why it matters
The BMI stratification is central to how the paper frames its EPT findings: the Key Points and Conclusions stress associations "particularly in participants with healthy weight", and the Discussion describes the luminal A–like and luminal B–ERBB2-like associations as "consistent across BMI groups, albeit attenuated with greater adiposity". The abstract is the only part of the paper that most readers, and most citing articles, see. A reader who relies on it would conclude that among women with overweight, current EPT use is associated with an OR of about 1.40. By the paper's own estimates the overweight luminal A–like OR is 2.18. That is roughly three times the excess odds (1.18 vs 0.40), and the difference is larger than sampling error alone would plausibly produce (z ≈ 2.4). The mislabeling also distorts the dose-response picture by BMI: the abstract's numbers rise from overweight (1.40) to obesity (1.68), while the full results fall steadily with BMI for both subtypes. Because neither value in the sentence is tied to a subtype, a reader also cannot tell that the two numbers refer to different tumor subtypes.
The consequences are limited. All four overweight and obesity estimates are above 1 with CIs that exclude 1, so the abstract's qualitative statement ("attenuated but remained") is true for both BMI groups. The title, Key Points, abstract Conclusions, body Results, Discussion, Figure 1 and the supplement are correct. The estrogen-only therapy and oral contraceptive findings, and the heterogeneity tests, are not affected. The error is a misreported secondary estimate in the abstract, not a change to any headline conclusion.
Explanations considered
- A different model, population or adjustment set in the abstract. The abstract and the Results both describe current EPT use vs nonuse in postmenopausal women, from the same polytomous logistic model stratified by BMI. No footnote, legend or Methods statement points to a different model for the abstract. The fully adjusted sensitivity model (eTable 7) gives overweight estimates of 2.18 and 1.81, not 1.40. This does not explain the numbers.
- A different BMI definition. The Methods and the abstract's own Design section use one set of cut points (overweight 25–<30, obesity ≥30), and eTable 3 uses the same. This does not explain the numbers.
- The value belongs to another overweight estimate. I checked whether 1.40 (1.02–1.92) is an overweight value for some other subtype or exposure. The overweight current-EPT estimates in the text are 2.18 and 1.83. The overweight past-EPT values mentioned in the Results are 1.50 and 1.57, both with different CIs. In the whole of Supplement 1, the exact triple 1.40 (1.02, 1.92) occurs once, in the Obese, current-use, luminal A-like cell of eTable 3. The four other ORs of 1.40 in the supplement all have different CIs. This does not explain the numbers.
- "Overweight or obesity" meant as one combined group. On this reading the two values would be the luminal A–like and luminal B–ERBB2-like ORs for women with higher BMI. The sentence's grammar does not support that reading: each value sits directly after a different BMI category, and no subtype is named. Even on this reading, both values come from the obesity stratum alone, and the overweight stratum, which has the larger estimates, is left out. This explanation reduces the problem to ambiguous wording, but the numbers would still be attributed to women with overweight when they come only from women with obesity.
- Rounding or transcription within the same cell. The abstract triples match the obesity cells to every printed digit and differ from the overweight cells by 0.78 and 0.43 on the OR scale. This is not a rounding effect.
- Text-conversion artifact in PMC. The same wording appears on the publisher's full-text page, on the PMC HTML page and in the Europe PMC full-text XML. This does not explain the numbers.
The pattern fits a mislabeled sentence in the abstract: the two obesity-row values were placed after "overweight" and "obesity" in place of an overweight value and an obesity value for the same subtype. Nothing in the paper shows how this happened.
Status
As of 2026-10-23:
- Version of record. doi.org resolves to the publisher's full-text page (jamanetwork.com/journals/jamanetworkopen/fullarticle/2836044), which was read in this workflow. Its abstract has the same "overweight (OR, 1.40 [95% CI, 1.02-1.92]) or obesity (OR, 1.68 [95% CI, 1.01-2.78])" wording. Its body Results give the same overweight (2.18, 1.83) and obesity (1.40, 1.68) values as PMC. The PMC page and the Europe PMC full-text XML carry identical text.
- Supplements. Supplement 1 (jamanetwopen-e2519236-s001.pdf: eMethods, eTables 1–29, eFigures 1–3) was downloaded via Europe PMC and read. eTable 3 agrees with the Results text in every cell used here. eTable 7, the fully adjusted model, gives similar values. Neither table has 1.40 (1.02–1.92) or 1.68 (1.01–2.78) in an overweight row. The supplement confirms the Results text and resolves which stratum the abstract values belong to.
- Corrections. None found.
src/known.pyreturned no Crossref updates and no PMC or Europe PMC notices. The Crossref works record has no update-to or updated-by relation. A Crossreffilter=updates:query returned 0 results. The Crossref Labs record, which carries the Retraction Watch data, lists no updates. Europe PMC (PMID 40622713) lists no comment or correction. The publisher page shows no correction notice. Earlier web searches in this workflow for the title together with "correction" or "erratum" found nothing relevant. - PubPeer. The PubPeer search API and search page both returned HTTP 403 and could not be queried directly. An earlier web search in this workflow for the DOI together with "PubPeer" found no thread. A repeat web search could not be run for this write-up because the session's search quota was exhausted.
Sources: publisher full text; PMC12235495; Europe PMC REST full-text XML and supplementary files for PMC12235495; Crossref REST API for doi:10.1001/jamanetworkopen.2025.19236.
Suggested correction
Abstract, Results. Replace "These associations were attenuated but remained for individuals with overweight (OR, 1.40 [95% CI, 1.02-1.92]) or obesity (OR, 1.68 [95% CI, 1.01-2.78])." with:
These associations were attenuated but remained for individuals with overweight (luminal A–like: OR, 2.18 [95% CI, 1.83-2.61]; luminal B–ERBB2-like: OR, 1.83 [95% CI, 1.32-2.55]) or obesity (luminal A–like: OR, 1.40 [95% CI, 1.02-1.92]; luminal B–ERBB2-like: OR, 1.68 [95% CI, 1.01-2.78]).
If word limits require a shorter sentence, the luminal A–like values alone (overweight 2.18 [1.83-2.61]; obesity 1.40 [1.02-1.92]) would give the BMI gradient correctly. All values are those already given in the Results text and in Supplement 1 eTable 3. No other part of the paper needs to change.