← Back to the plain-language case
All reported HPV prevalence confidence intervals are about 20 to 140 times narrower than the counts allow
BMC Med (2025) · doi:10.1186/s12916-025-04246-0 · PMC12211446
Summary
The Abstract, Results and Table 1 report a cervicovaginal HPV prevalence of 6.2% (51 of 822 women) with a 95% confidence interval of 6.18%–6.22%, and give intervals of ±0.01 to ±0.02 percentage points for every genotype-specific prevalence. From the paper's own counts, the exact binomial 95% interval for 51/822 is 4.65%–8.08%, 86 times as wide as the reported one, and the genotype intervals are 22 to 143 times as wide as reported; the point estimates themselves are correct. Four of the six reported intervals are reproduced to the printed decimal by one arithmetic step, a 95% half-width computed on the proportion scale (0.0165 for 51/822) added to a prevalence expressed in percent. Prevalence is the study's primary outcome, so its stated precision is overstated about 80-fold, which bears on the Discussion's comparison with 2009 estimates (the 2009 HPV16/18 value of 1.2% lies inside the corrected interval) and on any meta-analysis that uses the published interval.
What the paper reports
The prevalence of HPV infection was 6.2% (95% CI: 6.18%-6.22%), while the prevalence of high-risk genotypes 16 and 18 was 1.94% (95% CI: 1.93%-1.95%). The prevalence of 12 pooled high-risk HPV infection was 4.14% (95% CI:4.13%-4.15%).
Abstract, Results
The prevalence of cervicovaginal HPV infection among ever-married women of the 35-year-old age cohort was 6.2% (95% CI: 6.18%-6.22%), as 51, had tested positive for HPV infection out of 822 participants. The prevalence of high-risk carcinogenic HPV genotypes 16(n = 14) and 18(n = 2) was 1.94% (95% CI: 1.93%-1.95%), while the other 12 pooled high-risk HPV genotypes (n = 34) was 4.14% (95% CI: 4.13%-4.15%) (Table 1).
Results, paragraph 2
Table 1 ("Prevalence of cervico-vaginal HPV infection in the District") has a column headed "95% CI for the prevalence %". Its rows are: 12 pooled positive, 34, 4.14, 4.13-4.15; 16 positive, 14, 1.7, 1.69-1.71; 18 positive, 2, 0.24, 0.23-0.25; 16 & 12 pooled positive, 01, 0.12, 0.1-0.13; Negative, 771, 93.8; Total, 822.
On the design and analysis, the paper says:
In the district, there are 413 PHM areas.
Methods, paragraph 3 (each Public Health Midwife area is a cluster, and three women were selected from each)
the degree of accuracy desired specified was 0.016 (3.3/100 × 2). Therefore we needed 479 women.
Methods, paragraph 2 (the required sample size was then "multiplied by the design effect, which was taken as 1.1")
Data were entered by using SPSS version 20.
Methods, paragraph 8
Moreover, high-risk genotypes 16 and 18 prevalence were elevated from 1.2% to 1.94% within the same duration.
Discussion, paragraph 2
What the paper's own numbers show
Method. Each prevalence is a count out of n = 822. For each count I computed the 95% interval three ways: the Clopper–Pearson exact interval, the Wilson interval, and the Wald interval p ± 1.96·√(p(1−p)/n). I also computed the Wald interval with its variance inflated by the paper's stated design effect of 1.1. I then tested one candidate arithmetic route: take 1.96·SE on the proportion scale and add it, unconverted, to the prevalence in percent. All numbers come from recompute.py.txt.
The counts are internally consistent: 34 + 14 + 2 + 1 = 51 positives, 51 + 771 = 822, and 14 + 2 = 16 for HPV16 or 18. Every reported point estimate equals its count divided by 822 (for 16/822 = 1.946% the paper prints 1.94%, truncated rather than rounded, which does not matter here).
| Quantity | Location | Reported | Recomputed from the paper's counts |
|---|---|---|---|
| Any HPV, 51/822 | Abstract; Results p2 | 6.2% (95% CI 6.18–6.22) | 6.204%; exact 4.65–8.08; Wilson 4.75–8.07; Wald 4.56–7.85; Wald with design effect 1.1 4.47–7.93 |
| HPV16 or 18, 16/822 | Abstract; Results p2 | 1.94% (1.93–1.95) | 1.946%; exact 1.12–3.14; Wilson 1.20–3.14 |
| 12 pooled high-risk types, 34/822 | Abstract; Results p2; Table 1 | 4.14% (4.13–4.15) | 4.136%; exact 2.88–5.73; Wilson 2.97–5.72 |
| HPV16, 14/822 | Table 1 | 1.7% (1.69–1.71) | 1.703%; exact 0.93–2.84; Wilson 1.02–2.84 |
| HPV18, 2/822 | Table 1 | 0.24% (0.23–0.25) | 0.243%; exact 0.03–0.88; Wilson 0.07–0.88 |
| HPV16 & 12 pooled, 1/822 | Table 1 | 0.12% (0.1–0.13) | 0.122%; exact 0.00–0.68; Wilson 0.02–0.69 |
| Half-width of the overall interval | derived | 0.02 points | 1.65 points (Wald), 82 times the reported half-width; the exact interval is 86 times as wide as the reported one |
| How much too narrow, genotype rows (exact width ÷ reported width) | derived | — | HPV16 or 18: 101×; 12 pooled: 143×; HPV16: 95×; HPV18: 42×; HPV16 & 12 pooled: 22× |
| Sample size a ±0.02-point interval would need at 6.2% | derived | — | about 5.59 million |
| Population size at which a finite-population correction would give ±0.02 points | derived | — | 822.1, i.e. the sample itself |
| Percent prevalence ± 1.96·SE in proportion units, centred on the reported rounded prevalence | derived | 6.18–6.22; 1.93–1.95; 4.13–4.15; 1.69–1.71; 0.23–0.25; 0.1–0.13 | 6.18–6.22; 1.93–1.95; 4.13–4.15; 1.69–1.71 (all four exact matches); 0.24–0.24; 0.12–0.12 |
| Sample-size calculation | Methods p2 | 479; 915 | 1.96²·0.033·0.967/0.016² = 478.9; 479·1.1/(1−0.424) = 914.8 (consistent) |
| Planned precision vs achieved | Methods p2 (derived) | ±1.6 points (d = 0.016) at an assumed 3.3% | The 95% half-width at the observed 6.2% with n = 822 is 1.65 points, close to the planned ±1.6 points and about 80 times the reported 0.02 |
The paper's own sample-size calculation targeted a precision of ±1.6 percentage points (d = 0.016). The correct half-width at the observed prevalence, 1.65 points, is close to the planned ±1.6 points (the plan assumed 3.3% and n = 479, so the two need not coincide). The reported interval is roughly 80 times narrower than the precision the study was designed to achieve.
The arithmetic route above reproduces four of the six reported intervals exactly: 6.18–6.22, 1.93–1.95, 4.13–4.15 and 1.69–1.71. For the two smallest counts (2 and 1 positives), that route gives half-widths of 0.0034 and 0.0024 points. The paper reports 0.23–0.25 and 0.1–0.13, half-widths of 0.010 and 0.015 points, about 3 and 6 times what that route gives, so the route does not reproduce these two rows. They are still 42 and 22 times narrower than the exact intervals.
(An aside that does not affect the finding: the parenthetical "3.3/100 × 2" evaluates to 0.066, not 0.016. The stated 479 follows from d = 0.016, which is close to 3.3/100 ÷ 2 = 0.0165.)
Figure
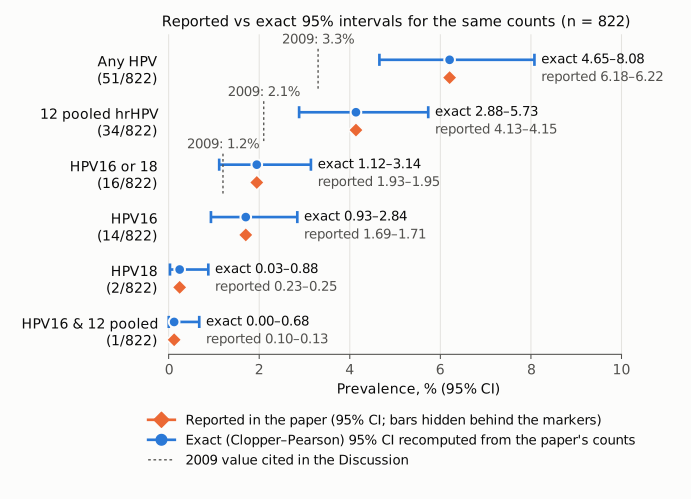
Figure 1. Each row is one prevalence reported in the Abstract, the Results or Table 1, with its count out of 822. Orange diamonds show the paper's reported estimate and 95% CI; every reported interval is narrower than its marker, so its bar is hidden. Blue circles with capped bars show the exact (Clopper–Pearson) 95% CI computed from the same count. The labels to the right give each interval, marked "exact" or "reported". The dashed gray lines mark the 2009 values that the Discussion compares against (3.3%, 2.1% and 1.2%). The 1.2% value for HPV16 or 18 lies inside the exact interval for this study. The axis starts at zero and is linear.
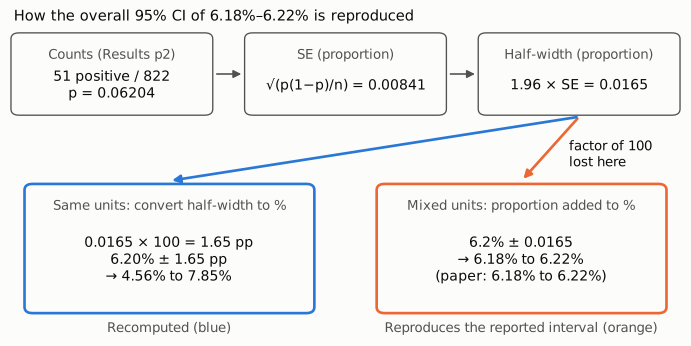
Figure 2. Arithmetic for the overall interval. Start from 51/822, compute the standard error and the 95% half-width (0.0165 on the proportion scale), then express the interval in percent. Multiplying the half-width by 100 gives 6.20% ± 1.65 points (blue, 4.56%–7.85% by the Wald method). Adding 0.0165 unconverted to the printed 6.2% gives 6.1835%–6.2165%, which rounds to 6.18%–6.22% (orange), the reported interval to the second decimal place. The same step reproduces the reported intervals for HPV16 or 18, the 12 pooled types and HPV16 (Table above).
Why it matters
- Primary outcome. The study's stated objective is to determine prevalence. Its headline interval tells readers the prevalence is known to within ±0.02 percentage points. The data support only about ±1.7 points (exact 4.65%–8.08%).
- Comparisons in the Discussion. The Discussion says HPV16/18 prevalence "were elevated from 1.2% to 1.94%" since 2009. With the reported interval (1.93–1.95%), 1.2% looks far outside the estimate. With the exact interval (1.12–3.14%), 1.2% lies inside it, and a two-sided exact binomial test of 16/822 against a fixed 1.2% gives p = 0.054. That test also ignores the 2009 study's own sampling error and the differences in district and age range. The comparisons for overall prevalence (3.3% vs 6.2%, p = 3.3 × 10⁻⁵ against a fixed 3.3%) and for the other high-risk types (2.1% vs 4.14%, p = 0.0003) still point the same way once corrected. Those tests too treat the 2009 values as known exactly.
- The same intervals in an earlier article. An article from the same survey (BMC Public Health 2021, doi:10.1186/s12889-021-10190-4, PMC7805031) prints the same overall interval, "6.2% (95%CI: 6.18–6.22%)", in its Abstract and Results, and the same genotype intervals in its Table 4 (4.13–4.15, 1.69–1.71, 0.23–0.25, 0.1–0.13). Crossref, PMC and Europe PMC list no correction for it either. A correction to one article would leave the other unchanged.
- Use by others. In an inverse-variance meta-analysis, the reported interval implies a variance about 82.5² ≈ 6,800 times too small (the Wald half-width is 82.5 times the reported one). A pooled estimate that used it would be dominated by this one study.
- What is not affected. The point estimates, the counts, and the odds ratios from the logistic regression do not depend on the prevalence intervals. The abstract's conclusions are about risk factors and stand as they are on this point.
Explanations considered
- A different, valid interval method (Wilson, exact, Wald). No. All three give half-widths of 1.6–1.7 points for 51/822, and none comes within an order of magnitude of ±0.02.
- Design effect or cluster adjustment. No. The Methods state a design effect of 1.1 for the cluster sample of 413 PHM areas. A design effect of 1 or more widens the interval: 4.47–7.93% with 1.1.
- Finite-population correction. No. To shrink the half-width to 0.02 points, the target population would have to be about 822.1 women, which is the sample itself. The Methods describe selecting three women per cluster from eligible-couple registers across the district, so the sample is not a census.
- Units: proportion instead of percent. Not as a labelling issue. The text, the Abstract and the Table 1 header all state the intervals in percent. If the limits were proportions, 6.18–6.22 would mean 618%–622%. The units issue that does fit is internal to the calculation: a half-width in proportion units (0.0165) added to a prevalence in percent (6.2). This reproduces four of the six reported intervals exactly (Figure 2).
- An interval for a different quantity (such as a mean or a weighted estimate). Nothing in the Methods describes one. The Statistical analysis paragraph names only prevalence estimation, bivariate analysis and logistic regression, and the table column is headed "95% CI for the prevalence %".
- Rounding or transcription. No. A rounding slip could not shrink six independently computed intervals by a factor of 20 to 140.
- Conversion artefact in the archived text. No. The same intervals appear in three places in both the PMC text and the publisher-supplied JATS XML on Europe PMC (Abstract, Results paragraph 2, Table 1), and the abstract intervals appear identically in the PubMed record. The dash character in the ranges differs between sources (the Europe PMC JATS writes the Results range with a minus sign, U+2212, where the Abstract and the PMC text use a hyphen), but the digits and decimal points are identical everywhere.
- Misaligned table cells. No. Each Table 1 row's prevalence equals its own count divided by 822, and each row's interval sits on its own prevalence.
Status
As of 2026-10-23:
- Version of record. The publisher's page (doi.org → bmcmedicine.biomedcentral.com → link.springer.com) redirected to a login, and both publisher PDF links returned HTML rather than a PDF, so the publisher's page could not be read directly. Three other sources built from the publisher's files were checked and agree on every interval they contain: the publisher-supplied JATS full text on Europe PMC, the PMC article, and the PubMed abstract (PMID 40598371).
- Supplements. Both supplementary files were opened: Annexure 1, the questionnaire, and Annexure 2, the specimen-collection guideline. Neither contains analysis output or a description of the interval method. The data are available only from the corresponding author on request.
- Corrections and comments. None found.
src/known.py(Crossrefupdate-to, PMC and Europe PMC notices) returns nothing for this article or for the 2021 BMC Public Health article that carries the same intervals, and the Europe PMC record for this article has no comment or correction list. The PubMed record has no CommentsCorrections entries (erratum, comment or retraction). Web searches for the DOI and title with "correction", "erratum" and "PubPeer" found no notice and no PubPeer thread (rechecked on 2026-10-23); the PubPeer API returned HTTP 403 when queried directly. - Sources. PMC12211446 via
src/show.py(Abstract, Methods paragraphs 2, 3 and 8, Results paragraph 2, Table 1, Discussion paragraph 2);src/known.py 10.1186/s12916-025-04246-0; NCBI E-utilities efetch for PMID 40598371 (abstract text and CommentsCorrections); Europe PMC fullTextXML for PMC7805031 (2021 article);recompute.py.txtin this folder.
Suggested correction
Replace the prevalence intervals with intervals computed from the counts. Exact (Clopper–Pearson) 95% CIs, which a design effect of 1.1 would widen slightly, are:
- Any HPV: 6.2% (95% CI 4.65%–8.08%)
- HPV16 or 18: 1.94% (1.12%–3.14%)
- 12 pooled high-risk types: 4.14% (2.88%–5.73%)
- HPV16: 1.70% (0.93%–2.84%)
- HPV18: 0.24% (0.03%–0.88%)
- HPV16 and 12 pooled: 0.12% (0.00%–0.68%)
Apply these in the Abstract, Results paragraph 2 and Table 1. If the authors prefer a design-based interval, the Wald interval with the stated design effect for the overall prevalence is 4.47%–7.93%. The Discussion's statement that HPV16/18 prevalence rose from 1.2% to 1.94% should note that 1.2% lies within the corrected interval for this study. The same intervals in the Abstract, Results and Table 4 of the 2021 BMC Public Health article from this survey (doi:10.1186/s12889-021-10190-4) would need the same correction.