← Back to the plain-language case
Abstract reports significant tDCS effects in three brain regions; the Results find significance in one
Proc Natl Acad Sci U S A (2025) · doi:10.1073/pnas.2416541122 · PMC12168024
Summary
The abstract states that significant neuromodulation of face-selective intracranial EEG activity was found in the anterior temporal lobe (ATL), the posterior temporal lobe (PTL) and the occipital lobe (OCC), with increases of "3% and 4%, 16% and 13%, and 36% and 33%". The paper's own Results, Fig. 4 legend and Discussion report significance in the PTL only. The ATL change (+3.8% during and +2.7% after stimulation, recomputed from the printed means) is described as "no significant amplitude change", and the OCC change as "a trend toward increase", which the Discussion attributes to too few contacts. The source data the paper deposited reproduce every printed mean and SEM, and with them no post hoc test reaches significance in the ATL (P ≥ 0.17). In the OCC, P lies between 0.022 and 0.23, depending on the test and on whether it is corrected for multiple comparisons. The pooled result, a significant increase across the right ventral occipito-temporal cortex (VOTC), is not affected. But the abstract tells readers that the effect reached all three regions, and the paper's own analysis shows it in one.
What the paper reports
Abstract:
Significant neuromodulations of face-selective iEEG activity in anterior & posterior temporal lobe and in the occipital lobe were found, with amplitude increases of 3% and 4%, 16% and 13%, and 36% and 33%, during and after tDCS, respectively.
Abstract, next sentence:
Interestingly, despite a unique tDCS session, the face-selective neuromodulation in the right visual occipito-temporal cortex remained significant (P = 0.015) after tDCS (P3 vs. P1).
Significance statement:
The neuromodulations were observed in the PTL.
Results, section "HD Electrodes Spatially Targeted Posterior Temporal Lobe (PTL).", paragraph on face-selective responses:
For face-selective responses, the baseline-corrected amplitudes for the iEEG contacts located in the ATL (n = 114) were 9.79 ± 1.20, 10.16 ± 1.23 (i.e., +4% with respect to P1) and 10.05 ± 1.22 µV (i.e., +3% with respect to P1), during the three phases P1, P2, and P3, respectively (no significant amplitude change). At the opposite, in the PTL (n = 51), the baseline corrected amplitudes were 21.43 ± 4.82, 24.83 ± 5.14 (i.e., +16% with respect to P1) and 24.15 ± 5.14 µV (i.e., +13% with respect to P1) during the three phases, respectively. The amplitude of the face-selective responses significantly varied from P1 to P2 i.e., during the tDCS (P = 0.003), as well as from P1 to P3 i.e., after the tDCS (P = 0.015) (Fig. 4B). In the OCC (n = 16), the baseline corrected amplitudes were 14.55 ± 3.56, 19.86 ± 5.41 (i.e., +36% with respect to P1), and 19.41 ± 5.24 µV (i.e., +33% with respect to P1) during the three phases, respectively. The variation of the amplitudes between P2 and P1 and between P3 and P1 showed a trend toward increase.
Results, section "TDCS Significantly Neuromodulates Face Selective Responses.", the pooled VOTC result:
For face-selective visual responses, the average baseline-corrected amplitudes recorded from 181 contacts during phases P1, P2, and P3 were 13.49 ± 1.62, 15.15 ± 1.77 (i.e., +12% with respect to P1), and 14.85 ± 1.76 µV (i.e., +10% with respect to P1), respectively. A significant baseline-corrected amplitude difference was found between P2 and P1 (P = 0.002) and between P3 and P1. (P = 0.003, Repeated measures ANOVA).
Fig. 4 legend:
A significant difference in the baseline-corrected amplitudes of the iEEG responses was observed in the PTL during the tDCS (P2) and maintained afterward (P3) in comparison to before tDCS (P1) (P = 0.003 & P = 0.015, respectively; repeated measure ANOVA).
Discussion, "Functional Targeting and Specific Neuromodulation.":
Brain structures in the PTL of the VOTC were significantly impacted by tDCS but the largest amplitude neuromodulation was observed in the OCC, where face-selective activity (“occipital face area”) is typically localized according to the literature (39–42) and where a high EF magnitude was observed. The lack of significance in the OCC during and after tDCS is likely due to insufficient statistical power, as there were fewer iEEG contacts in this region (clinical constraints) compared to the ATL and PTL.
Discussion, "Significant Neuromodulation Using Low-Intensity, -Duration, and -Resolution TDCS Configuration.":
The quantification of iEEG neuromodulation in terms of amplitude showed significant but moderate increases (from 10 to 36%) which could be related to these routine tDCS parameters set in the study.
Finally, the iEEG neuromodulation induced by tDCS in the posterior and OCC during our face-perception tasks could objectively explain the behavioral (27, 28) and scalp EEG (14, 15) changes and increases observed after tDCS in some studies.
Materials and Methods, the regional analysis:
Statistical comparisons were performed using repeated measure ANOVA tests with post hoc comparisons with the null hypothesis that intracranial neuromodulation will be the same in all ROI (Fig. 7).
What the paper's own numbers show
Method. I took the means printed in the Results and computed each percent change as 100 × (P2 or P3 mean / P1 mean − 1). P1 is before stimulation, P2 during and P3 after. The Data Availability statement cites deposited source data (ref. 55, Mendeley Data doi:10.17632/25z97kkndg.1). I downloaded two files from it and checked them against Mendeley's published SHA-256 hashes: per-contact baseline-corrected amplitudes for P1–P3 for all 302 face-selective contacts, and the region labels of the 181 VOTC contacts. One block of 8 contacts is labelled with one patient code in the localisation file and appears under the next patient code in the response file, with identical contact names. With that one match made, the counts are exactly ATL 114, PTL 51 and OCC 16, and every printed mean and SEM is reproduced. The paper does not say which post hoc test followed its repeated-measures ANOVA. So I computed four parametric versions, each for P2 vs P1 and P3 vs P1: paired t, paired t with Bonferroni correction for the three pairwise comparisons, a t test on the pooled ANOVA error (Fisher LSD), and Tukey HSD. A Wilcoxon signed-rank test is a non-parametric check. Every number below is printed by recompute.py.txt.
| Quantity | Location | Reported | Recomputed |
|---|---|---|---|
| Regions with significant face-selective change | Abstract | ATL, PTL and OCC | — |
| Regions with significant face-selective change | Results, Fig. 4 legend, Discussion | PTL only | PTL only (deposited data, all four parametric post hoc tests) |
| ATL change, during / after | Results | +4% / +3%, "no significant amplitude change" | +3.8% / +2.7% |
| ATL change, during / after | Abstract | "3% and 4%" | +3.8% / +2.7%: order reversed in the abstract |
| ATL post hoc P, during / after | Results | not given ("no significant") | uncorrected 0.167–0.325; corrected 0.350–0.889; Wilcoxon 0.375 / 0.664 |
| ATL omnibus repeated-measures ANOVA | — | — | F(2,226) = 1.02, P = 0.363 |
| PTL change, during / after | Results; Abstract | +16% / +13% | +15.9% / +12.7% |
| PTL post hoc P, during / after | Results; Fig. 4 legend | P = 0.003 / P = 0.015 | 0.0009–0.0177 / 0.0074–0.0331 (exact test unknown) |
| OCC change, during / after | Results; Abstract | +36% / +33%, "trend toward increase" | +36.5% / +33.4% |
| OCC post hoc P, during / after | Results; Discussion | not given ("lack of significance") | uncorrected 0.022–0.075; corrected 0.055–0.225; Wilcoxon 0.044 / 0.130 |
| OCC omnibus repeated-measures ANOVA | — | — | F(2,30) = 3.60, P = 0.040; Greenhouse–Geisser ε = 0.558, P = 0.072 |
| VOTC (all three ROIs) change, during / after | Results | +12% / +10%, P = 0.002 / P = 0.003 | +12.3% / +10.1%; post hoc P 0.00003–0.0015 / 0.0005–0.0031 |
| Right hemisphere, during / after | Results | +13% / +10%, P < 0.001 / P < 0.001 | +13.1% / +9.6% |
| ROI contacts | Results | ATL 114, PTL 51, OCC 16; VOTC 181 | 114 + 51 + 16 = 181 (the ROIs partition the VOTC) |
| P value "after" attached to the right VOTC | Abstract | P = 0.015 | Results give 0.003 for the VOTC; 0.015 is the PTL value |
| Range of "significant" increases | Discussion | "from 10 to 36%" | the largest significant regional increase is 15.9% (PTL); 36% is the non-significant OCC value |
All the printed percentages are correct rounding of the printed means. The problem is the significance attached to them in the abstract. Under every test I ran, the ATL is far from significance. The OCC is borderline: some uncorrected tests fall just below 0.05, but every multiplicity-corrected test, and the Greenhouse–Geisser-corrected omnibus test, does not. The paper itself classifies the OCC as not significant in the Results, the Fig. 4 legend and the Discussion. The PTL is significant under all four parametric post hoc tests.
Figure
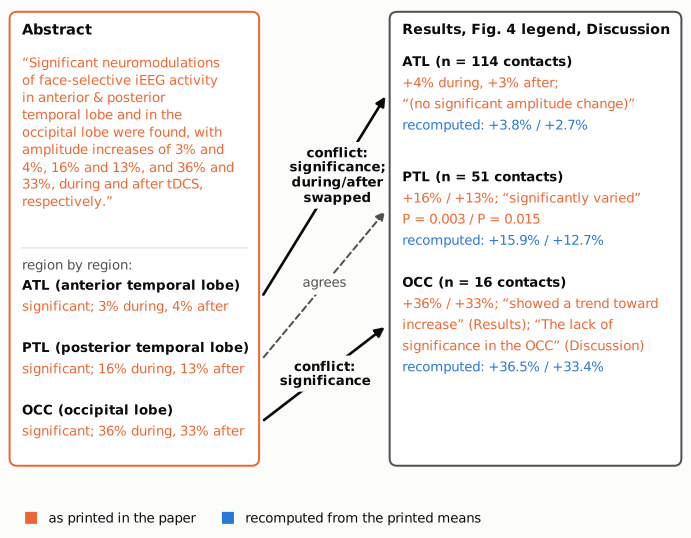
Figure 1. Left: the abstract sentence (orange outline), split by region. Right: what the Results, Fig. 4 legend and Discussion say about the same three regions. Text in orange is printed in the paper. Text in blue is the percent change recomputed from the printed means by recompute.py.txt. Solid connectors mark the two regions where the abstract's claim of significance conflicts with the body of the paper (for the ATL, the abstract also reverses the order of the during and after values). The dashed connector marks the one region where abstract and body agree.
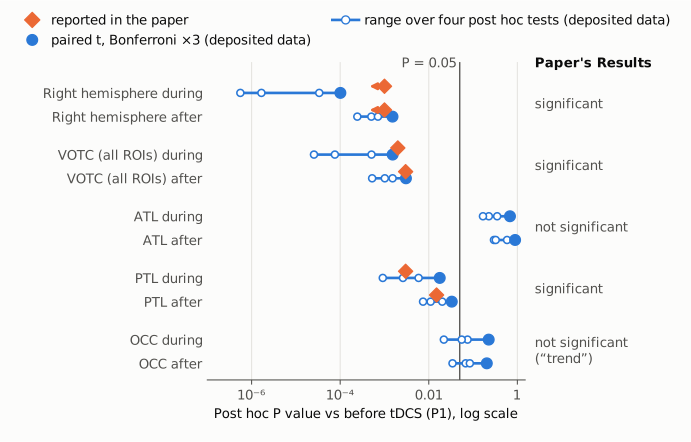
Figure 2. Post hoc P values against before stimulation (P1), on a log scale, for the during (P2) and after (P3) phases. Orange diamonds: P values printed in the paper. The right-hemisphere values are printed only as "P < 0.001" and are drawn at 0.001 with a leftward arrow. The paper prints no P value for the ATL or OCC. Blue: P values recomputed from the paper's deposited per-contact data by recompute.py.txt. The filled circle is a paired t test with Bonferroni correction for three comparisons, and the line with open circles spans four parametric post hoc tests (paired t, paired t with Bonferroni correction, pooled-error t, Tukey HSD). The vertical line marks P = 0.05. The right-hand column gives the paper's own classification in the Results. It agrees with the recomputed values and contradicts the abstract for the ATL and OCC.
Why it matters
- The abstract misstates where the effect was found. Where in the brain tDCS acts is the question of the regional analysis, and the paper's title, Significance statement and Results all present spatial targeting as a key result. The Results section heading is "HD Electrodes Spatially Targeted Posterior Temporal Lobe (PTL)". A reader of the abstract alone will conclude that significant effects were shown in all three ventral occipito-temporal regions, when the paper shows one: the PTL, the region under the anode.
- The effect sizes quoted in the abstract and Discussion are mostly not significant. The abstract's largest figures, 36% and 33% for the OCC, come from 16 contacts and are not significant by the paper's own analysis. The Discussion's "significant but moderate increases (from 10 to 36%)" also carries this 36% as its upper bound, when the largest significant regional increase is about 16% (PTL). Readers comparing tDCS effect sizes across studies could take the larger figure.
- Downstream interpretation leans on the occipital effect. The Discussion suggests that "the iEEG neuromodulation induced by tDCS in the posterior and OCC" could explain earlier behavioural and scalp EEG findings. On the paper's own statistics, that interpretation rests on an occipital effect that did not reach significance.
- The central finding holds. Pooled over the VOTC (181 contacts) and over the right hemisphere (302 contacts), the face-selective increase is significant in the paper and in the deposited data. The error lies in how the abstract reports the regional breakdown, not in the main result.
Explanations considered
- A different level of analysis. Not supported. The three regions together are exactly the VOTC set (114 + 51 + 16 = 181 contacts), and the VOTC as a whole was significant. So the abstract sentence might be a loose way of saying "significant in the VOTC, which spans ATL, PTL and OCC". But the sentence names each region and gives each one its own percentages. The next sentence gives the VOTC its own P value. The Significance statement says "The neuromodulations were observed in the PTL", and the Fig. 4 legend reports significance for the PTL only.
- A different test or correction. Not able to explain the ATL. The Methods describe repeated-measures ANOVA with post hoc comparisons and no other test. On the deposited data, the ATL omnibus ANOVA gives P = 0.36 and no post hoc variant gives P below 0.16. For the OCC, an uncorrected pooled-error t test (P = 0.022 / 0.034), an uncorrected Wilcoxon test during stimulation (P = 0.044) and the uncorrected omnibus ANOVA (P = 0.040) fall below 0.05. But the paper reports none of these, and it states "lack of significance in the OCC". The abstract therefore conflicts with the paper's own reported analysis, whatever might be argued for another one.
- A typesetting or conversion artifact. Not possible. The conflict is between words ("Significant" in the abstract, "no significant amplitude change" and "lack of significance" in the body), not between digits or signs. The publisher-deposited JATS full text on Europe PMC carries the same wording.
- A reversed during/after convention. This covers only the ATL order swap. The abstract gives the PTL and OCC values in the order during, after, which matches the Results. For the ATL it gives "3% and 4%", the reverse of the Results' +4% during and +3% after. It reads as an ordering slip, and the change is small either way.
- A correction already issued. None found (see Status).
Status
- Version of record. The publisher's site (pnas.org, reached through the DOI) returned HTTP 403 to automated requests for both the HTML and the PDF. I checked the publisher-deposited JATS full text on Europe PMC (PMC12168024) and the PMC article. The abstract, Results, Fig. 4 legend and Discussion wording quoted above is the same in both. In the Fig. 4B image supplied with the article, significance marks appear only on the PTL series. Every quotation above was checked verbatim against the PMC-archived text with
src/show.py. - Supplements. SI Appendix (
pnas.2416541122.sapp.pdf, 16 pages; Figs. S1–S4, Table S5): Fig. S3 shows regional SNR only, with the caption "No significant difference was found in any of the 3 regions in the VOTC for both types of responses", and gives no regional amplitude statistics. Deposited source data, Mendeley Data doi:10.17632/25z97kkndg.1 (4 .xlsx files, deposited 19 May 2025): the two face-selective files were downloaded, checked against Mendeley's SHA-256 hashes, and reanalysed as described above. - Corrections and comments. As of 2026-10-24 I found no correction, erratum, retraction or expression of concern.
src/known.pyreturns no Crossref update relations, no PMC notices and no Europe PMC notices. The Europe PMC record (PMID 40460123) lists no comments or corrections. PubPeer returned HTTP 403 to automated requests. A web search for the title together with "PubPeer" found no thread for this article. - Sources. PMC article PMC12168024; Europe PMC full-text XML and supplementary files for PMC12168024; SI Appendix
pnas.2416541122.sapp.pdf; Mendeley Data doi:10.17632/25z97kkndg.1; Crossref; Europe PMC; PubPeer; https://doi.org/10.1073/pnas.2416541122.
Suggested correction
In the abstract, replace
Significant neuromodulations of face-selective iEEG activity in anterior & posterior temporal lobe and in the occipital lobe were found, with amplitude increases of 3% and 4%, 16% and 13%, and 36% and 33%, during and after tDCS, respectively.
with wording that keeps the significance claim to the PTL, for example
Significant neuromodulation of face-selective iEEG activity was found in the posterior temporal lobe, with amplitude increases of 16% and 13% during and after tDCS, respectively; nonsignificant changes of 4% and 3% were observed in the anterior temporal lobe and of 36% and 33% in the occipital lobe.
The authors may also wish to check the P value in the next abstract sentence: P = 0.015 is the PTL value, while the Results give P = 0.003 for the right VOTC after tDCS. In the Discussion, the range "from 10 to 36%" could be limited to significant effects (about 10 to 16%), and the sentence on "the posterior and OCC" could note that the occipital change was not significant. Naming the post hoc test, and any correction for multiple comparisons, would let readers reproduce the reported P values.