← Back to the plain-language case
Abstract reports all-grade adverse event rates as grade ≥3 treatment-related rates in a phase I trial
Clin Cancer Res (2025) · doi:10.1158/1078-0432.CCR-24-1983 · PMC12163594
Summary
The Abstract of this first-in-human phase I trial of intratumoral SAR441000, given alone or with cemiplimab, states that the most common grade ≥3 treatment-related adverse events (TRAEs) were fatigue in escalation (28.6% with monotherapy, 66.7% with the combination) and injection-site pain in expansion (31.7%). All three percentages equal the all-grade, all-causality treatment-emergent AE (TEAE) rates in Table 2B (6/21, 10/15 and 13/41). In the same table, grade ≥3 fatigue is 0/21 and 0/15, and grade ≥3 injection-site pain is 1/41 (2.4%). The paper's own Table 2A and Results text add that no monotherapy patient had a grade ≥3 TRAE of any kind and that only 1 of 15 escalation-combination patients did. Safety was a primary objective, and this sentence is the Abstract's only quantitative safety result. As printed, it overstates severe treatment-related toxicity by about 10-fold or more.
What the paper reports
The most common grade ≥3 treatment–related adverse events was fatigue in the escalation phase (monotherapy: 28.6% and combination therapy: 66.7%) and injection-site pain (31.7%) in the expansion phase.
— Abstract, Results
Of the 21 patients, 19 (90.5%) experienced any-grade AEs, of which the most common were vomiting and fatigue in 6 (28.6%) patients each, followed by hypertension, chills, and pain in extremities in 4 (19.0%) patients each. Nine (42.9%) patients experienced grade ≥3 AEs (Table 2). Furthermore, 13 (61.9%) patients reported TRAEs, but none were grade ≥3 or considered serious; grade ≥5 AEs were not reported.
— Results, Safety, "Escalation monotherapy"
All 15 patients experienced any-grade AEs, with the most common being fatigue (10/15; 66.7%), followed by hypertension and nausea in 5 (33.3%) patients each. Grade ≥3 AEs—hypertension, pyrexia, and anemia—were experienced by one (6.7%) patient each (Table 2). Ten (66.7%) patients experienced any-grade TRAEs, with the most common being fatigue (n = 7; 46.7%). One (6.7%) patient experienced grade ≥3 syncope (Supplementary Table S5).
— Results, Safety, "Escalation combination therapy"
All 41 patients experienced any-grade AEs, of which injection-site pain (n = 13; 31.7%) was the most common all-grade AE, followed by diarrhea, decreased appetite, and asthenia (n = 11 each; 26.8%; Table 2). [...] Thirty-three (80.5%) patients had any-grade TRAEs, of which six (14.6%) patients had TRAEs of grade ≥3 that were diarrhea, injection-site pain, and fatigue (Supplementary Table S5).
— Results, Safety, "Expansion combination"
Patients with any TRAE of grade ≥3 | 0 | 1 (6.7) | 6 (14.6)
— Table 2A ("AEs: (A) summary and (B) TEAEs occurring in ≥15% of patients"). The columns are escalation monotherapy (N = 21), escalation combination (N = 15) and expansion combination (N = 41).
Fatigue | 6 (28.6) | 0 | 10 (66.7) | 0 | 9 (22.0) | 1 (2.4)
Injection-site pain | 0 | 0 | 0 | 0 | 13 (31.7) | 1 (2.4)
— Table 2B, same three cohorts. Each cohort has an "All grades" column followed by a "Grade ≥3" column. The table footer defines the rows as TEAEs.
Intratumoral administration of SAR441000 in combination with cemiplimab was generally well tolerated with antitumor activity in the locoregional disease setting.
— Abstract, Conclusions
What the paper's own numbers show
Method. Each incidence is 100 × (patients with the event) / (patients in the cohort), with the cohort sizes from the Abstract and Table 2 (21, 15, 41). For each of the Abstract's three figures, the script tries every incidence the paper reports for the same AE and cohort: all-grade and grade ≥3 rates, all-causality TEAEs (Table 2B) and treatment-related AEs (Supplementary Table S5). It also checks the figure against the cohort's ceiling for grade ≥3 TRAEs of any kind (Table 2A). Every number below is printed by recompute.py.txt.
| Quantity | Location | Reported | Recomputed from the paper's numbers |
|---|---|---|---|
| Fatigue, escalation monotherapy, labelled "grade ≥3 treatment-related" | Abstract | 28.6% | equals all-grade TEAE 6/21 = 28.6% (Table 2B) |
| Grade ≥3 fatigue, escalation monotherapy | Table 2B; Suppl. Table S5 | 0; 0 | 0/21 = 0.0% (all causes and treatment-related) |
| Any grade ≥3 TRAE, escalation monotherapy | Table 2A; Results | 0; "none were grade ≥3" | 0/21 = 0.0%. Grade ≥3 TR fatigue of 28.6% would need 6.0 patients |
| Fatigue, escalation combination, labelled "grade ≥3 treatment-related" | Abstract | 66.7% | equals all-grade TEAE 10/15 = 66.7% (Table 2B) |
| Grade ≥3 fatigue, escalation combination | Table 2B; Suppl. Table S5 | 0; 0 | 0/15 = 0.0% |
| Any grade ≥3 TRAE, escalation combination | Table 2A; Results | 1 (6.7%) | 1/15 = 6.7%. Grade ≥3 TR fatigue of 66.7% would need 10.0 patients |
| Treatment-related fatigue, any grade, escalation combination | Results; Suppl. Table S5 | n = 7; 46.7% | 7/15 = 46.7%, so 66.7% is not a TRAE rate at any grade |
| Injection-site pain, expansion, labelled "grade ≥3 treatment-related" | Abstract | 31.7% | equals all-grade TEAE 13/41 = 31.7% (Table 2B) |
| Grade ≥3 injection-site pain, expansion | Table 2B; Suppl. Table S5 | 1 (2.4); 1 (2.4) | 1/41 = 2.4%; the Abstract's figure is 13.0 times this |
| Treatment-related injection-site pain, any grade, expansion | Suppl. Table S5 | 11 (26.8) | 11/41 = 26.8% |
| Any grade ≥3 TRAE, expansion | Table 2A; Results | 6 (14.6%) | 6/41 = 14.6% |
| Largest number of patients with any single grade ≥3 TRAE term, expansion | Suppl. Table S5 | 7 terms with 1 (2.4) each | 1/41 = 2.4%; no term is more common than any other |
| Ratio of Abstract figure to the cohort's any-grade ≥3 TRAE rate | derived | — | monotherapy: 28.6% vs 0% (no finite ratio); combination: 66.7 / 6.7 = 10.0; expansion: 31.7 / 14.6 = 2.2 |
All three Abstract figures match the all-grade, all-causality TEAE rate exactly. None matches any grade ≥3 rate or any treatment-related rate the paper reports. In the two escalation cohorts the stated figures cannot be grade ≥3 TRAE rates at all. Even if every patient with a grade ≥3 TRAE of any kind had had grade ≥3 fatigue, the maximum would be 0/21 and 1/15.
Figure
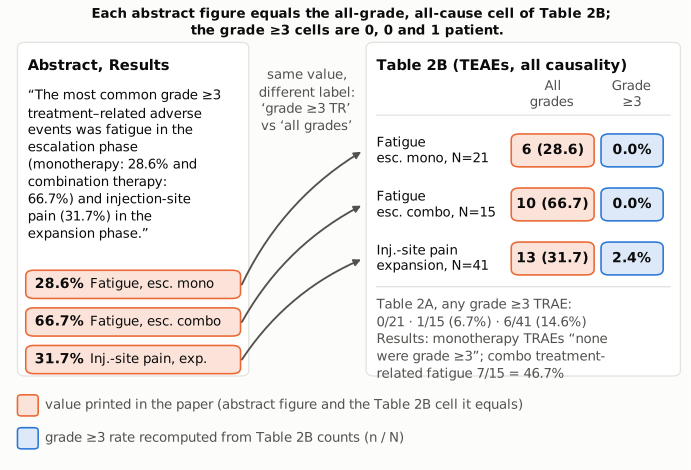
Figure 1. The left panel shows the Abstract sentence and its three percentages (orange). Each arrow joins a percentage to the Table 2B row it reproduces exactly. In all three rows the match is the "All grades" cell (orange), the count of patients with the event at any grade and from any cause. The blue cells show the grade ≥3 rate recomputed from the adjacent "Grade ≥3" count in the same row: 0/21, 0/15 and 1/41. Underneath, the right panel gives the cohort-level ceiling from Table 2A (any grade ≥3 TRAE: 0/21, 1/15, 6/41) and the Results text on monotherapy and on treatment-related fatigue. Only patient counts and percentages printed in the paper, or computed from them by recompute.py.txt, are shown.
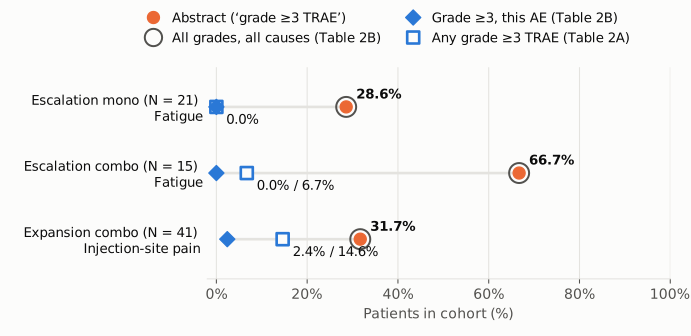
Figure 2. The same comparison on one axis (percent of patients in each cohort, 0–100%). Orange dots are the Abstract's figures. Each sits inside an open ring marking the all-grade, all-causality rate from Table 2B. Blue diamonds are the grade ≥3 rates of the same AE (Table 2B), and open blue squares are the cohort's rate of grade ≥3 TRAEs of any kind (Table 2A). That second rate is an upper bound for any single grade ≥3 TRAE. In escalation monotherapy the diamond and the square coincide at 0%. In each cohort the Abstract's figure lies well above that upper bound.
Why it matters
Overall safety and tolerability are part of the trial's primary objective. The Abstract sentence quoted above is its only quantitative statement on safety. A reader of the Abstract alone would conclude that two-thirds of patients in escalation combination had severe treatment-related fatigue, and that nearly a third of expansion patients had severe treatment-related injection-site pain. The paper's tables say neither happened: no escalation patient had grade ≥3 fatigue, and 1 of 41 expansion patients had grade ≥3 injection-site pain. The sentence also misidentifies the "most common" grade ≥3 TRAE. Monotherapy had none. In escalation combination, the one patient with a grade ≥3 TRAE is described as having syncope. In expansion, Supplementary Table S5 lists seven grade ≥3 TRAE terms with one patient each, so no single term stands out.
The error runs against the paper's own conclusion. As printed, the Abstract's figures sit uneasily with "generally well tolerated"; the correct figures (grade ≥3 TRAEs of any kind in 0%, 6.7% and 14.6% of patients) support it. Abstract-level safety figures from first-in-human trials are often carried into reviews, meta-analyses of intratumoral immunotherapies and dose-selection discussions. A 10-fold or larger overstatement of severe toxicity could be passed on in those places.
The error does not affect the maximum administered dose (4,000 µg), the response counts, the pharmacokinetic and pharmacodynamic results, or the Discussion. The Discussion describes AE frequencies without the mislabelled percentages. It ends: "SAR441000 demonstrated a generally acceptable safety profile in both monotherapy and combination therapy cohorts, although a higher number of high-grade AEs were observed in the combination therapy cohort."
Explanations considered
- A different population or denominator. This does not account for the numbers. The Abstract gives the same cohort sizes (N = 21, 15, 41) as Table 2. The ratios 6/21, 10/15 and 13/41 reproduce 28.6%, 66.7% and 31.7% exactly.
- A treatment-related table rather than Table 2B. This does not account for the numbers. Supplementary Table S5 ("Treatment-related adverse events") gives fatigue as 2 (9.5) and 7 (46.7) at all grades and 0 at grade ≥3 in the two escalation cohorts. It gives injection-site pain in expansion as 11 (26.8) at all grades and 1 (2.4) at grade ≥3. None of these is 28.6%, 66.7% or 31.7%.
- A grade ≥3 rate that includes events not attributed to treatment. This does not account for the numbers. Grade ≥3 fatigue from any cause is also 0/21 and 0/15 (Table 2B), and grade ≥3 injection-site pain from any cause is 1/41.
- Patients counted once per event, or events rather than patients. This does not account for the numbers. Ten grade ≥3 fatigue events in escalation combination would still need grade ≥3 fatigue to appear in Table 2B or Supplementary Table S5, and both show 0. The cohort had only one patient with any grade ≥3 TRAE.
- A different time window or study phase. This does not account for the numbers. The Abstract sentence, Table 2 and the Results subsections all refer to the escalation and expansion phases over the treatment-emergent period. The table footnotes (timing of grade 5 events, definition of discontinuation) do not apply to these rows.
- A conversion or typesetting artefact in the archived copy. This was ruled out. The PMC HTML, the Europe PMC full-text XML and the PubMed abstract (PMID 40152791) give the same Abstract sentence. Table 2B lines up with its "All grades | Grade ≥3" header in each source checked. The numbers contain no signs or superscripts that could have been misread.
- The Abstract meant "all-grade" or "TEAE" and the qualifier is a wording slip. This is the most likely description of what went wrong, but it is not an innocent reading of the sentence as printed. "Grade ≥3 treatment-related" changes both the severity and the attribution of the event, and the figures are wrong under that label.
A smaller inconsistency sits in the paper's supporting material. The Results text names the single grade ≥3 TRAE in escalation combination as syncope, citing Supplementary Table S5. That table lists syncope as 1 (6.7) at all grades and 0 at grade ≥3, and lists dizziness and peripheral neuropathy as 1 (6.7) each at grade ≥3. This does not change the main finding: Table 2A gives one patient with any grade ≥3 TRAE in that cohort either way.
Status
As of 2026-10-23:
- Version of record: checked indirectly. The publisher's article page and the PDF link listed by Crossref (aacrjournals.org, /clincancerres/article/31/12/2358/762781/) returned HTTP 403 to automated requests. The PMC article page, the Europe PMC full-text XML and the PubMed record (PMID 40152791, built from the publisher's metadata) all give the Abstract sentence and the Table 2 rows word for word as quoted above.
- Supplement: checked. The Europe PMC supplementary package (Supplementary Figures S1–S4, Supplementary Tables S1–S9, Annexure 1) was downloaded. Supplementary Table S5 (treatment-related AEs, all grades and grade ≥3 by cohort) is cited above. It confirms grade ≥3 treatment-related fatigue of 0/21 and 0/15, and grade ≥3 treatment-related injection-site pain of 1/41. It does not resolve the discrepancy.
- Corrections: none found.
src/known.pyreturned no Crossref updates, PMC notices or Europe PMC notices. The Crossref record has no update-to or updated-by entries. The Europe PMC record has no comment or correction links. A web search for errata or comments on the article found none. - PubPeer: not reachable by automated query. The API returned "Human verification required" (HTTP 403). A web search found no PubPeer thread. A manual search at pubpeer.com is still advisable.
Sources: doi.org/10.1158/1078-0432.CCR-24-1983 · PMC12163594 · Europe PMC record · Europe PMC supplementary files · Crossref works record · ClinicalTrials.gov NCT03871348
Suggested correction
The Abstract sentence could be replaced with figures that match Table 2 and Supplementary Table S5. One option:
Grade ≥3 treatment-related adverse events occurred in 0 of 21 (0%), 1 of 15 (6.7%) and 6 of 41 (14.6%) patients in escalation monotherapy, escalation combination and expansion combination, respectively. The most common any-grade adverse events were fatigue in escalation (monotherapy: 28.6%; combination: 66.7%) and injection-site pain (31.7%) in expansion.
The authors could also check which preferred term was recorded for the single grade ≥3 TRAE in escalation combination. The Results text names syncope, while Supplementary Table S5 lists dizziness and peripheral neuropathy.