← Back to the plain-language case
Results report two incompatible sets of Fig. 3A means, including PD putamen 0.243 versus 0.143
Sci Adv (2025) · doi:10.1126/sciadv.ads3051 · PMC12143374
Summary
The first Results subsection reports the mitochondrial DJ-1–β-subunit PLA signal (Manders' coefficient, mean ± SEM) for six nigrostriatal cells: control and PD, each in SNpc somata, SNpc proximal neurites and putamen (Put) distal neurites. It reports them twice. Both passages cite Fig. 3A, and the two sets disagree in every cell. For PD putamen, the cell behind the paper's emphasis on a reduction "particularly in distal neurites", the values are 0.243 ± 0.030 (n = 18) and 0.143 ± 0.034 (n = 17). Fig. 3A itself plots 18 PD putamen points with a mean of 0.241 ± 0.030, and its six mean bars match the first set to within 0.004. The second set, which is the one the text uses to describe the within-pathway pattern and a "significantly higher" proximal-versus-somata signal in PD, does not match the plotted data. A third paragraph, introduced as comparing SNpc and VTA and citing Fig. 3B, repeats the first set's SNpc/Put numbers verbatim, and its stated ordering does not match them.
What the paper reports
All passages are from the Results subsection "DJ-1-β-sub association is reduced in SNpc DA neurons of patients with PD". Paragraphs are counted from the start of that subsection, so ¶1 begins "Loss of function mutations", ¶2 "To examine the association" and ¶3 "We found that".
Paragraph 3 (begins "We found that"):
The DA axons in the Put also showed decreased DJ-1-β-sub association in brains of patients with PD compared to control cases (PD: somata M = 0.357 ± 0.025 R, n = 20; proximal neurites M = 0.408 ± 0.028 R, n = 20; Put M = 0.243 ± 0.030 R, n = 18; control: somata M = 0.420 ± 0.032 R, n = 20; proximal neurites M = 0.538 ± 0.028 R, n = 20; Put M = 0.377 ± 0.032 R, n = 19) (Fig. 3A).
Paragraph 4 (begins "The intracellular heterogeneity"):
To determine whether the subcellular distribution of DJ-1-β-sub association levels within SNpc and VTA neurons aligns with or deviates from their expected energetic demand and expenditure, we compared the DJ-1-β-sub PLA signal levels within the SNpc and VTA DA neurons across the three subcellular regions. We observed the highest PLA signal within the mitochondria of the proximal neurites (M = 0.538 ± 0.028, n = 20), followed by distal neurites (M = 0.377 ± 0.032, n = 19) and somata (M = 0.420 ± 0.032, n = 20). A similar trend appeared in PD cases, where proximal neurites showed the highest signal (M = 0.408 ± 0.028, n = 20), followed by distal neurites (M = 0.243 ± 0.030, n = 18) and somata (M = 0.357 ± 0.025, n = 20), suggesting a correlation with subcellular metabolic demand (Fig. 3B).
Paragraph 5 (begins "In control SNpc neurons"):
In control SNpc neurons, the PLA signal does not follow the same trend observed in VTA neurons. While the PLA signal is notably higher in the proximal neurites (M = 0.490 ± 0.040 R, n = 20) compared to the somata (M = 0.351 ± 0.038 R, n = 20), it declines in the distal axons in the Put (M = 0.332 ± 0.047 R, n = 19) (Fig. 3A). In PD cases, this pattern is retained, with proximal neurites (M = 0.404 ± 0.046 R, n = 20) showing significantly higher PLA signal than the somata (M = 0.299 ± 0.032 R, n = 20), while the distal axons in the Put exhibit the lowest levels of DJ-1-β-sub association (M = 0.143 ± 0.034 R, n = 17).
The trends observed in both control and PD cases indicate a mismatch in metabolic compensation along the nigrostriatal pathway, potentially contributing to the selective vulnerability of SNpc neurons in PD.
Fig. 3 legend:
(C and D) The data in (A) and (B) are rearranged to allow for the comparison of PLA signal within the subcellular compartments (somata, proximal neurites, and distal neurites) of mesolimbic and nigrostriatal pathways in control (C) and PD (D) cases. Each data point represents the mean of three confocal images per section (one section from each region per case).
To maintain consistency across striatal and midbrain sections, the 40 sections were processed in two independent batches of 20 sections, the maximum feasible per experimental run. Comparable trends and statistical significance were observed across both datasets. The figure presents combined data from all sections. Statistical analysis: two-way ANOVA with Tukey’s post hoc test.
Methods, "Statistical analyses":
The data were analyzed using GraphPad Prism and are presented as the means ± SEM.
Where the finding is stated in summary form. Abstract:
In PD brains, DJ-1-β-sub-PLA was lower than control in substantia nigra pars compacta (SNpc) somata and neurites but unchanged in ventral tegmental area (VTA) neurons.
Introduction, last paragraph:
Here, we show a reduction in DJ-1-β-sub association in the SNpc of brains of patients with PD, particularly in distal neurites in the dorsal striatum, while in the VTA, this association is unchanged between control and PD brains.
Discussion, first paragraph:
Here, we demonstrate that DJ-1-β-sub association is selectively reduced in the subcellular compartments of SNpc of brains of patients with PD, particularly in distal neurites in the Put, while remaining unchanged in the VTA. In control brains, VTA neurons exhibit a gradient of DJ-1-β-sub association that increases from somata to proximal and distal neurites, whereas SNpc neurons lack this gradient.
What the paper's own numbers show
Method. I tabulated the six SNpc/Put summaries (mean, SEM, n) from paragraphs 3, 4 and 5 and compared them cell by cell. I converted each SEM to the SD it implies (SEM × √n) and tested whether the n = 17 summary could be the n = 18 summary with one case dropped, using the fact that a Manders' coefficient lies between 0 and 1. I then read Fig. 3A from the published image (sciadv.ads3051-f3.jpg, Europe PMC supplementary bundle). I calibrated the y-axis on the 1.0, 0.5 and 0.0 tick labels (the 0.5 tick reads back as 0.498) and located each horizontal mean bar. In the PD putamen column all points are separable, so I also located each point and recomputed its mean and SEM. In the other five columns some points are hidden behind the mean and SEM bars, so only their spread is used, and only as a secondary check. Every number below is printed by recompute.py.txt, which fetches the figure image itself.
| Quantity | Location | Reported | Recomputed from the paper's own numbers |
|---|---|---|---|
| PD, Put distal neurites | ¶3 and ¶4 vs ¶5 | 0.243 ± 0.030, n = 18 vs 0.143 ± 0.034, n = 17 | difference 0.100 (z = 2.21 if the two were independent estimates); Fig. 3A mean bar 0.244; 18 plotted points, mean 0.241, SD 0.128, SEM 0.030 |
| PD, SNpc somata | ¶3 vs ¶5 | 0.357 ± 0.025 vs 0.299 ± 0.032 (both n = 20) | Fig. 3A bar 0.354 |
| PD, SNpc proximal | ¶3 vs ¶5 | 0.408 ± 0.028 vs 0.404 ± 0.046 (both n = 20) | Fig. 3A bar 0.409 (means near-equal; SEMs differ, implied SD 0.125 vs 0.206) |
| Control, SNpc somata | ¶3 vs ¶5 | 0.420 ± 0.032 vs 0.351 ± 0.038 (both n = 20) | Fig. 3A bar 0.416 |
| Control, SNpc proximal | ¶3 vs ¶5 | 0.538 ± 0.028 vs 0.490 ± 0.040 (both n = 20) | Fig. 3A bar 0.540 |
| Control, Put distal | ¶3 vs ¶5 | 0.377 ± 0.032 vs 0.332 ± 0.047 (both n = 19) | Fig. 3A bar 0.375 |
| Pattern of the ¶5 discrepancies | ¶3 vs ¶5 | — | ¶5 mean lower in all 6 cells, by 0.004 to 0.100 (ratios 0.588 to 0.990: no common offset or factor); ¶5 SEM larger in all 6 cells |
| One case dropped from the n = 18 set? | ¶3 vs ¶5 | 0.243 (n = 18) → 0.143 (n = 17) | sum of 18 values 4.374; the dropped value would have to be 1.943 (1.926 to 1.961 allowing for rounding); dropping any value in [0, 1] leaves a mean of 0.199 to 0.257; dropping the largest plotted point (0.436) leaves 0.229 |
| Spread of plotted points | Fig. 3A vs ¶3 and ¶5 | implied SDs 0.112 to 0.143 (¶3) and 0.140 to 0.206 (¶5) | SD of the visible points in each column 0.121 to 0.154; closer to the ¶3 SD in all 6 cells |
| ¶4 values | ¶4 vs ¶3 | ¶4 cites Fig. 3B and is introduced as comparing SNpc and VTA | all six ¶4 values are identical to the ¶3 SNpc/Put values |
| ¶4 stated ordering | ¶4 | "highest ... proximal neurites ..., followed by distal neurites ... and somata" | by ¶4's own numbers the order is proximal > somata > distal in both groups (control 0.538 > 0.420 > 0.377; PD 0.408 > 0.357 > 0.243) |
| VTA/NAc values | ¶3 vs Fig. 3B | control 0.401, 0.588, 0.620; PD 0.489, 0.628, 0.592 | Fig. 3B bars 0.402, 0.588, 0.615; 0.485, 0.629, 0.588 (agree) |
| PD proximal vs somata, "significantly higher" | ¶5; Fig. 3A asterisk | significant | context only: unpaired Welch t = 1.36, p = 0.18 with the ¶3 values; t = 1.87, p = 0.070 with the ¶5 values. The two compartments come from the same cases and the paper used two-way ANOVA with Tukey's test, so summary statistics cannot check the asterisk |
Three things follow. First, paragraphs 3 and 5 cannot both describe the Fig. 3A data: they give different means for the same group and compartment in all six cells, and different SEMs at the same n. Second, the n = 17 summary is not a subset of the n = 18 summary, because the case dropped would need a Manders' coefficient of about 1.94. Third, the published figure agrees with paragraph 3. Its six mean bars lie within 0.004 of the paragraph 3 means and 0.043 to 0.101 from the paragraph 5 means. The one exception is PD proximal, where the two text means differ by only 0.004. The PD putamen column has 18 points, not 17, and their mean and SEM (0.241 ± 0.030) reproduce 0.243 ± 0.030.
Figure
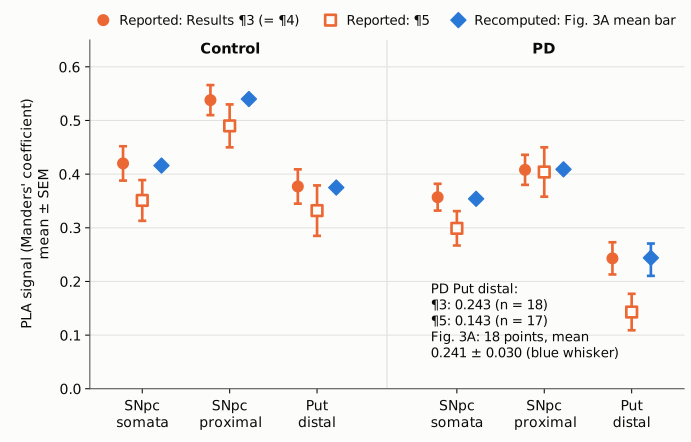
Figure 1. The six nigrostriatal cells of Fig. 3A (Manders' coefficient, mean ± SEM, on a full 0 to 0.65 axis). Filled orange circles are the values reported in Results paragraph 3, which paragraph 4 repeats verbatim. Open orange squares are the values reported in paragraph 5. Both paragraphs cite Fig. 3A. Blue diamonds are the mean bars read from the published Fig. 3A image by recompute.py.txt. For PD putamen, the blue whisker is the SEM of the 18 plotted points, recomputed from their positions. The blue values sit on the paragraph 3 values in every cell. Paragraph 5 is lower in every cell, and for PD putamen it gives 0.143 (n = 17) where the figure shows 18 points averaging 0.241.
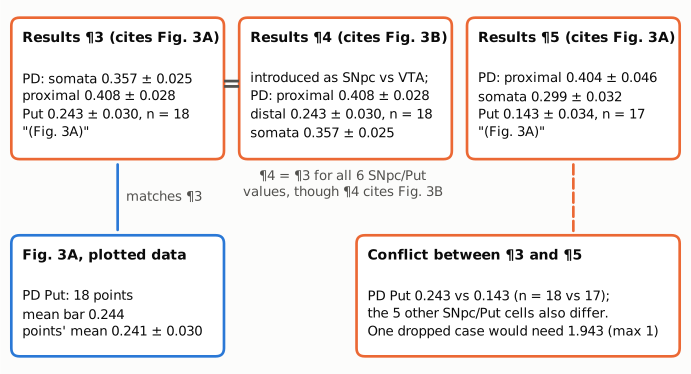
Figure 2. Short excerpts of the PD values in the three Results passages, with the figure each one cites. Paragraph 4 is introduced as a comparison of SNpc and VTA neurons and cites Fig. 3B, yet reproduces the six SNpc/Put values of paragraph 3. Paragraph 5 cites Fig. 3A, like paragraph 3, and gives different values. The blue box is what the Fig. 3A image shows for PD putamen. The orange box gives the size of the conflict and the value one dropped case would need to have.
Why it matters
- The headline compartment carries the largest discrepancy. The Introduction and Discussion single out a PD-related reduction "particularly in distal neurites in the Put". The PD-minus-control difference in putamen is 0.134 (0.243 vs 0.377) by paragraph 3 and 0.189 (0.143 vs 0.332) by paragraph 5, which is 41% larger. PD putamen is 64% of control by paragraph 3 and 43% by paragraph 5. A reader using paragraph 5 overstates the reduction relative to the plotted data.
- The within-pathway pattern is described with numbers that do not match the figure. Paragraph 5 supports the "mismatch in metabolic compensation along the nigrostriatal pathway" and the PD proximal-versus-somata difference it calls significant. In paragraph 5 that difference is 0.105; in paragraph 3 and in the figure it is about 0.05. The ordering (proximal > somata > distal in both groups) is the same in both sets, so the qualitative pattern stands. The magnitudes in paragraph 5 do not.
- The VTA-gradient paragraph has no VTA numbers. Paragraph 4 is introduced as comparing SNpc and VTA neurons and cites Fig. 3B, but it reports only SNpc/Put values, in an order its own numbers contradict. The VTA gradient claimed in the Introduction and Discussion (somata < proximal < distal in controls) is consistent with the control VTA/NAc values in paragraph 3 (0.401, 0.588, 0.620) and with Fig. 3B. So the claim has support, but not from the paragraph written to present it.
- The direction of the main findings does not change. Under either set, PD is lower than control in all three SNpc/Put compartments, and putamen is the lowest compartment in PD. The abstract's qualitative statements hold. The error concerns which descriptive statistics belong to the plotted data, and how large the reported effects are.
Explanations considered
- Rounding or transcription of a single value. Does not account for it. All six cells differ, the SEMs differ at identical n (for example control proximal 0.028 vs 0.040, both n = 20), and the PD putamen means differ by 0.100.
- One case excluded from the PD putamen set (n = 18 → 17). Ruled out. Reaching 0.143 from 0.243 by dropping one case would require that case to have a Manders' coefficient of 1.943, outside the 0 to 1 range. It also would not explain the changes in the five other cells, four of which keep the same n.
- A different batch or subset. Not supported by the stated n. The legend says the sections were run in two batches and "The figure presents combined data from all sections". Paragraph 5 gives n = 20, 20 and 19 for control and 20, 20 and 17 for PD, essentially the full cohort, so it is not a single batch of about half the cases.
- A different metric or normalisation, such as an earlier threshold setting. Cannot be checked from the paper and does not match the figure. The paragraph 5 means are lower in every cell, but not by a common offset (0.004 to 0.100) or a common factor (0.59 to 0.99). Both paragraphs use the same unit label ("R") and cite the same panel. The paper describes only one PLA quantification. Whatever its origin, the paragraph 5 set is not the data plotted in Fig. 3A.
- Paragraph 3, not paragraph 5, is the one in error. Not supported. The Fig. 3A mean bars match paragraph 3 within 0.004 in all six cells. The PD putamen column has 18 separable points with mean 0.241 and SEM 0.030. The visible-point spread in every column is closer to the paragraph 3 SDs.
- Paragraph 4 describing VTA with the right numbers. Ruled out. Its six values are the paragraph 3 SNpc/Put values, not the paragraph 3 VTA/NAc values (control 0.401, 0.588, 0.620; PD 0.489, 0.628, 0.592), which Fig. 3B also shows.
- A conversion or archiving artifact. Ruled out. The same paragraph 3 and paragraph 5 values appear in the live PMC page, in the Europe PMC full-text XML (the publisher's JATS) and in the local PMC archive.
- Side observation, not part of the main finding. The Results give the control cohort as "11 males and 9 females"; Table 1 lists 9 males and 11 females, as do the Methods. The Methods give mean ages of 78.6 ± 6.8 (PD) and 83.5 ± 5.7 (control). Table 1 gives 78.95 (SD 7.22) and 83.20 (SD 8.39), which agree, to rounding, with the Results values of 78.95 ± 1.61 and 83.20 ± 1.87 (SEM; Table 1 implies 1.61 and 1.88). These do not affect the PLA results.
Status
- Version of record. The publisher's page (science.org, reached through doi.org) returned HTTP 403 to automated requests. Paragraphs 3, 4 and 5 read the same in three other copies of the published text: the live PMC page, the Europe PMC full-text XML (the publisher's JATS) and the local PMC archive. Every quotation above was checked verbatim against the PMC-archived text with
src/show.py. - Supplements. The Europe PMC supplementary bundle holds the six main-figure images and
sciadv.ads3051_sm.pdf(4 pages). The PDF contains Fig. S1 (a different assay, DJ-1–14-3-3β PLA puncta), Table S1 (antibodies and reagents) and Table S2 (PLA optimisation). It has no DJ-1–β-subunit values or source data, so it cannot settle which set is correct. The Fig. 3 image is the only further evidence, and it matches paragraph 3. - Corrections and comments. As of 2026-10-24, no correction, erratum, retraction or expression of concern was found.
src/known.pyreturns no Crossref update relations and no PMC notices. The Crossref record (published 2025-06-06) has empty update-to and updated-by fields and an empty relation field. The PMC article page shows no notice. The PubPeer API returned no record (HTTP 404) for the DOI, and web searches for the title or DOI with "correction", "erratum" or "PubPeer" found nothing relevant. Not reachable: the Europe PMC search API (HTTP 503), and the science.org page and PubPeer search page (both HTTP 403). - Sources. PMC article PMC12143374; Europe PMC full-text XML and supplementary files for PMC12143374; Crossref; PubPeer; https://doi.org/10.1126/sciadv.ads3051.
Suggested correction
In Results paragraph 5, replace the six values with the ones that match Fig. 3A, as given in paragraph 3. Control: proximal neurites M = 0.538 ± 0.028 R, n = 20; somata M = 0.420 ± 0.032 R, n = 20; Put M = 0.377 ± 0.032 R, n = 19. PD: proximal neurites M = 0.408 ± 0.028 R, n = 20; somata M = 0.357 ± 0.025 R, n = 20; Put M = 0.243 ± 0.030 R, n = 18. If paragraph 5 is instead meant to report a different analysis, that analysis should be described and the panel it refers to identified. Either way, the authors may wish to confirm that the "significantly higher" proximal-versus-somata statement for PD, and the Fig. 3A asterisk, refer to the plotted data.
In Results paragraph 4, the values and the figure citation should describe the comparison the paragraph introduces. If the paragraph is meant to present the VTA gradient claimed in the Introduction and Discussion, the corresponding Fig. 3B values from paragraph 3 are control somata 0.401 ± 0.019, proximal 0.588 ± 0.028, NAc 0.620 ± 0.019; PD somata 0.489 ± 0.027, proximal 0.628 ± 0.030, NAc 0.592 ± 0.027. The stated order ("followed by distal neurites ... and somata") should match whichever numbers are given.
Separately, the control sex split in Results paragraph 2 ("11 males and 9 females") could be aligned with Table 1 (9 males, 11 females), and the Methods mean ages with Table 1.