← Back to the plain-language case
Abstract reports P < 0.0001 for 3/170 vs 3/172 serious adverse events; the table gives P > 0.999
Nat Med (2025) · doi:10.1038/s41591-025-03674-y · PMC12092238
Summary
The abstract of this randomized trial (SUPPRESS-AF) says that procedure-related serious adverse events did not differ between PVI plus low-voltage-area ablation and PVI alone, and gives "1.7% versus 1.8%, P < 0.0001". The paper's own Extended Data Table 4 gives the counts behind those percentages, 3 of 170 and 3 of 172, and prints P > 0.999 for the same comparison with the test the Methods name (two-sided Fisher's exact test). Recomputed from those counts, Fisher's exact test gives P = 1.000. With six events in total, no split between the arms could give a two-sided Fisher P below 0.014. The words "no difference" are correct and the table is correct. The P value in the abstract is not, and a reader of the abstract alone sees a highly significant safety difference that the data do not show.
What the paper reports
Abstract:
There was no difference in the procedure-related serious adverse events between the two groups (1.7% versus 1.8%, P < 0.0001).
Extended Data Table 4, "Safety endpoints". This table is an image in the archived article; the text below was read from the publisher's image file (41591_2025_3674_Tab4_ESM.jpg). Columns: PVI+LVA-ABL n=170 | PVI-alone n=172 | p:
Procedure-related serious adverse events, n (%) | 3 (1.7) | 3 (1.8) | >0.999
Extended Data Table 4, footnote:
p for comparison between groups using the two-sided Fisher's exact test.
Methods, "Statistical analysis":
Safety endpoints were analyzed using Fisher's exact test. All tests were conducted at a two-sided α level of 0.05.
Results, "Safety endpoints":
There was no difference in procedure-related serious adverse events between the two groups. Case presentations of procedure-related serious adverse events are shown in Extended Data Table 6.
Discussion, fourth paragraph:
Serious, procedure-related, adverse event rates were not increased with the addition of LVA ablation.
Results, "Patients and follow-up" (the safety population):
A total of 342 patients were randomly assigned to either the LVA-ABL group (170 patients) or the PVI-alone group (172 patients) and safety outcomes were assessed.
Extended Data Table 6 (an image, read from 41591_2025_3674_Tab6_ESM.jpg) describes six cases: in PVI-alone, one cardiac tamponade, one stroke and one major bleeding; in PVI+LVA-ABL, one esophageal fistula and two major bleedings.
What the paper's own numbers show
Method. I took the counts and denominators from Extended Data Table 4 and checked them against the case list in Extended Data Table 6. I ran a two-sided Fisher's exact test on the 2×2 table [[3, 167], [3, 169]], the test that the Methods and the table footnote name. As robustness checks I also ran one-sided Fisher tests, chi-square tests with and without continuity correction, and Fisher's test with the efficacy-population denominator (171) in place of 172. Because Fisher's test conditions on the total number of events, I listed every possible split of the six events and its P value, to find the smallest P these margins allow. I also found how many events the LVA arm would need, against 3/172, for P < 0.0001. Finally I recomputed the other rows of Extended Data Table 4 with the same test to confirm that the method reproduces the paper's printed values. Every number below is printed by recompute.py.txt.
| Quantity | Location | Reported | Recomputed from the paper's numbers |
|---|---|---|---|
| Serious AEs, PVI+LVA-ABL | Abstract; Ext. Data Table 4 | 3 (1.7%) of 170 | 3/170 = 1.76% |
| Serious AEs, PVI-alone | Abstract; Ext. Data Table 4 | 3 (1.8%) of 172 | 3/172 = 1.74% (3/171 = 1.75%) |
| Case count | Ext. Data Table 6 | 6 cases | 3 PVI+LVA-ABL, 3 PVI-alone |
| P, serious AEs | Abstract | P < 0.0001 | Fisher two-sided P = 1.000 |
| P, serious AEs | Ext. Data Table 4 | >0.999 | Fisher two-sided P = 1.000 (odds ratio 1.012) |
| P with denominator 171 | robustness | – | 1.000 |
| One-sided Fisher P | robustness | – | 0.652 (greater) / 0.663 (less) |
| Chi-square P | robustness | – | 1.000 (Yates); 0.988 (uncorrected) |
| Risk difference | robustness | – | 0.02 percentage points (95% CI −2.76 to 2.80) |
| Lowest two-sided Fisher P over all splits of 6 events | robustness | – | 0.014 (all six in PVI-alone); 0.030 (all six in PVI+LVA-ABL) |
| LVA-arm events needed for P < 0.0001 vs 3/172 | robustness | – | 21/170 (12.4%), P = 8.7×10⁻⁵ |
| Bleeding events, 6 vs 2 | Ext. Data Table 4 | P = 0.173 | P = 0.1727 |
| Death from any cause, 2 vs 2 | Ext. Data Table 4 | >0.999 | P = 1.000 |
| Periprocedural AEs, 11 vs 4 | Ext. Data Table 4; Discussion | P = 0.069; OR 2.91 (0.91–9.31) | P = 0.0692; OR 2.91 (Woolf CI 0.91–9.31) |
| Symptomatic stroke, 4 vs 2 | Ext. Data Table 4 | 2 (1.7%), P = 0.723 | 2/172 = 1.16%, P = 0.447; with 3/172: 1.74%, P = 0.723 |
The same procedure reproduces the printed P values for bleeding, death and periprocedural events, and the table's own >0.999 for serious adverse events. Only the abstract's value disagrees.
Two smaller points, which do not bear on the main finding. First, 3/170 = 1.76% and 3/172 = 1.74%, so ordinary rounding would give 1.8% and 1.7%; the printed 1.7% and 1.8% appear in swapped order, in both the abstract and the table. Second, in the symptomatic stroke row the PVI-alone entry "2 (1.7)" is internally inconsistent: 2/172 is 1.2%, and Fisher's test on 4 vs 2 gives P = 0.447, whereas 3/172 gives both the printed 1.7% and the printed P = 0.723. The count may be 3 rather than 2; the paper does not say which entry is correct.
Figure
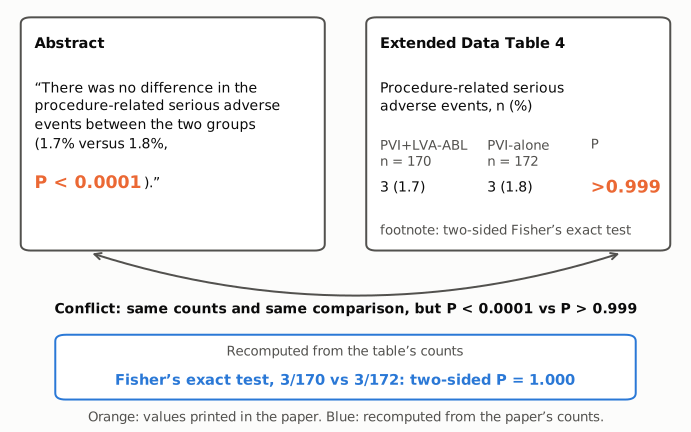
Figure 1. The two places the paper reports the comparison of procedure-related serious adverse events. The left panel quotes the abstract and the right panel reproduces the relevant row of Extended Data Table 4: the same percentages, the same counts and a footnote naming the two-sided Fisher exact test. The printed P values (orange) are P < 0.0001 and P > 0.999. The blue box gives the two-sided Fisher exact P recomputed from the table's counts, 3/170 vs 3/172, which is 1.000 and agrees with the table.
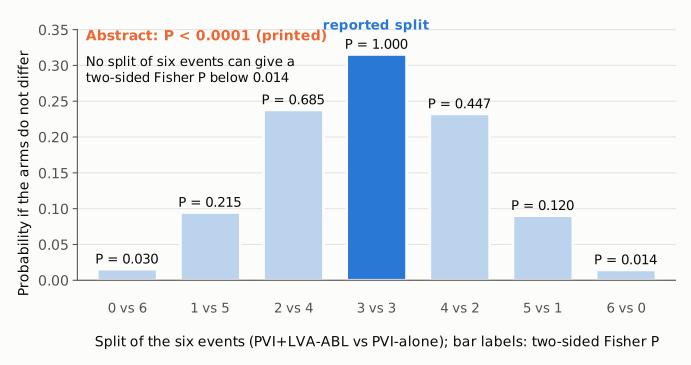
Figure 2. Given the arm sizes (170 and 172) and six events in total, these are the seven possible splits of the events. Bar heights are the probability of each split if the arms do not differ (hypergeometric distribution), and each bar is labelled with its two-sided Fisher exact P. The reported split, 3 vs 3, is the most likely split and has P = 1.000. The most extreme splits give P = 0.030 and 0.014, so no arrangement of six events in these arms could yield the P < 0.0001 printed in the abstract (orange text). All values are computed in recompute.py.txt.
Why it matters
The abstract is the part of the paper most readers see, and it is what indexing services and summaries reproduce. Read alone, "P < 0.0001" signals a highly significant difference in serious procedural harm between the two ablation strategies, the opposite of what the counts show and of what the same sentence says in words. A reader who notices the clash cannot tell from the abstract which part is wrong.
The effect on the paper's conclusions is small. The Results, Discussion and Extended Data Table 4 all report no difference, the table's P value is correct, and the primary efficacy result (61% vs 50% freedom from AF or AT, log-rank P = 0.127) does not depend on this value. The correct P (about 1.0) leaves the paper's safety reading unchanged: adding LVA ablation did not increase procedure-related serious adverse events in this trial. The trial is small for this endpoint, however (six events in total, risk-difference 95% CI about −2.8 to +2.8 percentage points), and the Discussion itself notes a tendency toward more periprocedural adverse events with LVA ablation (11 vs 4, P = 0.069). That point is separate and is not affected by this error.
Explanations considered
- Text conversion or typesetting artifact. Not supported. The same "P < 0.0001" appears in the publisher's PDF (PMC open-access copy, created by Springer on 2025-05-16) and in the Europe PMC full-text XML, where the "<" is an explicit
<entity between thin spaces. It is not a lost ">" sign read from an image, a mis-set superscript or a shifted table cell. - A different population, time point or event definition. Not supported. The abstract's percentages (1.7% and 1.8%) are exactly those printed in Extended Data Table 4 for procedure-related serious adverse events, and the case list in Extended Data Table 6 gives the same 3 vs 3. Using the efficacy denominator (171) instead of 172 also gives P = 1.000.
- A different test. Not supported. The Methods state that safety endpoints were analyzed with Fisher's exact test at a two-sided α of 0.05, and the table footnote says the same. One-sided Fisher tests (0.652, 0.663) and chi-square tests (0.988, 1.000) give values near 1. With these margins no split of the six events yields a two-sided Fisher P below 0.014.
- A non-inferiority or equivalence test. Not supported. A one-sided test against a margin could produce a small P for two near-identical rates (for example, a hypothetical margin of 5 percentage points would give P ≈ 2.3×10⁻⁴, and 3 points P ≈ 0.018), but the paper describes no non-inferiority or equivalence analysis and no safety margin, the trial was designed for superiority on the primary efficacy endpoint, and the sentence frames the result as "no difference". No margin is stated that would reproduce exactly "P < 0.0001".
- A correct value of a different comparison. No other comparison in the archived text is reported as P < 0.0001 (the smallest printed values, for procedural times and energy in Table 2, are given as <0.001), so there is no nearby value the sentence could have taken by mistake that can be identified. The cause of the discrepancy cannot be determined from the paper; what can be determined is that the printed value is incompatible with the printed counts and stated test.
Status
As of 2026-10-23:
- Version of record. The error is in the version of record. The nature.com article page could not be fetched automatically (it redirected to a login page), so I checked the publisher's PDF from the PMC open-access collection (PMC12092238.1.pdf, metadata creator "Springer", subject "Nature Medicine, doi:10.1038/s41591-025-03674-y") and the Europe PMC full-text XML. Both contain "(1.7% versus 1.8%, P < 0.0001)".
- Supplements. Extended Data Tables 4 (safety endpoints), 5 (periprocedural adverse events) and 6 (case descriptions of procedure-related serious adverse events) were read from the publisher's image files on media.springernature.com; the PMC text has captions only for these tables. Extended Data Tables 4 and 6 resolve the question: they give 3 vs 3 events and P > 0.999. The Supplementary Information PDF (protocol and statistical analysis plan) could not be downloaded in a readable form; it is not needed to settle the discrepancy.
- Corrections and comments. No correction, erratum, retraction or expression of concern was found. Crossref lists no update relations for the DOI, and PMC and Europe PMC list no correction or comment notices. A web search for an author correction to this article returned none.
- PubPeer. The PubPeer API returned no publication record for the DOI, and the PubPeer search page refused automated access (HTTP 403), so PubPeer could not be checked directly. A web search for the title together with "PubPeer" found no thread. Absence of a PubPeer discussion is therefore not fully confirmed.
- Sources. PMC article PMC12092238; publisher PDF (PMC open-access copy); Europe PMC full-text XML; Extended Data Table images 41591_2025_3674_Tab4_ESM.jpg, Tab5_ESM.jpg and Tab6_ESM.jpg (media.springernature.com); Crossref; Europe PMC; PubPeer.
Suggested correction
- In the abstract, replace "(1.7% versus 1.8%, P < 0.0001)" with the value in Extended Data Table 4, for example "(3/170 (1.8%) versus 3/172 (1.7%), P > 0.999)".
- Check the order of the percentages for this row in the abstract and in Extended Data Table 4: 3/170 rounds to 1.8% and 3/172 to 1.7%.
- Check the symptomatic stroke row of Extended Data Table 4: the PVI-alone entry "2 (1.7)" with P = 0.723 is consistent with 3 events, not 2. Correct either the count or the percentage and P value.
- Optional: in the Discussion, the periprocedural adverse event percentages are labelled "95% CI" ("11 (95% CI = 6.5%) versus 4 (95% CI = 2.3%) patients"); they are proportions, not confidence intervals.