← Back to the plain-language case
Abstract reports the deductive-reasoning test as F(2,387), an error df larger than the whole sample
Brain (2025) · doi:10.1093/brain/awaf062 · PMC12073978
Summary
The Abstract reports the omnibus group comparison on the Deductive Reasoning Test (DRT) as F(2,387) = 18.491, P < 0.001. The Results report the same test as F(2,142) = 7.73, P < 0.001. The Results value fits the paper's own numbers exactly: Table 2 lists 48 + 55 + 43 = 146 participants, and an age-adjusted ANCOVA across three groups leaves 146 − 4 = 142 error degrees of freedom. An error df of 387 would need 391 participants, more than the 328 people recruited in total. Significance and direction are the same under either value, and the effect size each tuple implies is similar (partial η² 0.087 and 0.098). But the Abstract makes the evidence for the deductive-reasoning difference look as strong as that for the analogical-reasoning difference (F = 18.93) and implies a sample more than twice the size of the one analysed.
What the paper reports
ART and DRT performance was significantly impaired in patients with frontal lesions [ART: F(2,238) = 18.93; P < 0.001; Frontal group worse than Posterior group and healthy controls, both P < 0.001; DRT: F(2,387) = 18.491; P < 0.001; Frontal group worse than healthy controls, P < 0.01].
— Abstract
There was a significant difference between the Frontal, Posterior and HC groups for overall DRT performance [F(2,142) = 7.73; P < 0.001; see Table 2].
— Results, "Deductive reasoning task", first paragraph
HC(n = 48) | Frontal(n = 55) | Posterior(n = 43) | Left frontal(n = 24) | Right frontal(n = 31) | Left posterior(n = 19) | Right posterior(n = 24)
— Table 2, "Performance on the Deductive Reasoning Task", column headers. The table footer reads: "Groups are compared using analysis of covariance (ANCOVA), controlling for age."
Frontal, Posterior and HC groups were compared on demographic variables, using ANOVA and Fisher’s exact test, and performance on neuropsychological tests, ART and DRT, using analysis of covariance (ANCOVA), controlling for age.
— Methods, "Behavioural analysis"
Behavioural analyses were conducted on the 176 patients with lesions falling within frontal or posterior areas and HCs using SPSS version 29 (https://www.ibm.com/spss).
— Methods, "Behavioural analysis"
Two-hundred and forty-seven patients with unilateral, focal lesions were prospectively recruited from the National Hospital for Neurology and Neurosurgery
Eighty-one HCs, with no neurological or psychiatric history, were recruited to match patients as closely as possible for age, gender, years of education and National Adult Reading Test (NART) scores.
— Methods, "Participants"
What the paper's own numbers show
Method. In a one-way ANCOVA with k = 3 groups and one covariate (age), the F test for the group effect has k − 1 = 2 numerator df and N − k − 1 = N − 4 error df. The group sizes printed in the table headers therefore fix the error df. The same rule was checked against every other F test in the Results whose groups are tabulated. The age-adjusted F itself cannot be rebuilt from summary tables, because that needs the covariance of age with the scores. As a reference point only, the unadjusted one-way ANOVA F was computed from each table's n, means and SDs. Every number below is printed by recompute.py.txt (Python, numpy/scipy).
| Quantity | Location | Reported | Recomputed from the paper's numbers |
|---|---|---|---|
| DRT sample size | Table 2 header | HC 48, Frontal 55, Posterior 43 | N = 146; subgroups agree (24 + 31 = 55; 19 + 24 = 43) |
| DRT error df, ANCOVA with age | Results | 142 | 146 − 4 = 142 (matches) |
| DRT error df | Abstract | 387 | would need N = 391 (ANCOVA) or 390 (no covariate) |
| Largest possible sample | Methods, Participants | 247 patients + 81 HCs | 328 in total, so a three-group ANCOVA on all of them has error df 324 |
| Behavioural analysis set | Methods, Behavioural analysis | 176 patients + HCs | 176 + 81 = 257 |
| P for F(2,142) = 7.73 | Results | P < 0.001 | 6.5 × 10⁻⁴ |
| P for F(2,387) = 18.491 | Abstract | P < 0.001 | 2.1 × 10⁻⁸ |
| Partial η² implied by each tuple | Results / Abstract | — | 0.098 / 0.087 |
| Ratio of the two DRT F values | Abstract vs Results | 18.491 vs 7.73 | 2.39 |
| Unadjusted DRT F from Table 2 n, means, SDs | Table 2 | — | F(2,143) = 6.80, P = 0.0015 (Results F is 1.14 times this; Abstract F is 2.72 times) |
| Control: ART sample and error df | Table 1; Abstract; Results | n 72 + 100 + 70; df 238 | N = 242; 242 − 4 = 238 (matches) |
| Control: unadjusted ART F from Table 1 | Table 1 | F(2,238) = 18.93 | F(2,239) = 17.36 (reported is 1.09 times this) |
| Control: DRT indeterminate / determinate | Results | F(2,142) = 7.93 / 4.23 | unadjusted 7.18 / 3.81 (ratios 1.10 / 1.11); df 142 matches |
| Control: ART progression / odd-one-out | Results | F(2,238) = 15.20 / 11.74 | unadjusted 14.16 / 11.13 (ratios 1.07 / 1.06); df 238 matches |
| Control: pooled Frontal and Posterior DRT means | Table 2 | 71.67 / 79.37 | 71.68 / 79.37 from the hemisphere subgroups |
| Other error dfs in Results (RAPM, S fluency, Stroop) | Results | 184, 151, 150 | imply N = 188, 155, 154, all ≤ 257 |
Every ART and DRT F test in the Results has error df = N − 4 for its table, and each of the six tabulated ANCOVA Fs lies 6–14% above the unadjusted F from the same table. The Abstract's DRT tuple is the only one that fits neither pattern.
Figure
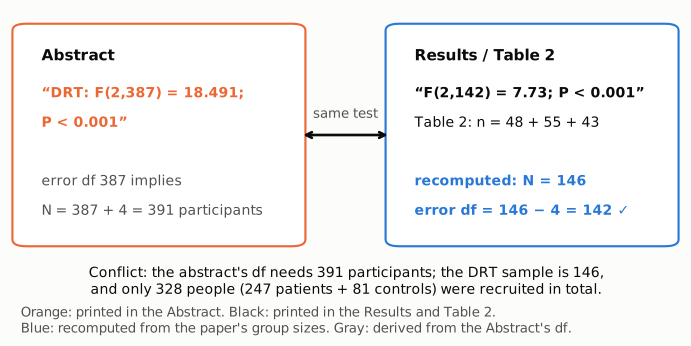
Figure 1. The two printed versions of the DRT omnibus test. Left: the Abstract's F(2,387) = 18.491 (orange). Under the ANCOVA described in Methods (three groups, age as covariate) an error df of 387 corresponds to N = 391 (gray, derived from the Abstract's df). Right: the Results' F(2,142) = 7.73 and the Table 2 group sizes (black, as printed), from which N = 146 and error df 146 − 4 = 142 are recomputed (blue). The study recruited 328 participants in total (247 patients and 81 healthy controls), so no analysis described in the paper could have 387 error df.
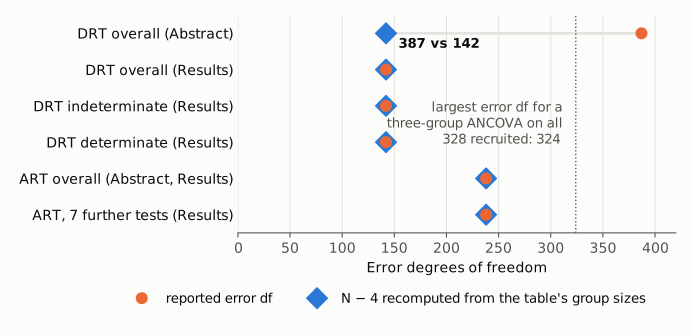
Figure 2. Reported error df (orange circles) and the error df recomputed as N − 4 from the group sizes in Table 1 or Table 2 (blue diamonds) for every ART and DRT omnibus F test in the paper. The seven further ART tests (progression, odd-one-out, intra- and cross-dimensional and others) all report df 238 and are drawn as one row. The dotted line marks 324, the error df of a three-group ANCOVA with age on all 328 recruited participants. The Abstract's DRT value is the only one that departs from N − 4, and it lies beyond that ceiling.
Why it matters
The Abstract gives the DRT omnibus test as one of two headline behavioural results, set beside the ART result as evidence that "ART and DRT performance was significantly impaired in patients with frontal lesions". Read from the Abstract, the evidence for the two group differences looks about equally strong (F = 18.93 and F = 18.491, both with P near 2 × 10⁻⁸). By the paper's own Results, the evidence for the DRT difference is clearly weaker (F = 7.73, P = 6.5 × 10⁻⁴), and it rests on 146 participants, not the roughly 391 that the printed df implies. The DRT effect size is smaller than the ART one under either tuple (partial η² 0.087 or 0.098, against 0.137 for the ART).
The stated conclusions do not change. Both tuples give P < 0.001, the Frontal group is worse than healthy controls under either, and the implied partial η² is similar (0.087 and 0.098). The paper's main findings — the right-versus-left frontal differences on the ART and on DRT indeterminate questions, and the lesion-deficit network mapping — rest on other analyses.
The readers most likely to be affected are those who take test statistics or sample sizes from abstracts, such as reviewers judging sample size and precision, or meta-analysts. A meta-analyst who converts the Abstract tuple gets a slightly smaller partial η² (0.087 instead of 0.098) and a much larger N (391 instead of 146), which would give the DRT result far more weight than its sample supports. The Abstract also presents the DRT as a promising clinical test. For a reader weighing that claim, the Abstract overstates the strength of evidence and the sample size behind the DRT result, while the effect size it implies is close to the Results value.
Explanations considered
- A different or larger analysis population. This does not account for the numbers. Methods state that behavioural analyses used the 176 frontal and posterior patients and the HCs, at most 257 people. Even a three-group ANCOVA on all 247 recruited patients and all 81 HCs together (328) would have an error df of 324, not 387.
- An analysis without the age covariate. This does not account for the numbers. Dropping the covariate raises the error df by one (390 needed instead of 391), which still exceeds the recruited sample.
- Repeated measures, or pooling determinate and indeterminate questions. This does not account for the numbers. The paper analyses the two question types in separate ANCOVAs, each with df 142. Pooling 146 participants' two scores would give 292 observations and an error df of 288, not 387, and between-subject effects in a repeated-measures model would keep df 142.
- A typing slip in the df alone. This does not account for the numbers. The F value also differs (18.491 against 7.73), and it is reported to three decimals where every other F in the paper has two.
- Age adjustment raising F. This does not account for the numbers on its own terms. The same paper reports the age-adjusted F for this test as 7.73. Across all six tabulated tests the reported ANCOVA F is 1.06–1.14 times the unadjusted F, while the Abstract's 18.491 would be 2.72 times.
- A conversion or typesetting artefact in the archived copy. This was ruled out. The publisher's version of record and the Europe PMC full-text XML give the same Abstract text ("F(2,387) = 18.491") and the same Results text ("F(2,142) = 7.73") as the PMC archive.
- An analysis reported only in the supplement. This was ruled out. The supplementary PDF contains task descriptions, lesion methods and two supplementary tables (demographics and background tests). It reports no DRT omnibus statistic and no group sizes that could give an error df of 387.
The Abstract's 18.491 is numerically close to the ART statistic, 18.93. That is an observation only; the paper's numbers do not show how the Abstract value arose.
Status
As of 2026-10-23:
- Version of record: checked. doi.org resolves to the publisher page (Brain 148(5):1757). Its Abstract reads "DRT: F(2,387) = 18.491; P < 0.001" and its Results read "F(2,142) = 7.73; P < 0.001". The Europe PMC JATS XML and the local PMC archive match, and the Table 2 header in the XML gives n = 48, 55 and 43. The PMC HTML page returned a CAPTCHA, so Europe PMC was used in its place.
- Supplement: checked. The supplementary bundle from Europe PMC holds the same supplementary PDF (14 pages) linked from the publisher page. Its text was searched for "387", "18.49", "F(2", "DRT" and "Deductive". It does not resolve the discrepancy (see above).
- Corrections: none found. Crossref lists no updates (no update-to or updated-by entries, and no Retraction Watch entry in the Crossref labs record), and PMC and Europe PMC list no notices, checked with
src/known.pyand the Crossref API. Europe PMC (PMID 40233941) links only to a scientific commentary in the same issue (doi:10.1093/brain/awaf117), which quotes no F statistics and mentions no error. The publisher page shows no correction notice. - PubPeer: the PubPeer API returned HTTP 403 to an automated query. A web search for the title with "PubPeer", "correction" or "erratum" found no thread, erratum or published comment. A manual search at pubpeer.com is still advisable.
Sources: doi.org/10.1093/brain/awaf062 · publisher article page · PMC12073978 · Europe PMC record · Crossref works record · scientific commentary
Suggested correction
The authors could check the DRT omnibus ANCOVA in the Abstract against the original output and align it with the Results. If the Results value is correct, the Abstract would read "DRT: F(2,142) = 7.73; P < 0.001; Frontal group worse than healthy controls, P < 0.01". If 18.491 comes from a different analysis, the Abstract should say which analysis it is and how many participants it included, since no analysis described in the paper has an error df of 387.