← Back to the plain-language case
Abstract's headline mortality reductions match the paper's no-services scenario, not its maximum-services scenario
Nat Commun (2025) · doi:10.1038/s41467-025-59060-2 · PMC12032021
Summary
The abstract of this individual-based modelling study of maternity services in Malawi states that maximising the use and quality of all services together reduces the stillbirth, maternal and neonatal mortality rates by 10%, 52% and 57%. The paper's own Tables 2–4, Results and Discussion give 13.6%, 63.7% and 44.2% for that scenario (about 14%, 64% and 44%), and recomputing from the tabulated means gives 13.3%, 63.7% and 44.4%. The abstract's three numbers equal, after rounding, the percentage increases the tables report for the opposite scenario, in which all maternity services are removed (9.6%, 51.8% and 57.0%). As a result the abstract understates the maternal mortality reduction by about 12 points, overstates the neonatal reduction by about 13 points, and reverses which of the two outcomes falls most. The direction of the result and the paper's qualitative conclusions are unaffected.
What the paper reports
Abstract:
Whilst current service delivery is inferred to avert morbidity and mortality, the largest reductions in the stillbirth, maternal and neonatal mortality rates were observed when the use and quality of all services was maximised concurrently (a 10%, 52% and 57% reduction respectively).
Results, "Impact of maternity service delivery on mortality and DALYs", paragraph 1 (maternal mortality, All services max.):
In this scenario the average MMR was 64% lower than the SQ scenario at 120 (95% CI [114.8, 125.2]) maternal deaths per 100,000 live births.
Same section, paragraph 4 (stillbirth):
A 14% reduction in the average SBR during the intervention period was observed in the scenario All services max.
Same section, paragraph 5 (neonatal mortality):
Maximum availability of maternity services, as defined in Table 1 as All services max., was predicted to reduce NMR by nearly half (44%) potentially averting over 3 million DALYs during the intervention period.
Discussion, paragraph 2:
As expected, scenarios where coverage and quality of all services were maximised in tandem led to the greatest percentage reduction in the average MMR (64%), NMR (44%) and SBR (14%).
Results, paragraph 3 (the comparison of the Status Quo with the no-services scenario):
Current delivery of all included services within the SQ scenario are estimated to reduce the average MMR by 171.3 (95%) CI [161.2, 181.4] deaths per 100,000 live births (a 52% difference from the scenario All services min.) between 2023 and 2030.
Tables 2, 3 and 4, rate columns ("Average rate (95% CI) / Mean difference from SQ (95% CI) / Percentage difference from SQ"). The archived cells run the three values together; spaces are added here between them:
Table 2, Status Quo (SQ): 330.5 (322.4, 338.6) Ref.
Table 2, All services max.: 120.0 (114.8, 125.2) –210.5 (–220.0, –201.1) –63.7%
Table 2, All services min.: 501.8 (493.0, 510.7) 171.3 (161.2, 181.4) 51.8%
Table 3, Status Quo (SQ): 16.6 (16.4, 16.8) Ref.
Table 3, All services max.: 14.4 (14.2, 14.6) –2.3 (–2.6, –2.0) –13.6%
Table 3, All services min.: 18.2 (18.0, 18.4) 1.9 (1.3, 1.9) 9.6%
Table 4, Status Quo (SQ): 16.9 (16.7, 17.1) Ref.
Table 4, All services max.: 9.4 (9.3, 9.5) –7.5 (–7.6, –7.3) –44.2%
Table 4, All services min.: 26.5 (26.3, 26.7) 9.6 (9.3, 9.9) 57.0%
Footnote to Tables 2–4:
Percentage difference from the SQ is only presented for those scenarios in which the 95% confidence interval does not contain 0.
What the paper's own numbers show
Method. The tables express each scenario as a percentage difference from the Status Quo (SQ), i.e. 100 × (scenario − SQ) / SQ. I applied that formula to the printed means for the All services max. and All services min. rows of all three rate columns, and to the total-count and DALY columns. Because the means are printed to one decimal, I also computed the full range of the percentage over all unrounded values that would print as the displayed means. I then tested every plausible alternative source of the triplet 10 / 52 / 57 (other outcome columns, other denominators, other scenarios). Every number below is printed by recompute.py.txt.
| Quantity | Location | Reported | Recomputed from the paper's numbers |
|---|---|---|---|
| SBR reduction, All services max. vs SQ | Abstract | 10% | 13.3% from means 16.6 → 14.4 (12.7%–13.8% over rounding); not 10% |
| MMR reduction, All services max. vs SQ | Abstract | 52% | 63.7% from means 330.5 → 120.0; not 52% |
| NMR reduction, All services max. vs SQ | Abstract | 57% | 44.4% from means 16.9 → 9.4 (43.9%–44.8% over rounding); not 57% |
| SBR, All services max. vs SQ | Table 3; Results; Discussion | –2.3, –13.6%; "14%" | –2.2 and –13.3% from the levels; –13.6% lies inside the rounding range, so the table and text are consistent |
| MMR, All services max. vs SQ | Table 2; Results; Discussion | –210.5, –63.7%; "64%" | –210.5, –63.7%: consistent |
| NMR, All services max. vs SQ | Table 4; Results; Discussion | –7.5, –44.2%; "44%" | –7.5, –44.4%: consistent within rounding |
| Total stillbirths / maternal deaths / neonatal deaths, All services max. | Tables 3, 2, 4 | –13.3% / –63.6% / –44.0% | –13.3% / –63.6% / –44.0%: consistent, and none is 10 / 52 / 57 |
| Maternal / neonatal DALYs, All services max. | Tables 2, 4 | –67.2% / –44.4% | –67.2% / –44.4%: not 52 / 57 |
| SBR, All services min. vs SQ | Table 3 | +1.9 (1.3, 1.9), +9.6% | +1.6 from the levels, +9.6%; rounds to 10% |
| MMR, All services min. vs SQ | Table 2; Results ("a 52% difference") | +171.3, +51.8% | +171.3, +51.8%; rounds to 52% |
| NMR, All services min. vs SQ | Table 4 | +9.6, +57.0% | +9.6, +56.8%; the printed 57.0% rounds to 57% |
| Total stillbirths / maternal deaths / neonatal deaths, All services min. | Tables 3, 2, 4 | +9.5% / +51.7% / +56.9% | +9.5% / +51.7% / +56.9%; also round to 10 / 52 / 57 |
| Abstract minus table value, All services max. | derived | 10 / 52 / 57 | –3.6 / –11.7 / +12.8 percentage points (SBR / MMR / NMR) |
| Ranking of reductions across outcomes | derived | Abstract: NMR > MMR > SBR | Tables: MMR > NMR > SBR |
Every figure in the body for the All services max. scenario agrees with the tables. The abstract is the only place where the triplet 10 / 52 / 57 appears for that scenario, and the only row of the tables that reproduces it is All services min., which is a comparison in the opposite direction (mortality rises when services are removed).
A separate, minor inconsistency appears in the same table row: the All services min. SBR mean difference is printed as 1.9 with 95% CI (1.3, 1.9), so the point estimate equals its upper bound, while the printed levels (18.2 − 16.6) give 1.6. The printed 9.6% matches 1.6/16.6, not 1.9/16.6 (11.4%). This does not affect the main finding.
Figure
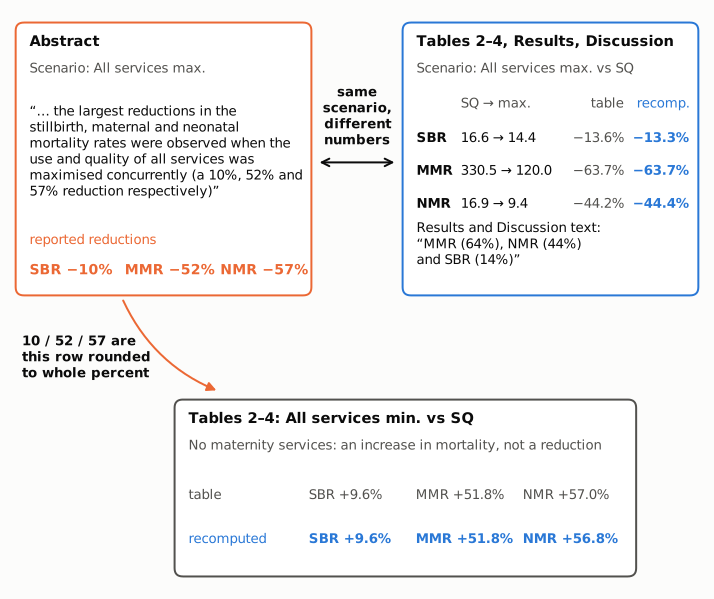
Figure 1. Left (orange): the abstract sentence and the three reductions it attributes to maximising all services. Right (blue): the same scenario in Tables 2–4, with the SQ and scenario means, the percentage the tables print (gray) and the percentage recomputed from those means (blue), and the Results/Discussion wording. The double arrow marks the conflict: the same scenario carries different numbers in the abstract and in the body. Bottom: the All services min. row of the same tables, the scenario in which all maternity services are removed. Its percentage increases from SQ (printed and recomputed) round to the abstract's 10%, 52% and 57%.
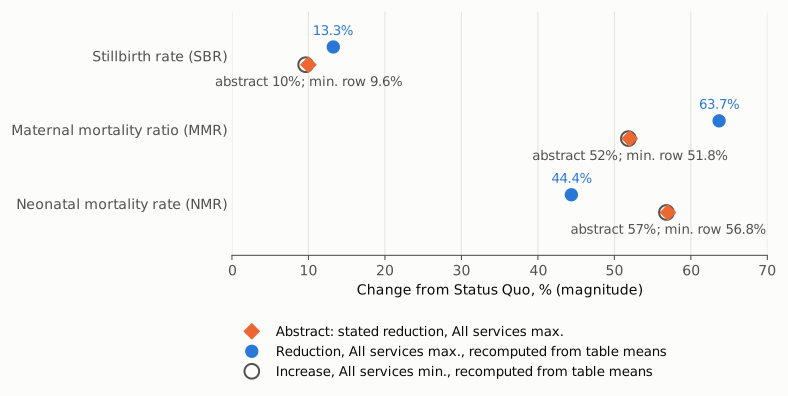
Figure 2. Magnitude of the change from the Status Quo for each mortality rate, on one linear axis starting at zero. Orange diamonds: the reductions stated in the abstract for All services max. Blue dots: the reductions for All services max. recomputed from the tabulated means. Open gray rings: the increases for All services min. recomputed from the tabulated means. For every outcome the orange diamond sits on the gray ring and away from the blue dot, and the order of MMR and NMR is reversed between the abstract and the tables.
Why it matters
The abstract sentence is the only place in the abstract that quantifies the paper's headline scenario, and readers who see only the abstract (or databases and summaries that reuse it) receive three wrong magnitudes. The maternal mortality reduction is understated (52% instead of about 64%), the stillbirth reduction is understated (10% instead of about 14%), and the neonatal mortality reduction is overstated (57% instead of about 44%). The abstract therefore also implies that neonatal mortality is the outcome most reduced by maximising services, whereas the paper's results show maternal mortality falls most. In a paper intended to inform investment in maternal and newborn health, which outcome responds most strongly is itself a policy-relevant result.
The error is confined to the abstract. The direction of every effect, its statistical significance in the tables, and the qualitative conclusion that maximising coverage and quality of all services together gives the largest reductions all stand. The findings that coverage without quality improvement has little effect, and the statements about the SDG 3.1 and 3.2 targets, rest on the tabulated rates and are not affected.
Explanations considered
- Rounding. This does not account for the numbers. Over every unrounded value that prints as the displayed means, the All services max. reductions range from 12.7% to 13.8% (SBR), are 63.7% (MMR), and range from 43.9% to 44.8% (NMR). None can round to 10%, 52% or 57%.
- A different outcome measure (total deaths or DALYs instead of rates). This does not account for the numbers. For All services max. the total-count reductions are 13.3%, 63.6% and 44.0%, and the DALY reductions are 67.2% (maternal) and 44.4% (neonatal).
- A different comparator or denominator. This does not account for the numbers. All services max. relative to All services min. gives reductions of 20.9%, 76.1% and 64.5%. The SQ relative to All services min., with the no-services scenario as denominator, gives 8.8%, 34.1% and 36.2%.
- A single-service scenario. This does not account for the numbers. The largest single-service reductions are IP max. for SBR (9.7%) and NMR (28.8%) and PN max. for MMR (42.0%); no single scenario gives 10 / 52 / 57, and the 57% NMR figure is larger than any single-service NMR reduction in Table 4.
- The All services min. vs SQ comparison. This accounts for all three numbers. The printed percentages 9.6%, 51.8% and 57.0% (and the recomputed 9.6%, 51.8% and 56.8%) round to 10%, 52% and 57%, and the total-count column gives the same rounded triplet. The Results text itself describes the MMR figure for that comparison as "a 52% difference from the scenario All services min.". These are increases in mortality when services are removed, measured relative to SQ, not reductions achieved by maximising services.
- A conversion or typesetting error in the archived text. This is excluded. The publisher's HTML carries the same abstract sentence, and the publisher's table pages match the PMC tables cell for cell (see Status).
- A later version or correction that resolves it. This is excluded; none was found (see Status).
Status
- Version of record. The publisher's article page (nature.com/articles/s41467-025-59060-2, dateModified 2025-04-25, re-fetched on 2026-10-24) carries the abstract sentence with "a 10%, 52% and 57% reduction respectively". The page's JSON-LD and meta descriptions repeat it, and so does the Europe PMC full-text XML. In the version-of-record check, the publisher's Table 2, 3 and 4 pages and the Results and Discussion wording matched the PMC text cell for cell. Every quotation above was confirmed verbatim against the PMC-archived text with
src/show.py. - Supplements and history. The four electronic supplementary files were searched: the supplementary information (model documentation, parameters and costs), the peer review file and a short reporting document. None restates the headline percentages in a way that explains the abstract. The peer review file shows that the all-services maximisation and removal scenarios were added during review, together with updates to the abstract. The earlier preprint (Research Square, doi:10.21203/rs.3.rs-3937439/v1) has a different abstract that predates those scenarios. The 40.4 GB model archive on Zenodo (doi:10.5281/zenodo.14976918) was not opened; it is not needed, because the published tables settle the comparison.
- Corrections and comments. As of 2026-10-24 there is no correction, erratum, expression of concern or retraction. Crossref lists no update relations for the DOI, PMC and Europe PMC list no correction notices, and the publisher's page shows none. A web search found no correction or public comment. PubPeer's search page and API refused automated access (HTTP 403), so PubPeer could not be checked directly.
- Sources. PMC article PMC12032021; publisher HTML and table pages at nature.com; Europe PMC full-text XML; Crossref; publisher electronic supplementary material; Research Square preprint; Zenodo record metadata.
Suggested correction
- Replace the abstract's "(a 10%, 52% and 57% reduction respectively)" with the values the paper's tables report for All services max. versus the Status Quo: approximately 14%, 64% and 44% (Table 3: −13.6%; Table 2: −63.7%; Table 4: −44.2%) for the stillbirth, maternal and neonatal mortality rates.
- If the authors wish to keep the no-services comparison in the abstract, present it as a separate statement of what current service delivery averts (mortality rates about 10%, 52% and 57% higher without services, relative to SQ), labelled as such.
- Minor: in Table 3, check the All services min. SBR mean difference and CI, "1.9 (1.3, 1.9)", against the printed levels (18.2 − 16.6 = 1.6) and the printed 9.6%.