← Back to the plain-language case
Primary-endpoint confidence interval matches 13 of 16 responders, not the 11 reported
Clin Cancer Res (2025) · doi:10.1158/1078-0432.CCR-24-3528 · PMC11995005
Summary
The paper reports its primary endpoint, objective response rate (ORR), as 68.8% (11 of 16 patients) with a 95% CI of 54.3–95.9, and the disease control rate (DCR) as 87.5% (14 of 16) with a 95% CI of 69.7–99.8. The point estimates agree with the best-response counts in Table 2. The intervals do not: the exact (Clopper–Pearson) 95% CI for 11/16 is 41.3–89.0 and for 14/16 is 61.7–98.4. The printed intervals are instead the exact intervals for 13/16 and 15/16, to the last printed digit, and Table 2 prints 13 in the ORR count cell beside the 68.75% that 11/16 gives. The point estimate is unaffected, but the stated lower bound of the primary endpoint is 13 points too high: the correct lower bound sits 1.3 points above the 40% level the design treats as a lack of activity, not 14.3 points above it.
What the paper reports
Results, "Clinical outcomes", first paragraph:
All patients had measurable lesions, and the ORR (primary endpoint) was 68.8% [11 of 16 patients; 95% confidence interval (CI), 54.3–95.9], with a DCR of 87.5% (14 of 16 patients; 95% CI, 69.7–99.8; Fig. 2B; Table 2).
Table 2, "Clinical activity of pembrolizumab plus trastuzumab and chemotherapy in patients with HER2-positive gastric cancer" (columns: Numbers | %, N = 16):
Best response Numbers % CR — — PR 11 68.75 SD 3 18.75 PD 2 12.5 ORRa (95% CI) 13 68.75 (54.3–95.9) DCRb (95% CI) 14 87.50 (69.7–99.8)
Table 2 footnotes define ORR as CR or PR and DCR as CR, PR or SD as best overall response.
Patients and Methods, "Response evaluation":
The ORR was defined as the percentage of patients who achieved a CR or PR among all patients.
Patients and Methods, "Statistical analysis":
A single-stage study design was used to determine the sample size based on the hypothesis that an observed ORR <40% suggests a lack of activity and an improvement in the ORR to ≥60% is of clinical interest.
Other places that give the responder count. Results, "Clinical outcomes":
The 11 patients who achieved PR (responders) had longer PFS (log-rank test, 12.1 vs. 4.0 months, P < 0.01)
Eleven (84.6%) of thirteen patients who had PD-L1+ tumors were responders, whereas all patients with PD-L1– (N = 3, 100%) were nonresponders (Fig. 2E).
Abstract, Results:
Sixteen patients were enrolled. The objective response rate was 69%, and the median progression-free survival was 11.9 months.
What the paper's own numbers show
Method. The inputs are the best-response counts in Table 2 (CR 0, PR 11, SD 3, PD 2; N = 16) and the ORR and DCR definitions in Methods and the Table 2 footnotes. The paper names no CI method; neither do the Methods or the trial protocol in the supplement. I therefore computed seven standard two-sided 95% binomial intervals (Clopper–Pearson exact, Wilson, Wilson with continuity correction, Wald, Agresti–Coull, Jeffreys and mid-p) for the stated counts. To find what the printed intervals correspond to, I searched every count x of every n from 5 to 40, with all seven methods at 95% and 90% confidence, for an interval within 0.15 percentage points of both printed bounds. Every number below is printed by recompute.py.txt.
| Quantity | Location | Reported | Recomputed from the paper's own numbers |
|---|---|---|---|
| Best-response counts | Table 2 | CR 0, PR 11, SD 3, PD 2 | sum to 16; 68.75%, 18.75%, 12.50% (agree) |
| ORR point estimate | Results; Table 2 | 68.8% (11 of 16); 68.75 | (0 + 11)/16 = 68.75% (agrees) |
| ORR count | Table 2, ORR row | 13 | 11 (CR + PR); 13/16 would be 81.25% |
| Responders, by PD-L1 status | Results | 11 of 13 PD-L1+; 0 of 3 PD-L1− | 11 + 0 = 11 of 16 (agrees with 11) |
| ORR 95% CI | Results; Table 2 | 54.3–95.9 | 41.3–89.0 (exact, 11/16) |
| ORR 95% CI, other methods | — | — | Wilson 44.4–85.8; Wilson-cc 41.5–87.9; Wald 46.0–91.5; Agresti–Coull 44.2–86.1; Jeffreys 44.4–86.9; mid-p 43.7–87.5 |
| Exact 95% CI for 13/16 | — | — | 54.354–95.953; truncated to one decimal, 54.3–95.9 |
| DCR point estimate | Results; Table 2 | 87.5% (14 of 16); 87.50 | (0 + 11 + 3)/16 = 87.50% (agrees) |
| DCR 95% CI | Results; Table 2 | 69.7–99.8 | 61.7–98.4 (exact, 14/16) |
| Exact 95% CI for 15/16 | — | — | 69.768–99.842; truncated to one decimal, 69.7–99.8 |
| Intervals in the search that match the printed ORR CI | — | — | 1: exact 95%, 13/16 |
| Intervals in the search that match the printed DCR CI | — | — | 1: exact 95%, 15/16 |
| Midpoint of the printed ORR CI | Results | — | 75.1%, vs a point estimate of 68.75% |
| Exact lower bound for ORR minus 40% | — | 54.3 − 40 = 14.3 pp | 41.3 − 40 = 1.3 pp |
| One-sided exact binomial test, 11/16 vs 0.40 | — | not reported | P = 0.019 |
None of the seven methods gives an interval near 54.3–95.9 for 11 of 16, or near 69.7–99.8 for 14 of 16. Every method puts the ORR lower bound between 41.3% and 46.0%. The exact interval for 13/16 reproduces the printed ORR interval, and the exact interval for 15/16 reproduces the printed DCR interval. Both match when the bounds are truncated to one decimal, as the paper appears to do. Under the same truncation the correct intervals would read 41.3–88.9 and 61.6–98.4; rounded, they read 41.3–89.0 and 61.7–98.4.
Figure
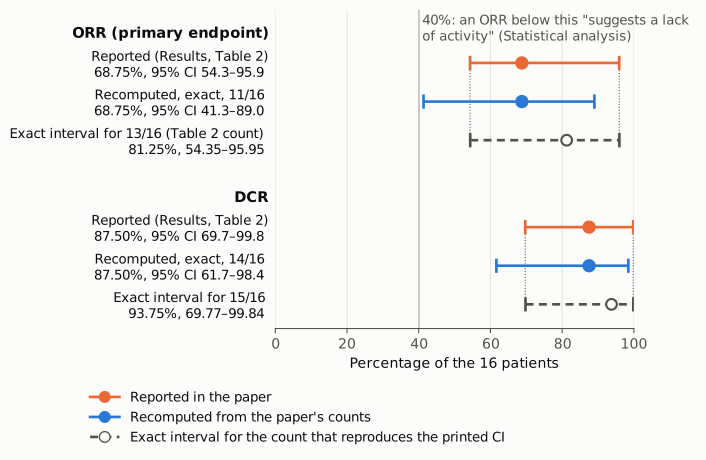
Figure 1. ORR (top) and DCR (bottom) for the 16 patients, as percentages on one axis from 0 to 100. Orange: point estimate and 95% CI as printed in the Results and Table 2. Blue: the exact (Clopper–Pearson) 95% CI recomputed from the paper's own counts, 11/16 for ORR and 14/16 for DCR, with the same point estimates. Grey, dashed, open circle: the exact 95% CI for 13/16 (the count printed in Table 2's ORR row) and for 15/16; the dotted verticals show that these coincide with the printed intervals. The thin vertical line at 40% is the ORR level that the design's Statistical analysis section says "suggests a lack of activity". All blue and grey values come from recompute.py.txt.
Why it matters
- It is the primary endpoint. The ORR is the trial's stated primary endpoint, and the interval is the only measure of its precision in the paper. A reader of the Results or Table 2 is told that the response rate is at least 54.3% with 95% confidence. The paper's own counts support a lower bound of 41.3%.
- The margin over the design threshold shrinks from 14.3 to 1.3 points. The design treats an ORR below 40% as a lack of activity and an ORR of 60% or more as of clinical interest. The printed interval lies entirely above 54%. The correct interval, 41.3–89.0, still excludes 40% (one-sided exact P = 0.019 against 0.40), so the reading that the regimen is active does not reverse. But the interval also takes in most of the 40–60% band between "lack of activity" and "of clinical interest", which the printed interval does not.
- The interval's upward shift is carried into the table. Table 2 prints 13 as the ORR count. Anyone extracting the table for a pooled analysis or a comparison with KEYNOTE-811 could take 13 responders (81%) instead of 11 (69%).
- What is not affected. The point estimates (ORR 68.8%, DCR 87.5%), the abstract (which gives ORR 69% with no interval), the survival results and the paper's translational and biomarker findings do not depend on these intervals.
Explanations considered
- A different CI method. Not able to account for it. Seven standard methods at 95% give ORR intervals for 11/16 whose lower bounds lie between 41.3% and 46.0%, and none of them comes near 54.3–95.9. A 90% interval does not match either (exact 90% for 11/16: 45.2–86.8). In the search over all counts, n up to 40, seven methods and two confidence levels, the only interval that matches is the exact 95% interval for 13/16. The same holds for the DCR interval and 15/16.
- A different denominator or population. Not supported. The ORR is defined over all patients, the text says "11 of 16 patients", and all 16 had measurable lesions. The number of PD-L1+ patients is also 13, but the paper attributes the interval to the whole cohort, and the exact interval for the PD-L1+ subgroup (11 of 13) is 54.6–98.1, which does not match.
- A different responder definition, such as target-lesion response. Not supported. The paper defines ORR by RECIST best overall response (CR or PR). Table 2 lists 11 PR and no CR, and the text names 11 responders in three places. In any case, a numerator of 13 would make the point estimate 81.25%, not the printed 68.75%, so the printed estimate and interval could not both refer to it.
- A misprint in a single number. Not able to explain it. Both bounds of both intervals match the exact intervals for other counts to the last printed digit. A misprint would not be expected to produce two internally consistent exact intervals. Table 2's ORR count cell shows the same 13.
- A conversion or typesetting artifact. Not possible here. The Europe PMC full-text XML deposited by the publisher for the version of record carries the same text and the same Table 2 cells, including the 13.
- A correction already issued. None found (see Status).
- Unexplained difference between ORR and DCR. The ORR interval corresponds to a count two higher than reported (13 vs 11) and the DCR interval to a count one higher (15 vs 14). The paper gives no information on how the intervals were computed, so the reason the two differ cannot be determined from the article.
Status
- Version of record. The publisher's article page (aacrjournals.org, reached through the DOI) and its PDF returned HTTP 403 to automated requests. I checked the Europe PMC full-text XML instead. This is the publisher-deposited JATS of the final article, Clin Cancer Res 31(8):1476–1490. Its Results sentence and Table 2 cells, including the ORR count of 13, are the same as in the PMC archive. Every quotation above was checked verbatim against the PMC-archived text with
src/show.py. - Supplements. I downloaded all supplementary files from Europe PMC: Supplementary Figures S1–S7, Tables S1–S5 and Trial Protocol S1 (74 pages). These match the 13 supplementary items registered in Crossref. Protocol section 11.1.1.1 states that ORR "was calculated with two-sided 95% confidence intervals for the overall population" and defines it as (CR + PR) over the ITT population. It names no CI method. No supplement gives a different responder count or a method that would yield 54.3–95.9 from 11 of 16.
- Corrections and comments. As of 2026-10-24 I found no correction, erratum, retraction or expression of concern.
src/known.pyreturns no Crossref update relations, no PMC notices and no Europe PMC notices. The Crossref record has no update-to or updated-by relation. The Europe PMC search service returned HTTP 503 when I tried to repeat the check on 2026-10-24. PubPeer's search page returned HTTP 403 and its publications API returned 404 for this DOI. A web search for the title together with "PubPeer" found no thread for this article. - Sources. PMC article PMC11995005; Europe PMC full-text XML and supplementary files for PMC11995005; Crossref; PubPeer; https://doi.org/10.1158/1078-0432.CCR-24-3528.
Suggested correction
In the Results ("Clinical outcomes"), replace
68.8% [11 of 16 patients; 95% confidence interval (CI), 54.3–95.9], with a DCR of 87.5% (14 of 16 patients; 95% CI, 69.7–99.8
with
68.8% [11 of 16 patients; 95% confidence interval (CI), 41.3–89.0], with a DCR of 87.5% (14 of 16 patients; 95% CI, 61.7–98.4
In Table 2, change the ORR row to "11 | 68.75 (41.3–89.0)" and the DCR row to "14 | 87.50 (61.7–98.4)". These are exact Clopper–Pearson intervals, rounded. If the authors used a different method, the intervals should be recomputed from 11/16 and 14/16 with that method and the method stated in the Statistical analysis section. The authors may also wish to add a sentence noting that the corrected ORR interval excludes the 40% inactivity level only narrowly.