← Back to the plain-language case
Sensitivity and specificity are interchanged in Tables 1 and 3 and the headline accuracy claim
Lancet Microbe (2025) · doi:10.1016/j.lanmic.2024.100987 · PMC11959112
Summary
The Abstract, Results and Discussion state that the eight-antigen MpoxPlex positivity score separates positive from presumed-negative sera "with 98% sensitivity and 95% specificity". Table 3, the source of those figures, has 63 positive and 435 negative samples. The printed "sensitivity" for the eight-antigen row, 98·39%, is exactly 428/435, and no fraction over 63 equals it. The printed "specificity", 95·24%, is exactly 60/63, and no fraction over 435 equals it. Applying the paper's own cutoffs to the authors' deposited per-sample data gives 60 of 63 positives detected and 428 of 435 negatives correctly negative. So the headline result is 95·2% sensitivity and 98·4% specificity, the reverse of what is printed. The same swap affects every row of Table 1 (12 antigens) and every row of Table 3 (12 antigen combinations). The paper's discrimination (AUC 0·987) and its choice of antigens are unaffected. What changes is the error profile readers are told to expect: the assay misses about 1 positive in 21, not 1 in 62, and gives a false positive in about 1 in 62 negatives, not 1 in 21.
What the paper reports
Abstract, Findings:
Using the results from a combination of eight antigens, we were able to distinguish samples as either post-vaccination or post-infection from negative samples with a sensitivity of 98% and a specificity of 95%.
Results, positivity-score paragraph:
The AUC for this combination was 0·987 (p<0·0001) and using a cutoff sample positivity score of five out of eight antigens could distinguish positive from presumed negative samples with 98% sensitivity and 95% specificity.
Discussion, first paragraph:
The combined results from eight of these antigens (MPXV antigens E8, B6, B2, M1, A35, and H3 and VACV antigens B5 and A33) were able to distinguish positive samples, either after vaccination or infection, from presumed negative samples with 98% sensitivity and 95% specificity.
Table 3 caption, column headings, and the Top 8 and Top 12 rows:
Summary characteristics of ROC curves and positivity score cutoffs generated by comparing the positivity scores of all positive samples (n=63) and all negative samples (n=435) to 12 MPXV and VACV antigens by ROC
| AUCs (95% CI) | Cutoff (positivity score) | Sensitivity (95% CI) | Specificity (95% CI)
Top 12 | 0·980 (0·954–1·00) | ≥5 | 95·17% (92·73–96·82) | 98·41% (91·54–99·92)
Top 8 | 0·987 (0·965–1·00) | ≥5 | 98·39% (96·72–99·22) | 95·24% (86·91–98·70)
Table 1 caption and first row (same column headings as Table 3):
Summary of ROC curves and MFI cutoffs for presumed negative samples (n=63) vs positive samples (n=435) to 12 MPXV and VACV antigens by ROC analysis
VACV antigen B5 | 0·980 (0·959–1·00) | >87·41 | 94·94% (92·46–96·64) | 95·24% (86·91–98·7)
Figure 1 legend, giving the group sizes:
There were 435 presumed negative samples, 24 post-MPXV infection samples, and 39 post-Imvanex vaccination samples (14–157 days after the second dose).
Methods (Study design) give the negative groups as 224 paediatric sera, 52 + 34 + 44 + 63 confounder sera (cytomegalovirus, Epstein–Barr virus, varicella zoster virus, rheumatoid factor) and 18 pre-vaccination sera. Data sharing statement:
Data will be made available on request or on Dec 18, 2024, at https.doi.org/10.17632/j4xdjfxskk.2.
What the paper's own numbers show
Method. Sensitivity is the share of positive samples (here 24 infected + 39 vaccinated = 63) that test positive. Specificity is the share of presumed negatives (224 + 52 + 34 + 44 + 63 + 18 = 435) that test negative. For each of the 48 percentages in Tables 1 and 3, I found every whole-number fraction k/63 and k/435 that rounds to the printed two-decimal value. I also compared the Wilson 95% interval of that fraction with the printed interval. Each printed value is matched by exactly one of the two denominators, so the denominator shows which group a column was computed on. As an independent check, I downloaded the per-sample MFIs that the authors deposited at Mendeley Data (doi:10.17632/j4xdjfxskk.2). I applied the paper's Table 1 MFI cutoffs and its Table 3 positivity-score cutoffs and counted true positives among the 63 positives and true negatives among the 435 negatives. The 39 vaccinee samples that reproduce the paper's counts are those taken 14, 43, 63, 84 and 122 days after dose two (8 + 10 + 7 + 7 + 7). The script reads only the group label and the 12 MFI columns. recompute.py.txt prints every number below.
| Quantity | Location | Reported | Recomputed from the paper's numbers |
|---|---|---|---|
| Positives / negatives | Methods; Figure 1 legend; Table 3 caption | 24 + 39; 435 | 63 positives; 224+52+34+44+63+18 = 435 negatives |
| Top 8 "Sensitivity" | Table 3; Abstract, Results, Discussion ("98%") | 98·39% (96·72–99·22) | 428/435 = 98·39%, Wilson 96·72–99·22 (exact match). Attainable values over 63 are 61/63 = 96·83% and 62/63 = 98·41%, so 98·39% cannot be a rate among the positives |
| Top 8 "Specificity" | Table 3; Abstract, Results, Discussion ("95%") | 95·24% (86·91–98·70) | 60/63 = 95·24%, Wilson lower bound 86·91 (match). Attainable values over 435 are 414/435 = 95·17% and 415/435 = 95·40%, so 95·24% cannot be a rate among the negatives |
| Top 8, from deposited MFIs (score ≥5 of 8) | data deposit | — | TP 60, FN 3, TN 428, FP 7: sensitivity 60/63 = 95·24%, specificity 428/435 = 98·39% |
| Top 12 "Sensitivity" / "Specificity" | Table 3 | 95·17% / 98·41% | 414/435 (Wilson 92·73–96·82, exact) / 62/63 (Wilson lower 91·54, exact). Deposit: TP 62/63, TN 414/435 |
| Top 4 "Sensitivity" / "Specificity" | Table 3 | 99·77% / 95·24% | 434/435 / 60/63. Deposit: TP 60/63, TN 434/435 |
| All 12 Table 3 rows | Table 3 | "Sensitivity" 94·94–99·77%; "Specificity" 95·24–98·41% | every "Sensitivity" equals TN/435 and every "Specificity" equals TP/63, from the denominators (12/12) and from the deposit (12/12) |
| All 12 Table 1 antigens | Table 1 | e.g. VACV B5: 94·94% / 95·24% | every "Sensitivity" equals TN/435 and every "Specificity" equals TP/63, from the denominators and from the deposit (12/12). VACV B5: TN 413/435, TP 60/63 |
| Table 1 group sizes | Table 1 caption | "presumed negative samples (n=63) vs positive samples (n=435)" | negatives n=435, positives n=63 (also swapped) |
| MPXV A27, infection vs all others | Table 2; Abstract ("88%", "97%") | 87·5% (69·00–95·66) / 96·84% (94·84–98·07) | 21/24 and 459/474, Wilson intervals exact; deposit gives 21/24 and 459/474. Correctly labelled |
| AUC, Top 8 score | Table 3 | 0·987 | 0·9865 from the deposit. The AUC does not depend on the labels |
The printed confidence intervals use the Wilson score method for every lower bound. Some upper bounds of proportions close to 100% are slightly wider than Wilson (for 60/63 the printed upper bound is 98·70, Wilson gives 98·37). This affects neither the point estimates nor the denominator they imply.
Figure
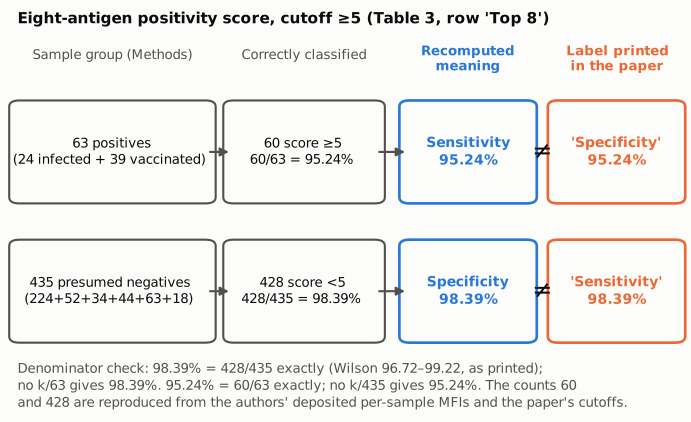
Figure 1. Where the two headline percentages come from. Of the 63 positive samples (24 after infection, 39 after vaccination), 60 have an eight-antigen positivity score of 5 or more: 60/63 = 95·24%, the sensitivity. Of the 435 presumed negatives, 428 score below 5: 428/435 = 98·39%, the specificity. Table 3, the Abstract, the Results and the Discussion print 95·24% as specificity and 98·39% as sensitivity. Blue boxes: values recomputed from the paper's group sizes and confirmed with the deposited per-sample data. Orange boxes: labels as printed in Table 3.
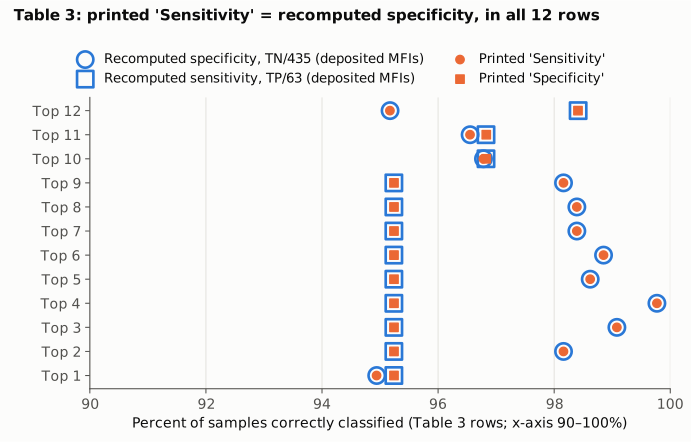
Figure 2. The swap is systematic. For each Table 3 row (antigen combinations Top 12 to Top 1), orange markers are the printed "Sensitivity" (dot) and "Specificity" (square). Blue open markers are values recomputed from the authors' deposited MFIs with the paper's cutoffs: specificity, TN/435 (ring), and sensitivity, TP/63 (open square). In all 12 rows the printed "Sensitivity" sits inside the recomputed specificity ring, and the printed "Specificity" sits inside the recomputed sensitivity square. The x-axis runs from 90% to 100% because every value lies in that range.
Why it matters
This is the paper's primary diagnostic-accuracy result. It is the first quantitative finding in the Abstract and is restated in the Results and Discussion, and accuracy studies of this kind are cited mainly for these two numbers. As printed, the figures tell readers that the eight-antigen score misses about 1.6% of positive sera (1 in 62) and wrongly flags about 4.8% of negative sera (1 in 21). The data show the opposite: 3 of 63 positives were missed (4.8%) and 7 of 435 negatives were flagged (1.6%). The two uses the paper proposes for the assay depend on these numbers in different ways. For serosurveillance in a low-prevalence population, specificity sets the false-positive burden and the positive predictive value, and the assay performs better there than reported. For confirming past infection or vaccination in an individual, sensitivity matters more, and the assay performs worse there than reported. The swap also changes the per-antigen trade-offs in Table 1. MPXV A27 and VACV A27, for example, are printed as about 86% sensitive and about 45% specific in the all-positives comparison, but are in fact about 45% sensitive and about 86% specific. Sensitivity is also the less precisely estimated of the two numbers (63 positives versus 435 negatives), so the wider of the two printed intervals belongs to it and not to specificity.
The main conclusions survive. Both corrected values are at least 95%, the AUC and the antigen ranking do not depend on the labels, and the cutoffs were chosen to maximise the sum of sensitivity and specificity, which is the same whichever way the two are labelled. The infection-versus-vaccination result for MPXV A27 (Table 2, Abstract: 88% sensitivity, 97% specificity) is labelled correctly. The medRxiv preprint (doi:10.1101/2024.06.03.24308186, v1, 4 June 2024) gives the same reversed values in its abstract ("a sensitivity of 98.39% ... and specificity of 95.24%"), so they may already have been repeated in work citing either version.
Explanations considered
- The paper uses a non-standard definition, with negative sera as the target condition. This does not fit. The paper defines positives as post-infection or post-vaccination sera throughout. The Abstract says the assay distinguishes "post-vaccination or post-infection from negative samples", and Table 2 uses the standard orientation (sensitivity on the 24 infected sera). Under a negatives-as-target reading, Table 2's labels would be reversed instead, and the Abstract would still be describing detection of positives.
- The labels are right and the denominators are what was swapped. That would mean 98·39% is a rate among the 63 positives, but no k/63 equals 98·39% (62/63 = 98·41%). It would also mean 95·24% is a rate among the 435 negatives, but no k/435 equals 95·24%. The Wilson intervals match only the swapped denominators. Read literally, the printed "sensitivity" counts 428 of 435 negatives as test-positive, a 98% false-positive rate, which an AUC of 0·987 rules out.
- Rounding, or a different CI method. Neither explains it. Each point estimate is matched to two decimals by exactly one denominator, and the Wilson lower bounds match exactly. The only CI difference (some upper bounds slightly wider than Wilson) is too small to bear on which denominator was used.
- A different analysis population. The deposited data rule this out. With the 24 infected sera, the 39 vaccinee sera taken 14–122 days after dose two and the 435 negatives, the paper's cutoffs reproduce every one of the 48 Table 1 and Table 3 percentages exactly, once the labels are swapped.
- A conversion artifact in PMC. Excluded. The publisher's typeset PDF shows the same column order, values, Table 1 caption and Abstract wording as the PMC and Europe PMC XML.
Status
- Version of record. Checked against the publisher's typeset PDF (Lancet Microbe vol 6, April 2025, article 100987; published online 17 January 2025), using the copy in the University of Aberdeen repository (AURA), because thelancet.com returned HTTP 403 in this session. Also checked against the Europe PMC full-text XML. The Abstract, Results and Discussion sentences, Table 3's column order and values, and the Table 1 caption are identical in all of them. Every quote above was confirmed verbatim against the PMC-archived text.
- Supplements and data. The supplementary appendix (mmc1.pdf) holds ROC curves (Figure S1), ELISA correlations (Figure S2), sample counts (Table S1, confirming 435 negatives and 24 infection sera) and geometric mean MFIs (Table S2). It has no contingency counts. The authors' data deposit (Mendeley Data, doi:10.17632/j4xdjfxskk.2, "Raw Data.ods") holds per-sample MFIs, and these settle the labelling, as shown above. The deposit also contains dates of birth and sex. Those columns were not read or used.
- A separate, minor inconsistency. The Figure 1 legend, the Table 2 caption and the Methods describe the 39 vaccinee samples as taken 14–157 days after the second dose. The Methods' own timepoint counts for 14–157 days add up to 8 + 10 + 7 + 7 + 7 + 7 = 46. The 39 samples that reproduce the tables are the 14–122 day samples, which is closer to the supplement's description of these samples as "14 to 144 days" after two doses.
- Corrections. No correction, erratum, retraction or expression of concern was found in Crossref or PMC (checked 2026-10-24).
- Comments. PubPeer's search page returned a Cloudflare challenge and its API returned HTTP 404 in this session, so PubPeer could not be searched directly. A web search for the assay name together with PubPeer, sensitivity and specificity found no comment raising this issue.
- Sources. PMC11959112; Europe PMC full text and supplementary files; AURA repository copy of the version of record; Mendeley Data doi:10.17632/j4xdjfxskk.2 (version 2); medRxiv doi:10.1101/2024.06.03.24308186 (via the bioRxiv/medRxiv API); Crossref. As of 2026-10-24.
Suggested correction
- Abstract (Findings), Results and Discussion: replace "a sensitivity of 98% and a specificity of 95%" and "98% sensitivity and 95% specificity" with "a sensitivity of 95% and a specificity of 98%" (60/63 = 95·24%; 428/435 = 98·39%).
- Table 3: swap the contents of the Sensitivity and Specificity columns in all 12 rows, carrying each confidence interval with its estimate. For Top 8, for example: sensitivity 95·24% (86·91–98·70), specificity 98·39% (96·72–99·22).
- Table 1: make the same column swap for all 12 antigens, and correct the caption to "presumed negative samples (n=435) vs positive samples (n=63)".
- Optionally, align the stated vaccinee window for the 39 samples (14–157 days in the Methods, Figure 1 legend and Table 2 caption) with the samples actually analysed.