← Back to the plain-language case
Reported complete-abortion risk ratio of 2.55 should be about 1.02 by the paper's own conversion
BMJ Glob Health (2025) · doi:10.1136/bmjgh-2024-016024 · PMC11749663
Summary
For complete abortion in the review's only task-shifting trial (midlevel providers vs doctors, 1032 participants), the Abstract, the Results text and Table 2 all report a risk ratio (RR) of 2.55 (95% CI 0.82 to 4.27), described as "equivalent" or "little or no difference". The same Table 2 row gives risks of 96.1% and 97.3% and an adjusted risk difference (RD) of 1.49% (−0.17% to 3.14%), and its footnote § says the RR was converted from that RD with a 96% control risk; done in consistent units, that conversion gives RR 1.016 (0.998 to 1.033), whereas leaving the RD in percentage points, (0.96 + 1.49)/0.96, reproduces the published 2.55 (0.82 to 4.27) exactly. With a 96.1% control risk no RR can exceed 1/0.961 = 1.04, so the published value is impossible, and its interval is 100 times too wide on the linear scale. The verbal conclusion of no meaningful difference stands, but the first quantitative result in the Abstract misstates the size and precision of the effect, the correct value appears nowhere in the paper, and no correction has been found.
What the paper reports
Low certainty evidence indicates task shifting of medical abortion by doctors to midlevel providers may result in equivalent complete abortion (RR: 2.55, 95% CI: 0.82 to 4.27).
— Abstract, Results
Low certainty evidence indicates that compared with doctor-led medical abortion, nurse-led medical abortion may lead to little or no difference in abortion success (RR: 2.55, 95% CI: 0.82 to 4.27, one trial, 1032 participants) or the occurrence of an incomplete abortion (RR: 0.92, 95% CI: 0.45 to 1.89, one trial, 1032 participants, table 2). The certainty of evidence was downgraded by two levels due to serious imprecision (data from a single trial and CI including both benefit and harm) and serious risk of bias (no blinding of participants, personnel and outcome assessors).
— Results › Effects of interventions › Comparison 1. Who provides care (task shifting)
Patient health status: complete abortion | 96.1% | 97.3% | RR 2.55 (0.82 to 4.27)§ | 1032 (1 RCT) | Low†‡⊕⊕⊝⊝ | RD 1.49%¶ (–0.17% to 3.14%)
— Table 2 (Summary of findings 1), "complete abortion" row. Columns: outcome | assumed risk, control | corresponding risk, intervention | relative effect (95% CI) | participants | certainty | comments
§The effect in RR was converted from the adjusted risk difference provided in the report using control group risk of 96%.
— Table 2, footnote §
¶The risk difference calculated with intention-to-treat analysis estimated from a generalised estimating equation model with treatment as the fixed effect and service provider as a random effect and adjusted with woman’s age and length of gestation.
— Table 2, footnote ¶
the assumed risk in the comparison group and the relative effect of the intervention
— Table 2, footnote * (which says that the intervention-group risk is based on these two quantities)
What the paper's own numbers show
Method. Footnote § describes the conversion. If the control risk is p₀ and the risk difference is RD (both as proportions), the intervention risk is p₀ + RD, so RR = (p₀ + RD) / p₀. Applied to the point estimate and to each CI limit, this maps the RD interval linearly onto an RR interval. I applied it with p₀ = 0.96 (the footnote) and p₀ = 0.961 (Table 2), first with the RD as a proportion and then with the RD left as a percentage-point number. I also checked the result against the two risks in the same row of Table 2, and against the shape of the published interval. As an outside cross-check I used the counts in the source trial's abstract (Lancet 2011;377:1155-61, PMID 21458058). All numbers below are printed by recompute.py.txt.
| Quantity | Location | Reported | Recomputed |
|---|---|---|---|
| RR, complete abortion | Abstract; Results Comparison 1; Table 2 | 2.55 (0.82 to 4.27) | 1.016 (0.998 to 1.033), from footnote § with RD as a proportion (same to 3 dp with p₀ 0.96 or 0.961) |
| Same formula, RD left in percentage points | Table 2 footnote § | — | (0.96 + 1.49)/0.96 = 2.552; (0.96 − 0.17)/0.96 = 0.823; (0.96 + 3.14)/0.96 = 4.271 → 2.55 (0.82 to 4.27), an exact match to the published values |
| Intervention risk implied by the conversion | Table 2 | 97.3% | 0.96 + 0.0149 = 0.975 (correct units); 0.96 + 1.49 = 2.45, i.e. 245% (published units) |
| Ratio of the two risks in Table 2 | Table 2 | 96.1% vs 97.3% | 97.3 / 96.1 = 1.012 |
| Largest RR possible with control risk 96.1% | Table 2 | — | 1 / 0.961 = 1.041 |
| Intervention risk implied by RR 2.55 (footnote *) | Table 2 | 97.3% | 0.961 × 2.55 = 2.451 (245%) |
| Shape of the reported RR interval | Table 2 | 0.82 to 4.27 around 2.55 | Linear gaps 1.73 below, 1.72 above (symmetric on the linear scale); log gaps 1.135 vs 0.516. RR width / RD width = 1.042 ≈ 1/0.96 = 1.042, i.e. a linear rescaling of the RD interval by 1/0.96 |
| Width of the published interval relative to the recomputed one | Table 2 | 0.82 to 4.27 | 100 times wider on the linear scale; 48.6 times wider on the log scale |
| Adjusted RD, complete abortion | Table 2 comments | 1.49% (−0.17% to 3.14%) | Not reproducible from counts (GEE-adjusted, footnote ¶); taken as given. Unadjusted from trial counts: 1.19% (−0.99% to 3.37%); trial abstract: 1.24% (−0.53 to 3.02) |
| Unadjusted RR, complete abortion (outside check) | Source trial abstract: 504/518 vs 494/514 | — | 1.012 (0.990 to 1.035) |
| RR, incomplete abortion (control check) | Results; Table 2 row 2 | 0.92 (0.45 to 1.89) | 14/518 vs 15/514: 0.926 (0.45 to 1.90), consistent |
The adjacent incomplete-abortion RR is reproduced from the trial's counts. This shows that the rest of the row's arithmetic holds, and that the discrepancy is confined to the RD-to-RR conversion.
Figure
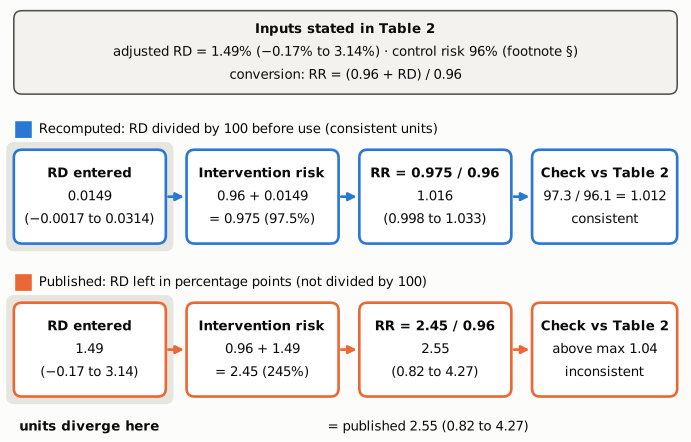
Figure 1. The conversion described in Table 2 footnote §, from the inputs stated in Table 2 to the risk ratio. The two lanes differ only at the first step, which is shaded: whether the adjusted risk difference enters the formula as a proportion (0.0149, blue, recomputed) or as a percentage-point number (1.49, orange). The orange lane reproduces the published RR 2.55 (0.82 to 4.27) to two decimals. It does so by way of an intervention "risk" of 245%, and its result lies above 1/0.961 = 1.04, the largest RR possible with the 96.1% control risk in the same table row. The blue lane gives RR 1.016 (0.998 to 1.033), which agrees with the ratio of the tabulated risks (1.012). All values are computed in recompute.py.txt.
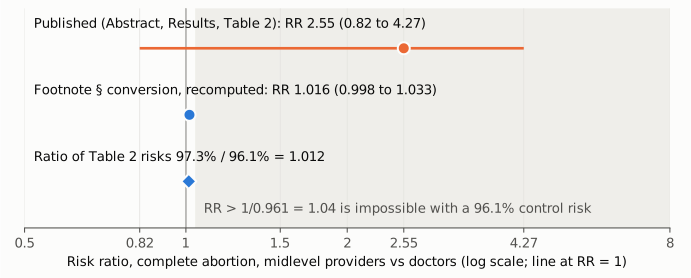
Figure 2. Risk ratio for complete abortion (midlevel providers vs doctors) on a log scale, with a thin reference line at RR = 1. Orange: the value published in the Abstract, Results and Table 2. Blue: the footnote § conversion recomputed with the RD as a proportion (its interval, 0.998 to 1.033, is narrower than the marker at this scale), and the plain ratio of the two Table 2 risks. The shaded region marks RRs above 1/0.961 = 1.04, which cannot occur when the control risk is 96.1%. The published point estimate and most of its interval lie in that region.
Why it matters
- It is the headline number for the outcome. The value appears three times: as the first quantitative result in the Abstract, in the Results text and in the summary-of-findings table. A reader who takes the RR at face value would read it as about 2.5 times the rate of complete abortion with a very wide interval. The trial data in the same row show nearly identical rates (97.3% vs 96.1%) and a tight interval (about 1.00 to 1.03).
- The number is internally contradictory. The text calls it "equivalent" / "little or no difference", which agrees with the RD but not with an RR of 2.55. Footnote * says the intervention risk is based on the control risk and the relative effect, and 96.1% × 2.55 is 245%, not 97.3%.
- It can propagate. Anyone who extracts the RR from the Abstract or Table 2 for an overview, a meta-analysis or a guideline would carry forward a ratio wrong by a factor of about 2.5, with an interval 100 times too wide on the linear scale (about 49 times on the log scale). The correct value is not stated anywhere in the paper, so a reader cannot pick it up from elsewhere in the text.
- The GRADE rationale cites the interval. The imprecision downgrade is justified as "CI including both benefit and harm" and, in footnote ‡, "wider CI". The correct interval (0.998 to 1.033) still just includes 1, so this wording is not strictly wrong, and a downgrade for a single trial may well stand. But the published interval of 0.82 to 4.27 makes the imprecision look far larger than it is.
- What does not change. The direction of the effect, the lack of statistical significance, the qualitative reading (equivalence), the low-certainty rating and the review's overall conclusions on task shifting are not affected.
Explanations considered
- A different effect measure (odds ratio, or the RR of a non-complete outcome). From the trial counts, the odds ratio for complete abortion is 1.457 (0.73 to 2.92). The RR of a non-complete abortion (doctor vs midlevel) is 1.440. Neither is 2.55 (0.82 to 4.27), and Table 2 labels the value as an RR.
- Covariate adjustment. Footnote ¶ says the RD came from a GEE model adjusted for age and gestation, which explains why the RD (1.49%) differs from the crude 1.19% to 1.24%. But no adjustment can produce a risk ratio above 1/0.961 = 1.04 when the control risk is 96.1%, and converting the adjusted RD gives 1.016.
- A different control risk. The footnote uses 96%, and Table 2 shows 96.1%. Both give RR 1.016 (0.998 to 1.033) with consistent units, and both give 2.55 (0.82 to 4.27) when the RD is not divided by 100. The choice of control risk is immaterial.
- The log-scale asymmetry is just a feature of the conversion. That is correct: an interval converted linearly from an RD interval is symmetric on the linear scale, as observed here. So the asymmetry on the log scale is not itself evidence of an error. The error is the factor of 100 in the RD, which the linear structure of the published interval confirms (its width is exactly 1/0.96 times the width of the RD interval in percentage points).
- A typesetting or XML conversion artefact. The same values appear in three separate places (Abstract, Results text, Table 2 cell) in the archived publisher XML. They all agree with each other and with an exact arithmetic reproduction, so a rendering artefact does not explain them.
- A rounding or transcription slip. A transposed digit or a rounding error would not produce three numbers (point estimate and both limits) that all match one systematic formula to two decimals.
- The supplementary material contains another calculation. Online supplemental file 1 (search strategy, study characteristics, extraction and risk-of-bias tables) and file 2 (reflexivity statement) give no further effect estimate or RR calculation for this outcome.
None of these accounts for the published numbers. The stated conversion, carried out with the RD in percentage points rather than as a proportion, reproduces them exactly.
Status
As of 2026-10-23:
- Version of record. The publisher's typeset PDF (PMC11749663.1.pdf from the PMC open-data bucket; 13 pages, "BMJ Glob Health 2025;10:e016024", created 2025-01-03) carries the same values in all three places: the Abstract, Results › Comparison 1, and the Table 2 complete-abortion row with footnote §. The minus signs in the RD interval are intact, and the Table 2 columns line up, so no cell is misplaced. The PMC and Europe PMC XML agree with the PDF. Every quote above was checked verbatim against the PMC text with
src/show.py. The publisher's HTML page (gh.bmj.com, reached from the DOI redirect) returned HTTP 403. - Supplements. I checked online supplemental file 1 (PDF, 24 pages, Tables S1–S7 and Figure S1) and file 2 (DOCX, reflexivity statement). Table S6 describes the trial (535 and 542 randomised) but gives no complete-abortion RR or RD. Neither file restates or corrects the figure.
- Corrections and notices.
src/known.pyreturned no Crossref updates, no PMC notices and no Europe PMC notices. The Crossref works record has noupdate-to,updated-byorrelationentries, and Crossrefrelation.objectandupdatesfilters on the DOI return 0 works. A Europe PMC search for the DOI returns only the original article. Earlier web searches for a correction, erratum or comment found none. The web-search quota was used up during this final check, so those searches were not repeated today. - PubPeer. The PubPeer search page and API return HTTP 403 (a Cloudflare challenge) from this machine, so PubPeer could not be checked directly. Earlier web searches found no PubPeer thread for this article.
- Sources. PMC11749663 (https://pmc.ncbi.nlm.nih.gov/articles/PMC11749663/); Crossref API (https://api.crossref.org/works/10.1136/bmjgh-2024-016024); Europe PMC REST search; source trial abstract, PubMed 21458058 (Lancet 2011;377:1155-61, doi:10.1016/S0140-6736(10)62229-5), retrieved through NCBI E-utilities.
Suggested correction
In the Abstract, in Results › Comparison 1 and in Table 2 (complete abortion row), replace "RR: 2.55, 95% CI: 0.82 to 4.27" with "RR: 1.02, 95% CI: 1.00 to 1.03". Unrounded, this is 1.016 (0.998 to 1.033), from (0.96 + RD)/0.96 with RD = 0.0149 (−0.0017 to 0.0314). If two decimals would hide the fact that the lower limit lies just below 1, report three decimals: 1.016 (0.998 to 1.033). The authors may also wish to:
- re-check the GRADE imprecision rationale for this outcome against the corrected interval, and
- check whether the same conversion step was applied elsewhere. For example, Table 3 footnote † describes an RR derived from an OR with an assumed control risk.