← Back to the plain-language case
Hypertension–knowledge p = 0.007 cannot be reproduced from Table 1; its summary statistics give p ≈ 0.59
Diabetologia (2024) · doi:10.1007/s00125-024-06304-3 · PMC11732930
Summary
The paper surveys 1050 Jordanian adults. In its Abstract, Results and Table 1 it reports that diabetes knowledge scores differ significantly by hypertension status: 46.46 ± 13.11 with hypertension (n = 72) against 47.31 ± 12.87 without (n = 978), p = 0.007. The paper's own means, SDs and group sizes do not give that result. Student's t test, which the Table 1 footer names, gives t = −0.540 and p = 0.589 (Welch p = 0.596), with a 95% CI for the difference of −3.94 to 2.24 points. The companion behaviour comparison (p = 0.017) recomputes to p = 0.794. Both are printed as significant associations. The recomputed values are clearly non-significant, so the unadjusted link between hypertension and diabetes knowledge that the Abstract lists has no support in the paper's own numbers.
What the paper reports
Significant associations were found between diabetes knowledge and the following factors: […] hypertension (46.46 ± 13.11 for present vs 47.31 ± 12.87 for absent; p=0.007)
— Abstract, Results. The bracket marks four omitted factors (age, sex, marital status, smoking status). The sentence ends with diabetes status.
Behaviour scores correlated similarly with these factors except for diabetes and smoking status.
— Abstract, Results (this sentence presents the hypertension–behaviour association as significant as well)
Non-hypertensive individuals had higher knowledge scores (47.31 ± 12.87) than those with hypertension (46.46 ± 13.11, p=0.007). Behaviour scores were also higher in non-hypertensive individuals (85.10 ± 19.90) compared with hypertensive individuals (84.46 ± 21.75, p=0.017).
— Results, second paragraph
Yes | 72 (6.86) | 46.46 ± 13.11 | 0.007 | 84.46 ± 21.75 | 0.017 No | 978 (93.14) | 47.31 ± 12.87 | | 85.10 ± 19.90 |
— Table 1, "Distribution of diabetes knowledge and behaviour scores across demographic and clinical categories", Hypertension rows. The columns are n (%), knowledge score, p value, behaviour score, p value.
based on Student’s t tests for variables with two categories and one-way ANOVA for variables with three or more categories
— Table 1 footer. The footer also says the scores are "presented as means ± SD".
Differences in knowledge and behaviour scores across categories were tested using unpaired t test for binary factors (e.g. sex or marital status) and one-way ANOVA for multi-level factors (e.g. age or BMI), with statistical significance set at p<0.05.
— Methods, "Statistical analysis"
Variables that demonstrated significant associations (p<0.05) in preliminary t tests and ANOVA were included in the regression models.
— Methods, "Statistical analysis"
Two later passages describe hypertension's adjusted effect. It points the opposite way from the unadjusted means:
Hypertension status had a significant positive coefficient (4.5346, p<0.0001), indicating higher adjusted knowledge scores among individuals with hypertension.
— Results, third paragraph (Table 2: "Hypertension | 4.5346 | 0.558 | <0.0001")
Participants with hypertension exhibited higher diabetes knowledge and behaviour scores, possibly reflecting a broader understanding of chronic disease management.
— Discussion, third paragraph
What the paper's own numbers show
Method. An unpaired two-sample t test needs only the group sizes, means and SDs, and all of them are printed in Table 1. Student's pooled-variance test (df = n₁ + n₂ − 2 = 1048) is the test that Table 1's footer names. Welch's unequal-variance test and a z test serve as sensitivity checks. For each printed p, the t statistic it requires is found from the inverse t distribution. From that follow the mean difference, the standard error and the 95% interval that the p value implies. To test whether the method recovers the paper's own reporting, the same calculation was applied to every comparison in Table 1: 20 two-group t tests, and 6 one-way ANOVAs computed from group n, mean and SD. Every number below is printed by recompute.py.txt (Python, numpy/scipy).
| Quantity | Location | Reported | Recomputed from the paper's numbers |
|---|---|---|---|
| Knowledge, mean difference (hypertension yes − no) | Abstract; Results; Table 1 | 46.46 vs 47.31 | −0.85 points |
| Knowledge, Student's t test (pooled SD 12.89, SE 1.574, df 1048) | Abstract; Results; Table 1 | p = 0.007 | t = −0.540, two-sided p = 0.589 |
| Knowledge, Welch t test (SE √(2.387 + 0.169) = 1.599, df 81.4) | sensitivity | — | t = −0.532, p = 0.596 |
| Knowledge, z test / one-sided Student p | sensitivity | — | 0.595 / 0.295 |
| Knowledge, 95% CI for the difference | derived | — | −3.94 to 2.24 points |
| Knowledge, |t| needed for p = 0.007 (df 1048) | derived | p = 0.007 | 2.702 |
| Knowledge, difference needed for p = 0.007 / p = 0.05 with the printed SDs and n | derived | 0.85 | 4.25 / 3.09 points |
| Knowledge, SE implied by a 0.85 difference with p = 0.007 | derived | — | 0.315, one-fifth of the SE the printed SDs give |
| Knowledge, common SD that p = 0.007 would need with n = 72 and 978 | derived | 13.11 and 12.87 | 2.58 |
| Knowledge, smallest p with each mean and SD moved anywhere within its rounding interval | derived | p = 0.007 | 0.585 |
| Knowledge, largest |t| reachable with 978 controls, however large the hypertensive group | derived | — | 2.07 (p = 0.039), still short of 2.70 |
| Knowledge, equal group size needed for p ≤ 0.007 | derived | 72 and 978 | 3400 per group (study total 1050) |
| Behaviour, mean difference (yes − no) | Results; Table 1 | 84.46 vs 85.10 | −0.64 points |
| Behaviour, Student's t test (SE 2.446) | Results; Table 1 | p = 0.017 | t = −0.262, p = 0.794 |
| Behaviour, Welch t test (SE 2.641, df 80.0) | sensitivity | — | t = −0.242, p = 0.809 |
| Behaviour, 95% CI for the difference | derived | — | −5.44 to 4.16 points |
| Behaviour, difference needed for p = 0.017 | derived | 0.64 | 5.85 points |
| Control: smoking, knowledge (45.78 vs 48.22, n = 452 / 598) | Abstract; Results; Table 1 | p = 0.003 | t = −3.10, p = 0.0020 |
| Control: sex, marital status (knowledge), age (both scores) | Abstract; Results; Table 1 | p < 0.0001 | 2.0 × 10⁻⁵ to 8.5 × 10⁻¹² |
| Control: education, employment and diabetes status (behaviour) | Table 1 | 0.913, 0.429, 0.294 | 0.91, 0.43, 0.29 |
| All 26 comparisons in Table 1 | Table 1 | — | 14 reproduce; 12 do not; 3 of the 12 cross p = 0.05: hypertension knowledge, hypertension behaviour, physical-activity behaviour |
| Hypertension coefficient, adjusted model | Table 2 / Table 3 | +4.5346 (SE 0.558) / +0.5410 (SE 0.133), p < 0.0001 | Opposite sign to the unadjusted −0.85 / −0.64; a separate analysis, not a source of 0.007 or 0.017 |
"Reproduce" means that a printed "<" bound holds, or that the recomputed p lies within 10% of the printed value or within one unit of its last printed digit. Many comparisons reproduce closely, among them the knowledge comparisons for four of the five other factors that the Abstract lists next to hypertension (age, sex, marital status, smoking). The fifth, diabetes status, does not reproduce: its knowledge comparison recomputes to p = 0.0052 (Welch 0.0084) against a printed "<0.001", although it remains significant at p < 0.05. So the paper's summary statistics and the stated test do recover many of its own p values. The hypertension rows are among those that do not, and they are two of the three where the recomputed value lands on the other side of the paper's p < 0.05 threshold. The other non-reproducing rows are listed in the script's output and shown in Figure 2.
Figures
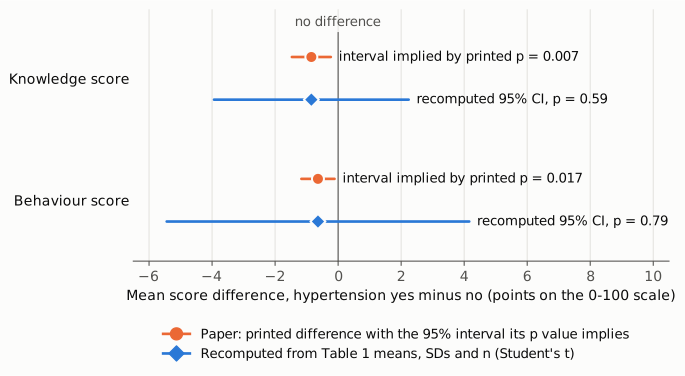
Figure 1. Mean score difference between participants with and without hypertension (yes minus no), in points on the 0–100 scale, on one axis. The thin vertical line marks no difference. Orange circles and intervals show the printed differences (−0.85 for knowledge, −0.64 for behaviour), each with the 95% interval its printed p value implies (p = 0.007: −1.47 to −0.23; p = 0.017: −1.17 to −0.11). Neither orange interval includes zero. Blue diamonds and intervals are the 95% CIs recomputed from the Table 1 SDs and group sizes with Student's t test: −3.94 to 2.24 (p = 0.59) and −5.44 to 4.16 (p = 0.79). Both blue intervals contain zero. For the printed p values to hold, the standard errors would have to be about one-fifth (knowledge) to one-ninth (behaviour) of what the printed SDs and group sizes give.
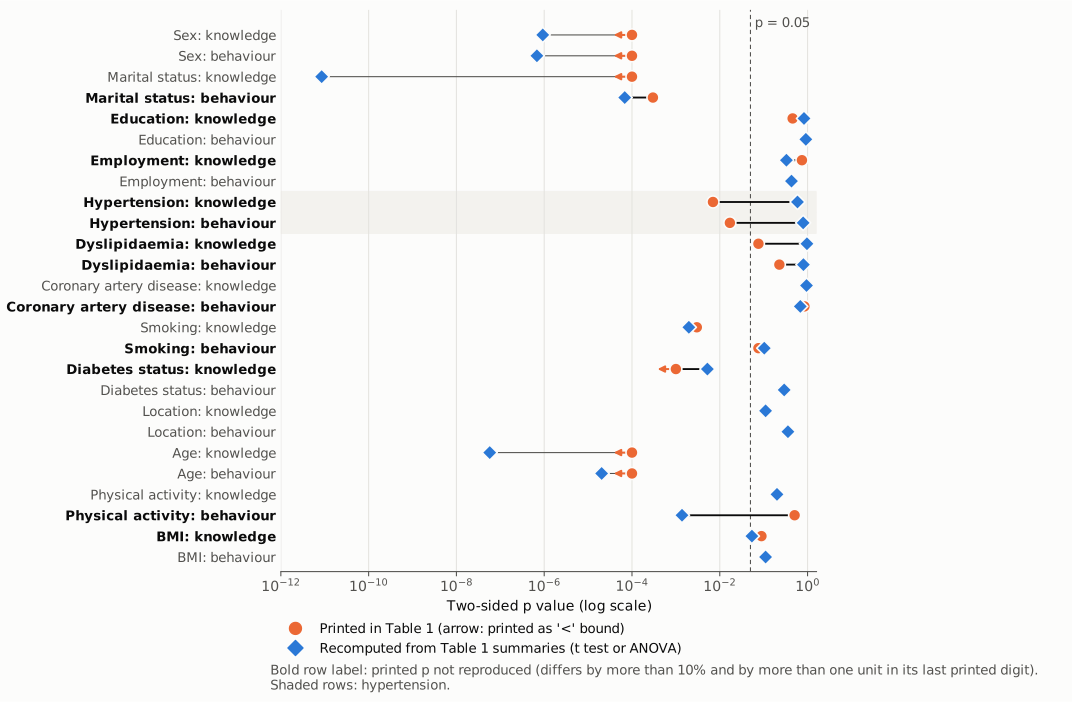
Figure 2. Two-sided p values printed in Table 1 (orange circles; an arrow marks a value printed as a "<" bound) against p values recomputed from each row's n, mean and SD (blue diamonds; Student's t for two-category variables, one-way ANOVA for three-category variables, as the Table 1 footer specifies). The dashed line marks p = 0.05. Where a printed value is reproduced, the two markers sit together (often the diamond covers the circle) and the row label is in grey. For rows printed as a "<" bound, a reproduced value can lie far to the left of the printed bound; the thin grey line then marks agreement, not a gap. Row labels in bold mark comparisons whose printed p is not reproduced. The shaded rows are the hypertension comparisons, two of the three rows whose recomputed p falls on the other side of p = 0.05 (the third is physical-activity behaviour). Many rows reproduce, including age, sex, marital status and smoking (knowledge), four of the five other factors listed in the Abstract; the fifth, diabetes status, does not reproduce (0.0052 vs printed <0.001). The method therefore recovers the paper's reporting in general. Gaps also occur in rows other than hypertension (for example dyslipidaemia and physical-activity behaviour).
Why it matters
The hypertension result is printed in the Abstract, as one of six factors with "Significant associations" with diabetes knowledge, and the Results text repeats it. The Abstract's next sentence ("Behaviour scores correlated similarly with these factors except for diabetes and smoking status") presents the behaviour association as significant too. Recomputed from the paper's own Table 1, neither comparison is significant: p = 0.59 for knowledge and p = 0.79 for behaviour. The 95% CI for the knowledge difference, −3.94 to 2.24 points, is compatible with no difference. The direction of the printed means is unchanged, with hypertensive participants about 0.85 points lower on a 0–100 scale. What changes is the conclusion that the difference is statistically detectable.
The error has two further consequences.
- Selection into the regression models. Methods state that variables significant at p < 0.05 in the preliminary t tests and ANOVA were entered into the regression models. Hypertension was also included on the strength of prior literature ("covariate adjustment was guided by previous research … hypertension [36]"), so its inclusion does not rest on the unadjusted test alone.
- The Discussion's account of hypertension. The Discussion says participants with hypertension "exhibited higher diabetes knowledge and behaviour scores". That rests on the adjusted coefficients (+4.5346 and +0.5410, both p < 0.0001). The unadjusted means point slightly the other way, and their difference is not significant. So the unadjusted comparison gives no support to the adjusted finding. A reader cannot tell from the paper how an unadjusted difference of −0.85 points becomes an adjusted +4.53 points.
The paper's central conclusions do not depend on these rows. These are the association between knowledge and behaviour (the knowledge–attitude–behaviour framing) and the differences by age and sex, which do reproduce. The error affects a secondary result that is printed in the Abstract.
A related observation, separate from the claim above: the Table 1 rows for different variables imply different overall knowledge means for the same 1050 participants. About 47.2 follows from most variables (for example sex 47.23, hypertension 47.25, smoking 47.17), but 41.33 from age, 63.09 from diabetes status and 75.98 from location. This does not change the hypertension recomputation, which uses only the hypertension rows. It does show that Table 1 has other internal inconsistencies.
Explanations considered
- Rounding of the printed means and SDs. This does not account for the numbers. Moving every mean and SD to the edge of its rounding interval gives a smallest p of 0.585. The difference would have to be 4.25 points, not 0.85, to give p = 0.007.
- A different version of the t test (Welch, z, one-sided). This does not account for the numbers. Welch gives p = 0.596, a z test 0.595 and a one-sided Student test 0.295. Methods set significance at p < 0.05 with no mention of one-sided tests.
- The ± values being standard errors rather than SDs. This does not account for the numbers, and the paper rules it out. The Table 1 footer says "means ± SD". Read as SEs, the values would make the test weaker (p = 0.96) and would imply an SD of about 111 in the hypertensive group on a 0–100 score.
- The p value coming from the adjusted model. This does not account for the numbers. Tables 2 and 3 give the hypertension coefficient as +4.5346 and +0.5410 with p < 0.0001. Those values have the opposite sign to the unadjusted differences, and their p values do not match 0.007 or 0.017. Table 1 is presented as the unadjusted comparison.
- A rank-based or other non-parametric test on the raw data. This cannot be fully excluded from summary statistics alone. However, the Table 1 footer and Methods both name the t test, and the paper gives no other test for these comparisons. With near-identical means and SDs, a distribution-free test would need markedly different distribution shapes in the two groups to reach p = 0.007. Nothing in the paper describes such shapes.
- Values moved between rows. This is not established. The recomputed p for the diabetes-status knowledge comparison is 0.0052 (Student) or 0.0084 (Welch), which is close to 0.007, but that row is printed as "<0.001". No row recomputes to 0.017. The coincidence alone cannot show that p values were shifted between rows.
- A conversion or typesetting artefact in the archived copy. This is very unlikely: the publisher page gives the same Abstract and Results text, and PMC and Europe PMC give identical Table 1 cells; the publisher's PDF table could not be retrieved automatically. The PMC HTML and the Europe PMC full-text XML give the Table 1 hypertension cells as separate
<td>elements with "0.007" and "0.017". The neighbouring smoking row reproduces from the same layout (p = 0.0020 against a printed 0.003).
From the paper's numbers alone it is not possible to tell whether the p values, the means or the SDs in the hypertension rows are in error. Taken together, the printed means, SDs and group sizes are consistent with each other and with the Table 1 overall mean of about 47.2, and they give p ≈ 0.59 and p ≈ 0.79.
Status
As of 2026-10-23:
- Version of record: checked. On the publisher's article page (link.springer.com, reached after the cookie redirect), the Abstract reads "hypertension (46.46 ± 13.11 for present vs 47.31 ± 12.87 for absent; p=0.007)" and the Results sentence matches the one quoted above. The Table 1 cells did not come through in the publisher-page capture, and the standalone table page and the PDF returned a bot check. The PMC HTML page and the Europe PMC full-text XML give identical Table 1 cells, with the Student's t footer. The figures agree across the Abstract, Results and Table 1 in every source.
- Supplement: none exists. No electronic supplementary material is listed on the publisher page or on PMC, and Europe PMC records no supplementary files (hasSuppl = N, no
<supplementary-material>element). The data availability statement says the data are available from the corresponding author on request. No public data could settle the discrepancy. - Corrections: none found.
src/known.pyfound no Crossref updates and no PMC or Europe PMC notices. The Crossref works record has no update-to or updated-by entries and no relations, and a Crossref relation search for the DOI returned nothing. The Europe PMC record (PMID 39505766) has an empty comment/correction list. A Europe PMC search for a correction or erratum to this article in Diabetologia found none, and the captured publisher page shows no correction notice. - PubPeer: not reachable by automated query, because the API returned a human-verification check. Web searches (including one today for the title with "pubpeer", "correction" and "erratum") found no PubPeer thread, erratum or published comment. A manual search at pubpeer.com is still advisable.
Sources: doi.org/10.1007/s00125-024-06304-3 · link.springer.com article · PMC11732930 · Europe PMC record · Crossref works record
Suggested correction
The authors could re-run the unadjusted comparisons by hypertension status from the original data and report the group sizes, means, SDs and p values exactly as produced, so that they agree with each other.
- If the printed means, SDs and group sizes are correct, the hypertension p values should read about 0.59 (knowledge) and 0.79 (behaviour). Hypertension should then be removed from the Abstract's list of factors significantly associated with knowledge, and from the behaviour statement that follows it. The Results sentences should say the differences were not significant.
- If the p values are correct, the corrected means or SDs should replace those in the Abstract, the Results and Table 1.
It would also help to reconcile the other Table 1 p values that do not reproduce from their rows (Figure 2, script output section 3), and the differing overall knowledge means implied by the diabetes-status, location and age rows. The text could explain how the near-zero unadjusted difference relates to the adjusted hypertension coefficients in Tables 2 and 3.