← Back to the plain-language case
Printed 95% CI for a mortality predictor implies P ≈ 0.98, not the reported 0.006
BMC Med (2024) · doi:10.1186/s12916-024-03812-2 · PMC11656579
Summary
The paper fits a multivariable logistic model of mortality in patients who developed immune checkpoint inhibitor-related endocrinopathies (IREs; N = 173). It reports the pre-treatment platelet-to-lymphocyte ratio (PLR) as OR 1.004, 95% CI 0.7–1.4, P = 0.006, and names PLR as one of two significant predictors. The same three figures appear in the Abstract, in the Results text and in Table 5, and they cannot all be correct. A 95% CI of 0.7–1.4 contains 1 and implies a two-sided P of 0.98 (no lower than 0.73 under any rounding of the printed values). An OR of 1.004 with P = 0.006 would need a 95% CI of about 1.0011–1.0069. A reader therefore cannot tell from the paper whether PLR independently predicts mortality in this subgroup.
What the paper reports
After MVR, factors influencing mortality in the subgroup with IREs included a higher age (OR 1.1, 95% CI 1.04–1.2, P = 0.001) and platelet-to-lymphocyte ratio (OR 1.004, 95% CI 0.7–1.4, P = 0.006).
— Abstract, Results
According to the MVR analysis, only age at ICI initiation (OR 1.1, 95% CI: 1.04–1.2; P = 0.001) and PLR (OR 1.004, 95% CI: 0.7–1.4; P = 0.006) were found to be statistically significant factors for predicting mortality.
— Results, "Factors influencing mortality among patients who developed endocrinopathy post-ICI"
PLR | 1.001 (1.0001-1.003) | 0.03 | 1.004 (0.7-1.4) | 0.006
— Table 5, "Univariate and multivariate logistic regression analysis of factors influencing mortality following endocrinopathies post immune checkpoint inhibitor therapy", PLR row. The columns are univariate OR (95% CI), univariate P, multivariate OR (95% CI) and multivariate P. In the version of record the multivariate P of 0.006 is set in bold. The table footer says "P values in bold indicate statistical significance".
Similarly, mortality was predicted by age at ICI initiation and a higher pre-ICI PLR.
— Discussion, first paragraph
A P value of < 0.05 indicated statistical significance.
— Methods, "Statistical analysis"
Two related passages bear on how PLR is scaled. The first gives the definition (the archived text renders the superscript in "× 10³" as "103"):
Platelet-to-lymphocyte ratio (PLR) was calculated for the included patients using the formula PLR = Lymphocyte Count (× 103/μL) ÷ Platelet Count (× 103/μL).
— Methods, "Data sources and measures"
PLR | 145.3 (64.2-229.2) | 143.9 (27-259.6) | 0.7
— Table 3, PLR row (median and IQR, IRE vs no IRE)
What the paper's own numbers show
Method. A Wald 95% CI for a logistic-regression odds ratio is exp(ln OR ± 1.96 × SE), so it is symmetric on the log scale. The standard error can therefore be recovered from the printed bounds as SE = (ln hi − ln lo)/3.92, and the two-sided P follows from z = ln(OR)/SE. Run backwards, the 95% CI that must go with a given OR and P is exp(ln OR ± 1.96 × ln OR / z_P). To allow for rounding, each printed number was varied across its whole rounding interval (0.7 means 0.65–0.75, 1.004 means 1.0035–1.0045), and the estimate was also allowed to sit at the geometric centre of the CI. As a check on the method, the same calculation was run on nine other rows from Tables 4 and 5. Every number below is printed by recompute.py.txt (Python, numpy/scipy).
| Quantity | Location | Reported | Recomputed from the paper's numbers |
|---|---|---|---|
| Does the 95% CI contain 1? | Abstract; Results; Table 5 | 0.7–1.4 | Yes |
| SE of ln(OR) implied by the CI | Table 5 | 0.7–1.4 | (ln 1.4 − ln 0.7)/3.92 = 0.177 |
| Geometric centre of the CI | Table 5 | OR 1.004 | 0.990 |
| Two-sided P, multivariable PLR | Abstract; Results; Table 5 | 0.006 | 0.98 with OR 1.004 (z = 0.023); 0.95 with the CI centre; one-sided 0.49 |
| Smallest P under any rounding of the printed values | Table 5 | 0.006 | 0.976 with the estimate rounding to 1.004; 0.73 if the estimate is taken as the CI centre |
| P if 0.7–1.4 were a 90%, 99% or 99.9% CI | Table 5 | 0.006 | 0.985, 0.976, 0.970 |
| 95% CI required by OR 1.004 with P = 0.006 | Abstract; Results; Table 5 | 0.7–1.4 | 1.0011–1.0069 (SE 0.00145, 122 times smaller than the SE implied by the printed CI) |
| Required CI over rounding of OR and P | derived | 0.7–1.4 | lower bound 1.0010–1.0013, upper bound 1.0060–1.0078 |
| OR per 100 PLR units, if 1.004 is per unit | derived | 1.004 | 1.004^100 = 1.49, which lies outside 0.7–1.4 |
| Printed CI read as per 100 units, converted to per unit | derived | 0.7–1.4 | 0.9964–1.0034, which still contains 1 |
| Control: univariable PLR, 1.001 (1.0001–1.003) | Table 5 | P = 0.03 | 0.036 (0.027–0.044 over rounding of the bounds) |
| Control: multivariable age, 1.1 (1.04–1.2) | Abstract; Results; Table 5 | P = 0.001 | 0.0024 (0.0002–0.0075) |
| Control: univariable HbA1c, 1.3 (1.01–1.6) | Table 5 | P = 0.03 | 0.041 (0.036–0.046) |
| Control: IRE model, pembrolizumab, 2.6 (1.05–6.3) | Abstract; Table 4 | P = 0.04 | 0.039 (0.038–0.040) |
| PLR scale: Methods formula, lymphocytes ÷ platelets | Methods; Table 3 | medians 145.3 and 143.9 | Using the reference ranges in the Table 3 footer, lymphocytes ÷ platelets falls between 0.0024 and 0.020, and platelets ÷ lymphocytes between 50 and 410. The Table 3 values fit platelets ÷ lymphocytes |
Figure 2 and the script's output list the other control rows: univariable age, univariable haemoglobin, and IRE-model age, WBC and nivolumab. In those nine control rows the recomputed P agrees with the printed P to within rounding, or within about a factor of two where the printed estimate is coarsely rounded. In the multivariable PLR row, the printed P and the P implied by the printed CI differ by more than two orders of magnitude and fall on opposite sides of the paper's 0.05 threshold.
Figure
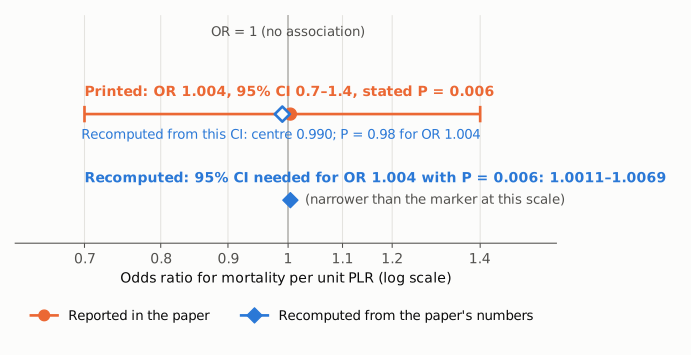
Figure 1. Odds ratio for mortality per unit PLR in the multivariable model of the IRE subgroup, on one log-scale axis. The thin vertical line marks OR = 1. The orange interval and dot show the paper's printed result: OR 1.004, 95% CI 0.7–1.4, stated P = 0.006. The interval straddles OR = 1. Its geometric centre is 0.990 (open blue diamond), and recomputed from its width it gives a two-sided P of 0.98 for an OR of 1.004. The filled blue diamond marks the 95% CI that an OR of 1.004 with P = 0.006 would actually require, 1.0011–1.0069. At this scale that interval is narrower than the marker. The printed interval and the printed P value cannot describe the same estimate.
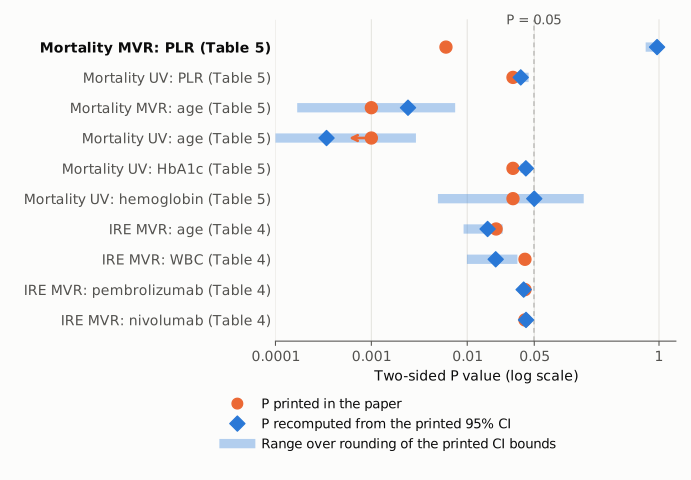
Figure 2. Two-sided P values printed in Tables 4 and 5 (orange circles; the arrow marks a value printed as "<0.001") compared with P values recomputed from each row's printed 95% CI (blue diamonds, with the estimate at the CI's geometric centre). The light-blue bars show how far the recomputed P moves when each printed CI bound varies across its rounding interval. The dashed line marks P = 0.05. In nine rows the printed and recomputed values are close, which shows that the method recovers the paper's own reporting. The multivariable PLR row (top) is the exception. Its printed P is 0.006, while its printed CI gives 0.73–1.0.
Why it matters
Mortality in the IRE subgroup is one of the paper's stated secondary outcomes. PLR is one of only two variables the Abstract lists as multivariable predictors of it. The Results text and Table 5 repeat the result, and the Discussion's opening summary restates it ("mortality was predicted by age at ICI initiation and a higher pre-ICI PLR"). The printed figures support two incompatible readings:
- If the CI is correct, PLR is not a significant independent predictor (P ≈ 0.98). The claim in the Abstract, Results and Discussion would then be reversed.
- If the OR and the P value are correct, the CI is misprinted and would be about 1.001–1.007 per unit, roughly 1.12–1.98 per 100 units of PLR. The significance claim would stand, but the printed interval misstates its precision by a factor of about 120 on the log scale.
Nothing in the paper shows which reading is correct. The supplement contains no regression output that could settle it (see Status).
How PLR is defined adds a second difficulty with this variable. As written in Methods, the formula (lymphocytes ÷ platelets) would give values of about 0.002–0.02, not the medians near 145 shown in Table 3. If the values in Table 3 are platelets ÷ lymphocytes, as their size suggests, the formula in Methods is inverted. Either way, a reader cannot be sure what unit the per-unit OR refers to.
The paper's main conclusions do not depend on this row. These are the IRE incidence of 26.7%, the commonest IRE types, the predictors of IRE development, and the statement that "The development of IREs did not seem to influence mortality" (Abstract, Conclusions). The error affects a secondary, prognostic result, but that result is printed in the Abstract.
Explanations considered
- Rounding. This does not account for the numbers. With every printed value varied across its rounding interval, the smallest two-sided P that can be reached is 0.976 if the estimate rounds to 1.004, or 0.73 if the estimate is taken as the CI centre. In the other direction, the CI that would fit P = 0.006 (1.0011–1.0069) rounds to "1.0–1.0" at one decimal place, not to "0.7–1.4".
- A one-sided test. This does not account for the numbers. The one-sided P from the printed CI is 0.49. Methods mention no one-sided tests and set significance at P < 0.05.
- A confidence level other than 95%. This does not account for the numbers. Read as a 90%, 99% or 99.9% interval, 0.7–1.4 gives P between 0.970 and 0.985.
- A rescaled PLR unit (for example, OR per 10 or per 100 units). This does not account for the numbers. Neither Table 5 nor Methods states any rescaling. The OR and its CI are printed together, so they should be on the same scale, and on that scale the CI is centred at 0.990, not 1.004. If only the OR had been rescaled, 1.004 per unit would be 1.49 per 100 units, which lies outside 0.7–1.4. If the CI were per 100 units, it would be 0.9964–1.0034 per unit, which still contains 1.
- A non-Wald interval (profile likelihood or bootstrap). This does not account for the numbers. Such intervals can be somewhat asymmetric, but a 95% interval that runs from 0.7 to 1.4 around an estimate of 1.004 cannot accompany a test that rejects OR = 1 at P = 0.006. An interval obtained by inverting a test with P = 0.006 excludes 1 at the 95% level. An unstable fit with a very large SE would also give a large P, not a small one.
- Adjusted and unadjusted figures mixed together. This does not account for the numbers. All three figures sit in the multivariate columns of Table 5, and the Abstract and Results text label them as multivariable (MVR) results. The univariable PLR row (1.001, 1.0001–1.003, P = 0.03) is internally consistent (recomputed P 0.036).
- A conversion or typesetting artefact in the archived copy. This was ruled out. The publisher's HTML (link.springer.com, including the standalone Table 5 page), the PMC text and the Europe PMC full-text XML all give "1.004 (0.7-1.4)" and "0.006" in separate table cells. The Abstract and the Results text repeat the same figures in prose.
- A general reporting pattern. This does not account for the numbers. In nine other rows of Tables 4 and 5, the recomputed P values agree with the printed ones (Figure 2). The discrepancy is specific to this row.
From the paper's numbers alone, it is not possible to tell which of the three printed values is in error.
Status
As of 2026-10-23:
- Version of record: checked. The publisher's HTML at link.springer.com (published 18 December 2024) was rendered in headless Chromium. It shows the same Abstract sentence and the same Results sentence. The standalone Table 5 page gives the PLR row as "1.004 (0.7-1.4)" with "0.006" in bold. The PMC HTML and the Europe PMC full-text XML match. The publisher PDF could not be retrieved: the request returned an HTML interstitial page.
- Supplement: checked. Additional file 1 (12916_2024_3812_MOESM1_ESM.docx, Tables S1–S5) was downloaded, and its MD5 checksum matches the one listed in the PMC XML. It gives laboratory values (including platelets, lymphocytes and the platelet/lymphocyte ratio), follow-up endocrine profiles and subgroup characteristics. It contains no regression coefficients, standard errors or model output, so it does not resolve the discrepancy.
- Corrections: none found. Crossref lists no updates (no update-to or updated-by entries) and PMC lists no notices, both checked with
src/known.py. Europe PMC (PMID 39695571) shows no comment or correction links and no erratum records. The Retraction Watch database has no entry for the DOI. The publisher page shows no correction notice. - PubPeer: not reachable by automated query. The API returned HTTP 403, and the search page served a bot-verification challenge. Earlier web searches during this audit found no PubPeer thread, erratum or published comment. Fresh web searches could not be run today because the session's search quota was used up. A manual search at pubpeer.com is still advisable.
Sources: doi.org/10.1186/s12916-024-03812-2 · link.springer.com article · Table 5 page · PMC11656579 · Europe PMC record · Crossref works record
Suggested correction
The authors could re-check the multivariable logistic model of mortality in the IRE subgroup against the original software output. They could then report the PLR odds ratio, its 95% CI and its P value exactly as produced, so that the three values agree, and state the PLR unit that the OR refers to.
- If the CI is the misprinted value, the corrected interval should replace "0.7–1.4" in the Abstract, the Results text and Table 5.
- If the P value or the estimate is in error, the statement that PLR is a significant independent predictor of mortality should be revised in the Abstract, the Results and the Discussion.
Separately, the PLR formula in Methods ("Lymphocyte Count ÷ Platelet Count") should be checked against the values in Table 3, which fit platelets ÷ lymphocytes.