← Back to the plain-language case
Reported CO2 storage capacities per km³ are about 920 times what the paper's inputs give
Sci Adv (2024) · doi:10.1126/sciadv.adq0515 · PMC11566992
Summary
The paper's only quantitative estimate of reservoir storage capacity is a first-order calculation. It fills the 5.7% effective porosity of a basalt reservoir with a fluid carrying 0.65 M CO2 (6.5 M once the chelating agent GLDA has fully degraded) and reports capacities of 1.5 and 15 Gt CO2 per km³. Multiplying the paper's own inputs (10⁹ m³ × 0.057 × 650 mol/m³ × 44.01 g/mol) gives 0.0016 and 0.016 Gt per km³ (1.6 and 16 Mt). The reported values are about 920 times larger, which fits a megatonne-to-gigatonne unit slip, and they would require a pore volume 52 times the volume of the rock. The same inflated figure produces the claim that "up to 20 Gt of CO2 annually" fits in 1.3 km³ (1/25,000 of Iceland's active rift zone): with the paper's inputs, 1.3 km³ holds about 0.021 Gt, and the stated "two orders of magnitude higher" comparison with the cited 0.18 Gt/km³ becomes about 11 times lower.
What the paper reports
All passages are from the article as archived in PubMed Central. The archive text writes km3 and CO2 for km³ and CO₂. Where the paper names the cited study (its reference 17) by author, the name is replaced here by "[the cited study]"; everything else is verbatim.
The inputs:
"Specifically, the total porosity ranged from 10.99 to 15.23%, of which only 18.7 to 57.5% were connected porosity, resulting in a mean effective porosity of 4.8%. Assuming an enhancement in pore properties comparable to that observed in the experiment with injection of the acidic GLDA solution, the effective porosity was anticipated to increase from 4.8 to 5.7%." (Results, "CO2 mineralization with GLDA biodegradation and overall evaluation", para 2)
"if a solution containing 20 wt % GLDA-Na4 (C9H9NNa4O8) was used for injection, then CO2 concentration is expected to increase 10-fold, from 0.65 M to 0.65 + 0.65 × 9 (number of carbon atoms in GLDA) = 6.5 M." (Same subsection, para 1)
The capacity calculation and the claims built on it:
"When filling all effective porosity with a CO2-charged 20 wt % GLDA-Na4 seawater solution (CO2 concentration estimated as 0.65 M), the reservoir exhibited a CO2 storage capacity of 1.5 Gt/km3." (Same subsection, para 2)
"With complete degradation of GLDA, the concentration of CO2 in the fluid would attain a value of 6.5 M, resulting in a reservoir capable of storing 15 Gt of CO2/km3, two orders of magnitude higher than the value reported by [the cited study] (17) based on CO2 capture and storage using fresh water (a mean value of 0.18 Gt of CO2/km3)." (Same subsection, para 2)
"Up to 20 Gt of CO2 annually could potentially be sequestered in a 1.3 km3 reservoir volume, which is 1/25,000 of the active rift zone in Iceland (area of 33,000 km2, thickness of 1 km)." (Same subsection, para 2)
The abstract's closing claim:
"Promising CO2 storage and mineralization capacities two orders higher than current techniques, this approach reduces required reservoir volume while enhancing efficiency." (Abstract)
The paper uses M for mol/L throughout. For example, the Methods give "~0.0325, 0.065, 0.162, 0.325, and 0.65 M" for 1 to 20 wt % GLDA solutions (Materials and Methods, "Powder experiments", para 2).
What the paper's own numbers show
Method. The paper's stated rule is to fill all effective porosity of the rock with fluid at the stated CO2 concentration. For 1 km³ of rock (10⁹ m³) this gives:
capacity = 10⁹ m³ × effective porosity × concentration (mol/L × 1,000 L/m³) × 44.01 g/mol ÷ 10¹⁵ g/Gt.
The only constant in the capacity calculation not taken from the paper is the molar mass of CO2. One ceiling uses an assumed dense-CO2 density of 700 kg/m³, and one comparison uses an assumed basalt density of 2,950 kg/m³. recompute.py.txt evaluates the expression, inverts it to find the porosity the reported values would need, and recomputes the 1.3 km³ and 1/25,000 figures. It also takes the cited 0.18 Gt/km³ back to the cited study's own tables.
| Quantity | Location | Reported | Recomputed |
|---|---|---|---|
| Pore fluid in 1 km³ at 5.7% effective porosity | Results, "CO2 mineralization …", para 2 | not stated | 5.7 × 10⁷ m³ |
| CO2 in that fluid at 0.65 M | same | not stated | 3.7 × 10¹⁰ mol = 1.63 × 10¹² g |
| Storage capacity at 0.65 M | same | 1.5 Gt/km³ | 0.0016 Gt/km³ (1.6 Mt/km³); reported is 920× larger |
| Concentration after full GLDA degradation | same, para 1 | 0.65 + 0.65 × 9 = 6.5 M | 6.5 M (consistent) |
| Storage capacity at 6.5 M | same, para 2 | 15 Gt/km³ | 0.016 Gt/km³ (16 Mt/km³); reported is 920× larger |
| Effective porosity the reported values would need | derived | 5.7% stated | 5,244% (52 m³ of fluid per m³ of rock), at either concentration |
| CO2 mass per m³ of rock implied by the reported values | derived | 1.5 / 15 Gt/km³ | 1,500 / 15,000 kg per m³ of rock |
| Ceiling: 6.5 M fluid filling 100% of the rock | derived | – | 0.29 Gt/km³ |
| Ceiling: dense CO2 (700 kg/m³, assumed) filling all 5.7% pores | derived | – | 0.040 Gt/km³ |
| Reservoir volume for 20 Gt | same, para 2 | 1.3 km³ = 1/25,000 of 33,000 km³ | 20 / 15 = 1.33 km³ and 33,000 / 25,000 = 1.32 km³ (the reported chain is self-consistent with 15 Gt/km³) |
| CO2 held in 1.3 km³ at 6.5 M | same | "up to 20 Gt" | 0.021 Gt (21 Mt) |
| Reservoir volume for 20 Gt at the recomputed capacity | derived | 1.3 km³ | 1,227 km³ = 1/27 of the 33,000 km³ rift zone |
| Cited comparator, from the cited study's own tables | cited study, Tables 7 and 8 | 0.18 Gt/km³ | 0.33 Gt / 1.8 km³ = 0.183; 6,100 Gt / 33,000 km³ = 0.185 Gt/km³ |
| Ratio of the 6.5 M capacity to the comparator | same, para 2; Abstract | "two orders of magnitude higher" (15 / 0.18 = 83×) | 0.016 / 0.18 = 0.09, about 11× lower |
Each later number follows arithmetically from the 15 Gt/km³ figure: 1.3 km³ × 15 Gt/km³ = 19.5 Gt ("up to 20 Gt"), and 1.3 km³ is 1/25,000 of the 33,000 km³ rift zone. The error therefore enters once, at the step that converts grams of CO2 to gigatonnes, and is carried through the rest of the paragraph.
Figure
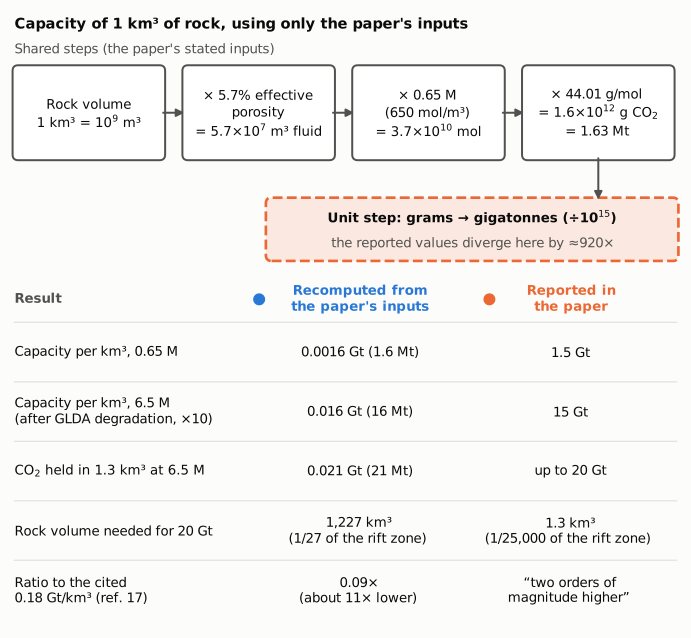
Figure 1. The top row gives the paper's stated inputs, multiplied in sequence for 1 km³ of rock: 5.7% effective porosity gives 5.7 × 10⁷ m³ of pore fluid, 0.65 M (650 mol/m³) gives 3.7 × 10¹⁰ mol of CO2, and 44.01 g/mol gives 1.6 × 10¹² g, or 1.63 Mt. The dashed box marks the conversion from grams to gigatonnes, where the reported values become about 920 times larger than the product of the inputs. The table below gives each downstream result twice: recomputed from the paper's inputs (blue marker, middle column) and as reported in the paper (orange marker, right column). All recomputed numbers come from recompute.py.txt.
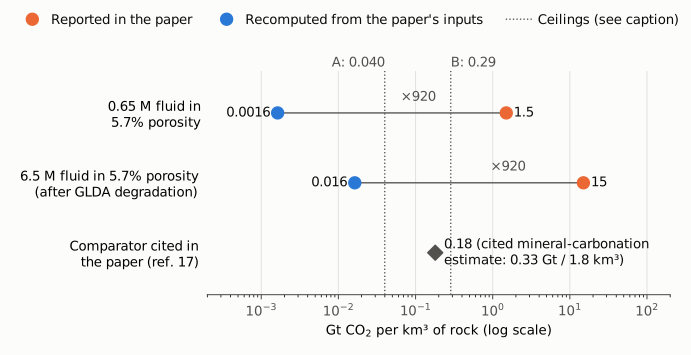
Figure 2. Storage capacity in Gt CO2 per km³ of rock, on a log scale. For each scenario, the orange dot is the value reported in the paper and the blue dot is the value recomputed from the paper's own porosity and concentration; the labelled factor is the ratio of the two. The dotted lines are two ceilings, also computed in recompute.py.txt. Ceiling A (0.040 Gt/km³) is pure dense CO2 at an assumed 700 kg/m³ filling all of the 5.7% effective porosity. Ceiling B (0.29 Gt/km³) is the 6.5 M fluid filling 100% of the rock volume. Both reported values lie above both ceilings. The grey diamond is the 0.18 Gt/km³ comparator the paper cites, a mineral-carbonation estimate that the cited study derives as 0.33 Gt for a 1.8 km³ formation. The recomputed 6.5 M value lies below it, not two orders of magnitude above it.
Why it matters
The two capacities are the paper's only quantitative estimate of storage at reservoir scale, and they support the paper's scale-up claims: that 20 Gt of CO2 per year (the 2100 removal target the Introduction cites) could be stored in 1.3 km³, a small fraction of Iceland's rift zone, and, in the abstract, that the approach offers capacities "two orders higher than current techniques" and "reduces required reservoir volume". With the paper's own inputs, the reservoir volume needed for 20 Gt is about 1,230 km³ rather than 1.3 km³, roughly 1/27 of the rift zone rather than 1/25,000. The comparison with the cited value is not two orders of magnitude higher: in the same units it is about 11 times lower.
The abstract gives no numbers and does not say which comparison its "two orders higher" rests on. The only quantitative comparison in the body is the one recomputed here, so with the paper's inputs the abstract claim is not supported by the body.
The experimental results do not depend on this calculation. These are the measured changes in basalt cores after acidic GLDA flooding (16% gain in effective porosity, 26-fold gain in permeability), the CO2 absorption of GLDA seawater solutions, and the batch and flooding chemistry. The stoichiometric step from 0.65 M to 6.5 M after GLDA degradation is arithmetically consistent and is not in question here.
Explanations considered
A different meaning of "M". The paper uses M as mol/L, and 1 mol/L equals 1 kmol/m³, which is what the recomputation uses. The value 0.65 M for 20 wt % GLDA-Na4 (molar mass 351.1 g/mol, so 0.570 mol per kg of solution) implies a solution density of 1.14 kg/L, which is plausible. No reading of M makes the concentration 1,000 times larger.
A different porosity. To give 1.5 Gt/km³ at 0.65 M, or 15 Gt/km³ at 6.5 M, the pore fluid would have to be 52 times the volume of the rock (an effective porosity of about 5,200%). The paper's stated values are 4.8% and 5.7%. In its own experiments, the flooding core's effective porosity rose from 12.4 to 14.4%, and its basalt samples' total porosity is 14–20%. The cited study gives 10.99–15.23% total. None of these comes close. Even if the whole rock volume were 6.5 M fluid, the capacity would be 0.29 Gt/km³.
A megatonne/gigatonne slip. The correct results are 1.63 and 16.3 Mt/km³. Reporting them as 1.5 and 15 Gt/km³ fits a factor-of-1,000 unit slip combined with rounding or slightly different inputs (the remaining factor is 0.92). This is the most economical arithmetic explanation of how the numbers arose. It does not make the Gt figures correct, and every downstream statement in the paragraph inherits the factor.
A different basis (per km³ of pore space, or including mineralized CO2). The text says the calculation fills "all effective porosity" with the solution at the stated concentration. Even 1 km³ of pure pore fluid at 6.5 M holds only 0.29 Gt, not 15. Mineralization converts CO2 already in the fluid into carbonate and adds no CO2. Filling all 5.7% of the pore space with dense CO2 is capped at about 0.04 Gt/km³. The reported 15 Gt/km³ means 15,000 kg of CO2 per m³ of rock, about five times (5.1×) the density of basalt itself (taking a typical 2,950 kg/m³, an assumed value).
"Annually" meaning repeated injection. The paper gives no injection rate, pore-fluid turnover or number of cycles per year. The 20 Gt figure equals the static capacity times the volume (1.3 km³ × 15 Gt/km³ = 19.5 Gt), so "annually" adds no factor to the calculation.
The comparator is in Mt as well. If the cited 0.18 Gt/km³ were also inflated by a factor of 1,000, the paper's ratio would survive. The cited study's own tables rule this out. Its Table 7 gives a mean CO2 sequestration potential of 0.33 Gt for a CarbFix formation of 1.8 km³ (0.4 km × 2.5 km × 1.8 km), which is 0.18 Gt/km³. Its Table 8 gives 6,100 Gt for the 33,000 km³ rift zone, which is 0.185 Gt/km³. The paper takes its 33,000 km² × 1 km rift-zone dimensions from the same table. The value is computed from reactive surface area and a mineral-carbonation fixation rate per unit area, not from CO2 dissolved in pore fluid. It is in gigatonnes in the source, and it rests on a different basis from the paper's fluid-filling calculation. With consistent units, the paper's 0.016 Gt/km³ is about 11 times below it.
Conversion or archiving artifact. Ruled out. The publisher-typeset PDF (Science Advances, deposited in the PMC Open Access collection) carries the same numbers and units as the PMC text and the Europe PMC XML, with km³ correctly marked up. The quantities are not affected by formatting.
A derivation in the supplement. The only supplementary file (Tables S1–S2, Figs. S1–S11) contains rock compositions, the seawater recipe and experimental figures. It contains no capacity calculation, no Gt or km³ values, and no alternative units.
Status
As of 2026-10-23:
- Version of record. science.org, reached through doi.org, returned HTTP 403 to automated fetches. An earlier audit stage therefore checked the publisher-typeset PDF from the PMC Open Access bucket (
s3://pmc-oa-opendata/PMC11566992.1/, a Science Advances InDesign PDF created 2024-11-14). Its Results subsection "CO2 mineralization with GLDA biodegradation and overall evaluation" carries every quoted number unchanged (4.8 to 5.7%; 0.65 M, 1.5 Gt/km³; 6.5 M, 15 Gt/km³; 0.18 Gt/km³; 20 Gt, 1.3 km³, 1/25,000). The abstract sentence is also unchanged. The quotes above were re-checked verbatim against the PMC archive text on 2026-10-23. - Supplements.
sciadv.adq0515_sm.pdf(13 pages) was read in full at an earlier audit stage. It has no capacity derivation. No source-data files are deposited. - Cited comparator. The cited study's accepted manuscript (OSTI 1538337), Tables 7 and 8, was read on 2026-10-23 to establish the basis and units of 0.18 Gt/km³.
- Corrections.
src/known.py(run 2026-10-23) lists no Crossref updates and no PMC or Europe PMC correction or retraction notices. A Crossreffilter=updates:query for the DOI returns 0 results. The PMC record lists no related notices. Crossref Labs (Retraction Watch data) and a Europe PMC search for the DOI showed no correction at an earlier audit stage. - PubPeer. The PubPeer API returned HTTP 403 on 2026-10-23, so PubPeer could not be checked directly. A web search on 2026-10-23 for the DOI or title together with PubPeer, correction and erratum found no relevant thread or notice.
Sources: PMC11566992 (PubMed Central archive, read with src/show.py); https://doi.org/10.1126/sciadv.adq0515; publisher PDF and supplement from s3://pmc-oa-opendata/PMC11566992.1/; cited study, doi:10.1016/j.ijggc.2017.12.008 (accepted manuscript https://www.osti.gov/servlets/purl/1538337); https://api.crossref.org/works?filter=updates:10.1126/sciadv.adq0515.
Suggested correction
In the Results paragraph:
- Replace "a CO2 storage capacity of 1.5 Gt/km3" with "a CO2 storage capacity of about 1.6 Mt/km3 (0.0016 Gt/km3)".
- Replace "15 Gt of CO2/km3" with "about 16 Mt of CO2/km3 (0.016 Gt/km3)".
- Rewrite the comparison with the cited value of 0.18 Gt/km3. In the same units the corrected figure is about one-eleventh of it, not two orders of magnitude higher, and the cited value is a mineral-carbonation estimate rather than a dissolved-CO2 capacity.
- Restate the 20 Gt sentence. Under the stated assumptions, 1.3 km³ holds about 21 Mt of CO2, and 20 Gt would need about 1,230 km³, roughly 1/27 of the 33,000 km³ rift zone. If "annually" is meant to reflect repeated injection, state the injection rate or turnover that supports it.
In the abstract, revise "capacities two orders higher than current techniques" and "reduces required reservoir volume" to match the corrected calculation, or name the comparison and basis that support them.