← Back to the plain-language case
Survival difference called significant in abstract has log-rank P = 0.055, above the stated 0.05 threshold
Clin Cancer Res (2024) · doi:10.1158/1078-0432.CCR-23-1242 · PMC11474168
Summary
The abstract, the Discussion and the closing summary describe overall survival (OS) in PAM50 HER2-enriched triple-negative breast cancer as "significantly" better than, longer than or different from OS in basal tumors. The only test the paper reports for this comparison is a log-rank test in the Figure 5B legend, with P = 0.055. The Methods set a two-tailed significance level of 0.05, so the result is not significant by the paper's own criterion, and re-running the log-rank test on the published Supplementary Table S2 gives the same answer (χ² = 3.680, P = 0.0551). This is the only survival finding in the abstract and the authors present it as a new observation. The direction of the difference is unchanged; only the claim of statistical significance is unsupported.
What the paper reports
Abstract, Results:
The majority of TNBC were classified as basal or HER2-enriched by PAM50, the latter showing significantly improved overall survival.
Results, section "Overall survival and molecular subtypes", second paragraph (neutral wording):
One notable finding from this analysis was a prolongation of OS in patients whose tumors, although TNBC by histology, classified as HER2-enriched on PAM50 subtyping (Fig. 5B).
Figure 5 legend, panel B (the reported test):
B, Kaplan–Meier plot showing overall survival for patients with TNBC based on PAM50 gene subtype. Basal is marked in red and HER2 is marked in pink. Numbers of patients at risk over time are depicted under the graph (log-rank test, P = 0.055).
Discussion, fifth paragraph:
In addition, we found a significantly longer OS among the small number of patients whose tumors were classified as “HER2-enriched” by PAM50. This is, to our knowledge, a new observation and might reflect an inherent favorable biology in these tumors.
Discussion, closing summary paragraph:
As for patients’ survival, we observed that the two major PAM50 subtypes had significantly different OS as well as a trend for higher immune-related gene expression in patients with better OS.
Materials and Methods, "Survival analysis":
For all Kaplan-Meier plots, a log-rank test was used for generating P values.
Materials and Methods, "Statistical analyses":
All tests were two-tailed, the statistically significant level was set at 0.05, and P values were not adjusted for multiple comparisons.
Results, section on PDL1 positivity (the same threshold applied to a P value of similar size):
There was a nonsignificant (P = 0.056) positive correlation between the percentage of PDL1-positive TC and IC
What the paper's own numbers show
Method. I compared the reported log-rank P with the stated α, checked whether rounding or a different number of groups could bring it below 0.05, and converted it to the implied test statistic. I then re-ran the log-rank test on the per-patient data published as Supplementary Table S2 (sheet "metadata_with_normalized_genes": PAM50 call, vital status, days to event). The test was written by hand in the Mantel–Haenszel form used by R's survdiff and checked against scipy.stats.logrank. As in the main analysis, deaths are events and patients recorded "Alive" or "unknown" are censored. The supplement is read into memory only, and no per-patient value is reproduced here. Every number below is printed by recompute.py.txt.
| Quantity | Location | Reported | Recomputed |
|---|---|---|---|
| Log-rank P, OS, basal vs HER2-enriched | Fig. 5B legend | 0.055 | 0.055 > 0.05; P − α = 0.005 |
| Significance level | Methods, "Statistical analyses" | 0.05, two-tailed | — |
| Values that round to 0.055 | derived | — | 0.0545 to 0.0555, all above 0.05 |
| χ² implied by P = 0.055, df = 1 | derived | — | 3.682 (3.841 needed for P = 0.05) |
| χ² implied by P = 0.055, df = 2 (if LumB were a third group) | derived | — | 5.801 (5.991 needed) |
| Implied two-sided |Z| | derived | — | 1.919 (1.960 needed) |
| PAM50 counts basal / HER2-E / LumB / not available | Table 1 | 64 / 12 / 3 / 16 (67 / 13 / 3 / 17%) | sum 79 + 16 = 95; percentages match |
| Log-rank re-run, basal vs HER2-enriched | Suppl. Table S2 | (paper: P = 0.055) | χ² = 3.680, df = 1, P = 0.0551; basal n = 63, 53 deaths (46.59 expected); HER2-E n = 12, 9 deaths (15.41 expected) |
| Kaplan–Meier median OS | Suppl. Table S2 | not stated | basal 510 days; HER2-enriched 1258 days |
| Variant: LumB added as third group | Suppl. Table S2 | not reported | χ² = 4.661, df = 2, P = 0.097 |
| Variant: 5 basal patients with "unknown" vital status dropped | Suppl. Table S2 | not reported | χ² = 3.848, df = 1, P = 0.0498 |
| One-sided P | derived | not used (Methods: two-tailed) | 0.0275 |
The re-run on the supplementary data reproduces the published P to three decimals, so the P value itself is correct. Under the paper's stated convention the comparison is not statistically significant. HER2-enriched patients did have numerically longer median OS (1258 vs 510 days), and fewer deaths than expected under the null (9 observed vs 15.41 expected). The evidence amounts to a trend from 12 patients.
Figure
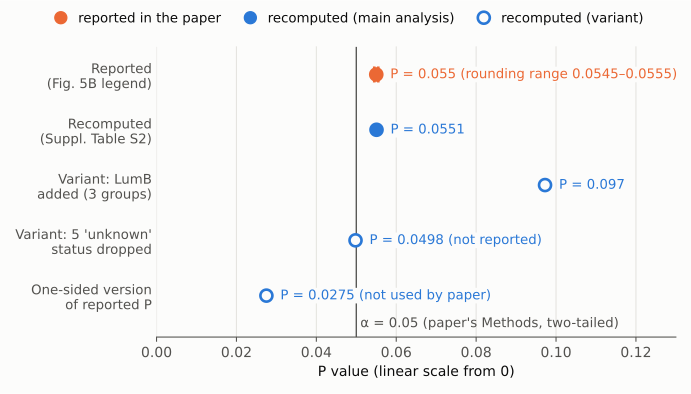
Figure 1. P values for the PAM50 overall-survival comparison on a linear axis from 0. The thin vertical line is the paper's stated two-tailed α = 0.05. Orange: the P printed in the Figure 5B legend, 0.055; the short bar marks every value that rounds to it (0.0545 to 0.0555). Filled blue: the same basal vs HER2-enriched log-rank test re-run on Supplementary Table S2, P = 0.0551. Open blue: variants the paper does not report. Adding the 3 LumB patients as a third group gives P = 0.097. Dropping the 5 basal patients with "unknown" vital status instead of censoring them gives P = 0.0498. Halving the reported P, as a one-sided test would, gives 0.0275, but the Methods state that all tests were two-tailed. The analysis that reproduces the paper's own P lies above α, as does every value consistent with the printed figure.
Why it matters
- It is the abstract's only survival result. The abstract's Results end with "the latter showing significantly improved overall survival", and the Discussion calls the finding new and suggests it "might reflect an inherent favorable biology in these tumors". A reader of the abstract would take this as a statistically supported prognostic difference between PAM50 subtypes within TNBC.
- The paper's own threshold says otherwise. The paper applies 0.05 strictly elsewhere: it calls a PDL1 correlation with P = 0.056 "nonsignificant", and describes OS differences between TNBC subtypes, AR status, PDL1 status and Rb status as not significant. The PAM50 result, at P = 0.055, is the one exception.
- The evidence is thin. The comparison rests on 12 HER2-enriched patients (9 deaths). An unreported variant, excluding rather than censoring 5 patients with unknown vital status, moves P to just below 0.05 (0.0498), and adding the 3 LumB patients moves it to 0.097. A result this close to the threshold is fragile however it is classified.
- The main conclusions are unaffected. The paper is mainly a multiomic resource and biomarker-correlation study. Its findings on Rb mRNA and protein versus RB1 mutation, the two LAR clusters, PDL1 TC/IC concordance and HER2-low versus HER2-zero do not depend on this survival comparison.
Explanations considered
- The 0.05 level applies only to the PRISM analyses. The sentence setting α sits in the "Statistical analyses" paragraph, which describes Fisher, χ² and Mann–Whitney tests run in PRISM. Survival was analysed separately in R, and that paragraph names no α. But the paper states no other threshold anywhere, and 0.055 is above 0.05 under any usual convention. This does not explain the wording.
- Rounding. Every value that rounds to 0.055 lies between 0.0545 and 0.0555, above 0.05, and the re-run gives 0.0551. Does not explain it.
- A one-sided test. A one-sided P would be 0.0275, but nothing in the paper says the survival test was one-sided, and the only stated convention is two-tailed. Does not explain it.
- A different number of groups. If the legend's P came from a three-group test including LumB, the implied χ² (5.801, df = 2) is still below the 5.991 cutoff. The supplement gives P = 0.097 for three groups and 0.0551 for two, so the printed 0.055 is the two-group test. Does not explain it.
- A different test or model. No Cox model, adjusted analysis or other P value for the PAM50 OS comparison appears in the text, tables or figure legends. The Results cite Supplementary Fig. S7 only for features of HER2-enriched tumors (S7A–S7G) and for OS by TNBC subtype (S7H). Does not explain it.
- A different handling of patients with unknown vital status. Excluding the 5 basal patients whose vital status is "unknown" gives P = 0.0498. The paper does not report this analysis, and the published P (0.055) is the one obtained by censoring them, which is the usual practice. This variant shows the result is borderline; it does not show the reported analysis was significant.
- A text-conversion artifact. Ruled out. The PMC page, the Europe PMC full-text JATS XML and the PubMed abstract carry the same wording and the same "P = 0.055" as plain text, and the supplementary data reproduce that value.
- A correction already issued. None found (see Status).
Status
- Version of record. The publisher's page (aacrjournals.org, reached through doi.org) returned HTTP 403 to automated requests. The PMC page for PMC11474168, the Europe PMC full-text XML (publisher JATS) and the PubMed record (PMID 39136550) all contain the quoted sentences and the Figure 5B P value as plain text. Every quotation above was checked verbatim against the PMC-archived text with
src/show.py. - Supplements. The supplements are deposited on Figshare under the Crossref "is-supplemented-by" DOIs 10.1158/1078-0432.27231288 to .27231324. Supplementary Table S2 (Figshare file 49797945) holds per-patient PAM50 calls, vital status and days to event, and was used for the re-run above. It confirms the published P and does not support a claim of significance at 0.05.
- Corrections and comments. As of 2026-10-24 I found no correction, erratum, retraction or expression of concern.
src/known.pyreturns no Crossref updates and no PMC or Europe PMC notices. The Crossref record has no update-to or updated-by entries; its relations list only has-preprint and is-supplemented-by. The Europe PMC record has no comment or correction list, and the PubMed record has no CommentsCorrections entries. The PubPeer API returned no record (HTTP 404) for the DOI, and a web search for the title together with "PubPeer" found no thread. - Sources. PMC article PMC11474168; Europe PMC full-text XML and record; PubMed 39136550; Crossref; Figshare supplementary files (Table S2, file 49797945); PubPeer; https://doi.org/10.1158/1078-0432.CCR-23-1242.
Suggested correction
In the abstract, replace
the latter showing significantly improved overall survival.
with wording such as
the latter showing a trend toward longer overall survival that did not reach statistical significance (log-rank P = 0.055).
In the Discussion, replace "we found a significantly longer OS among the small number of patients" with "we observed a numerically longer OS (log-rank P = 0.055) among the small number of patients", and in the closing summary replace "the two major PAM50 subtypes had significantly different OS" with "the two major PAM50 subtypes showed a trend toward different OS". The authors may also wish to state the threshold used for the survival analyses in the "Survival analysis" paragraph, and to give the group sizes and the handling of patients with unknown vital status in the Figure 5B legend.