← Back to the plain-language case
Abstract hazard ratio for SLiM-CRAB status lies outside its own confidence interval and contradicts the Results
J Clin Oncol (2024) · doi:10.1200/JCO.23.02771 · PMC11404760
Summary
This single-arm phase II trial in high-risk smoldering myeloma (90 patients) reports in its abstract that having any SLiM-CRAB criterion predicted progression to multiple myeloma (MM), with "hazard ratio, 0.12; 95% CI, 0.14 to 1.13; P = .03". Those three numbers cannot belong together. The point estimate lies below the lower confidence limit, and the interval contains 1, so a Wald test based on it gives P ≈ 0.084, not .03. The Results section reports the same comparison as HR 0.10 (95% CI 0.01 to 0.96; P = .046). Those values are internally consistent (the interval's centre is 0.098, Wald P 0.046) and roughly match the paper's raw counts. The correct result keeps its direction and nominal significance. But the abstract figures, the version most readers see, cannot be read as printed, and the body's figures show that the estimate rests on 5 events and has an interval spanning about two orders of magnitude.
What the paper reports
Abstract, Results:
The presence of any SLiM CRAB criteria predicted progression to MM (four of the five patients; hazard ratio, 0.12; 95% CI, 0.14 to 1.13; P = .03).
Results, "Time-To-Event End Points", paragraph 4 of that section (same comparison, same outcome, same figure):
As mentioned above, 28 patients presented with any one SLiM biomarker. Although their response rate was not different from that observed in the standard high-risk–SMM population (Appendix Table A2), the presence of any SLiM biomarker predicted progression to MM (HR, 0.10 [95% CI, 0.01 to 0.96]; P = .046; Fig 3B).
The subgroup sizes. Abstract, Results:
90 patients were included, and 31% met at least one SixtyLightchain MRI (SLiM)-hypercalcemia, renal impairment, anemia, bone disease (CRAB) criterion.
Table 1:
SLiM-CRAB criteria, No. (%) | 28 (31)
Appendix Table A2 gives the columns "High Risk (n = 62)" and "Ultra High Risk (n = 28)". Its footnote b reads:
Four patients biochemically progressed and one of them progressed to myeloma.
The model. Methods, "Statistical Analysis":
The Kaplan-Meier method was used to characterize event time distributions, and the corresponding treatment hazard ratio was estimated using a stratified Cox regression model to compare outcomes based on baseline characteristics and MRD status.
The conclusion that rests on this result. Discussion, paragraph 6:
In our study, the only feature predicting progression to MM was the presence of any SLiM biomarker, now incorporated into the definition of MM, which would reinforce this hypothesis.
What the paper's own numbers show
Method. A Cox-model 95% CI is symmetric on the log scale, so the reported HR should lie close to the interval's geometric centre, sqrt(lower × upper). The standard error of log HR is ln(upper/lower)/(2 × 1.96), and the two-sided Wald P is 2Φ(−|ln centre|/SE). I applied this check to every hazard ratio printed in the paper (five in all), which shows whether the paper follows one consistent convention. I then checked whether rounding or a single misplaced digit could reconcile the abstract. As a rough check on direction and size that is independent of the Cox model, I computed a crude risk ratio from the counts (1 of 62 vs 4 of 28 progressed to MM). It ignores follow-up time and is not the paper's estimate. Every number below is printed by recompute.py.txt.
| Quantity | Location | Reported | Recomputed from the paper's numbers |
|---|---|---|---|
| Is the HR inside its 95% CI? | Abstract, Results | HR 0.12; CI 0.14 to 1.13 | No: 0.12 < 0.14 |
| Centre of the CI, sqrt(lo × hi) | Abstract, Results | HR 0.12 | 0.398 |
| Does the CI exclude 1? | Abstract, Results | P = .03 | No: 1.13 > 1, so any test matching this interval gives P ≥ .050 |
| Wald P from the CI | Abstract, Results | P = .03 | 0.084 (SE of log HR 0.533) |
| Can rounding explain HR < lower limit? | Abstract, Results | 0.12 vs 0.14 | No: values rounding to 0.12 are < 0.125; values rounding to 0.14 are ≥ 0.135 |
| Centre of the CI | Results, Time-To-Event End Points; Fig 3B | HR 0.10; CI 0.01 to 0.96 | 0.098 |
| Wald P from the CI | Results, Time-To-Event End Points; Fig 3B | P = .046 | 0.046 from the CI centre; 0.048 from HR 0.10 (SE 1.164) |
| The paper's other three HRs: CI centre and Wald P | Results, Time-To-Event End Points (Fig 2B, Appendix Fig A1A, A1B) | 0.29 (0.13 to 0.66), P = .003; 0.42 (0.22 to 0.81), P = .01; 0.40 (0.18 to 0.85), P = .018 | 0.293, P 0.003; 0.422, P 0.009; 0.391, P 0.018: all consistent |
| Abstract with the lower limit read as 0.014 | hypothetical single typo | n/a | Centre 0.126 (fits 0.12), but the CI still contains 1; Wald P 0.058 to 0.064 |
| CI that HR 0.12 with P = .03 would imply | hypothetical | n/a | 0.018 to 0.814 |
| Progression to MM by SLiM status | Abstract ("four of the five"); Table 1; Table A2 | 4 of 5 events in the SLiM group; n = 28 vs 62 | 4/28 = 14.3% vs 1/62 = 1.6% |
| Crude risk ratio, no SLiM vs SLiM | from the counts above | n/a | 0.113 (95% CI 0.013 to 0.965); Wald P 0.046; Fisher exact P 0.031 |
| Share of patients with any SLiM-CRAB criterion | Abstract; Table 1 | 31%; 28 (31) | 28/90 = 31.1% (consistent) |
Of the five hazard ratios printed in the paper, the abstract's is the only one whose point estimate, interval and P value do not fit together. The other four, including the Results-section statement of this same comparison, agree with the Wald method to within rounding.
Further observations, not part of the main finding. The following are reported here so that a correction can address them together. I have not investigated them further.
| Quantity | Location | Reported | Check |
|---|---|---|---|
| 70-month TTP | Abstract; Results, Time-To-Event End Points | 94% (95% CI, 84 to 89) | Estimate lies outside its own CI |
| 70-month OS | Abstract; Results, Time-To-Event End Points | 92% (95% CI, 82 to 89) | Estimate lies outside its own CI |
| 70-month TTBP | Results, Time-To-Event End Points | 59% (95% CI, 66 to 76) | Estimate lies outside its own CI |
| Patients with any SLiM criterion | Results, Time-To-Event End Points, paragraph 2 | "12 [38.7%] of 31 patients" vs "18 [30.5%] of 59 patients" | 31 here vs 28 in Table 1, Table A2 and the Results paragraph quoted above; 12 + 18 = 30, against 36 biochemical progressions reported in the same section |
| Sustained uMRD 4 years after ASCT | Abstract / Discussion and Table A1 / CONTEXT box | "29 patients (31%)" / "28 patients (31%)" and "28 (31)" / "40 (44%)" | 29/90 = 32.2%; 28/90 = 31.1%; 40/90 = 44.4%. The three counts differ |
Figure
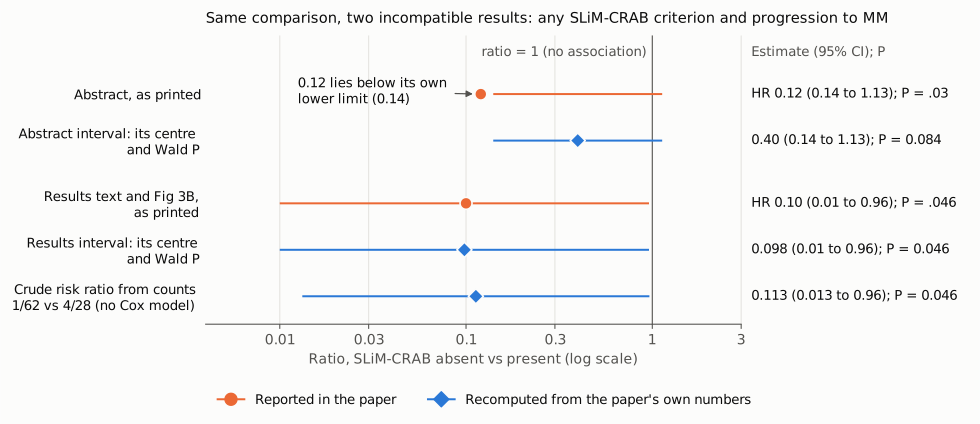
Figure 1. One comparison, any SLiM-CRAB criterion vs none and progression to MM, as printed in two places and as recomputed. Orange circles and lines show values printed in the paper; blue diamonds show values recomputed from the paper's own numbers. The abstract's point estimate (0.12) lies to the left of its own interval (0.14 to 1.13), and that interval crosses the reference line at 1. The interval's own centre is 0.40, with a Wald P of 0.084. The Results-section estimate (0.10, 0.01 to 0.96) sits at the centre of its interval and implies P = 0.046, as printed. A crude risk ratio from the counts (1/62 vs 4/28), which ignores follow-up time, lands near the Results value. The horizontal axis is logarithmic, and the vertical line marks a ratio of 1.
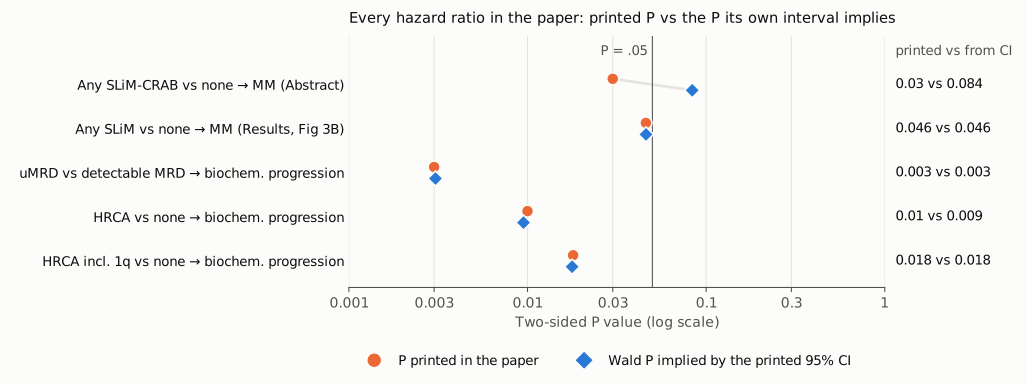
Figure 2. Every hazard ratio in the paper, comparing the printed P value (orange circle) with the Wald P implied by its printed 95% CI (blue diamond). Within each row the circle and diamond are offset slightly up and down so that both stay visible. For four of the five, the two agree to within rounding. Only the abstract's statement crosses the P = .05 line, at .03 printed against 0.084 implied by its interval. This suggests that the paper's intervals and P values otherwise follow one convention, and that the abstract figures are an exception rather than a different method.
Why it matters
The error does not touch the trial's primary end point (uMRD 3 months after ASCT, 56 of 90) or its sustained-uMRD secondary end point. Nor, on the evidence of the body text and Fig 3B, does it reverse the reported finding: the internally consistent value (HR 0.10, 95% CI 0.01 to 0.96, P = .046) has the same direction and is nominally significant.
It matters for three reasons:
- The abstract is uninterpretable as printed. A reader who has only the abstract sees an interval (0.14 to 1.13) that includes no effect, next to a claim that SLiM status "predicted" progression and a P value of .03. Read at face value, the interval says the association is not statistically significant, which contradicts the sentence it supports.
- The body values show how fragile the result is. The finding rests on 5 progression events, 4 of them in the SLiM group. Its interval spans roughly two orders of magnitude, and its P value (.046) sits just under the threshold. The Discussion uses this result, "the only feature predicting progression to MM", to support the hypothesis that early treatment of true high-risk smoldering myeloma raises the chance of operational cure. A reader should weigh it as a hypothesis-generating signal.
- The direction convention is not stated. "Presence ... predicted progression" corresponds to an HR above 1 for SLiM present vs absent. Both printed HRs are below 1, so the reference group must be the SLiM group (absent vs present). The crude proportions (1.6% vs 14.3%) support that reading, but the paper does not state it.
Explanations considered
- Rounding. This cannot explain the result. A value that rounds to 0.12 is below 0.125, and a lower limit that rounds to 0.14 is at least 0.135, so no rounding puts 0.12 inside 0.14 to 1.13. Rounding also cannot turn an interval that crosses 1 into one compatible with P < .05.
- A different test for the P value (for example log-rank, score or exact test rather than Wald). With only 5 events these tests can differ noticeably. For instance, a Fisher exact test on the crude counts gives P = 0.031. This could account for P = .03 differing from a Wald P on its own. It cannot account for a point estimate outside its own interval, or for a different HR and CI from the Results section, which also reports P = .046 for the same comparison.
- Different model, adjustment or population. The Methods name a single model for comparisons by baseline characteristics (a stratified Cox regression). The abstract and the Results both describe any SLiM criterion vs none, progression to MM, in the ITT population, and the Results cite Fig 3B. Neither text marks one value as adjusted, landmarked or from a different time point. According to the version-of-record check, the Fig 3B panel itself prints HR 0.10 (95% CI 0.01 to 0.96), P = .046, which matches the Results.
- Direction or reference-group convention. An inverted HR (1/0.12 ≈ 8.3) does not produce the interval 0.14 to 1.13 either. Both statements share the same convention (HR < 1), so the convention does not explain why they differ.
- One-sided test. No one-sided convention puts a point estimate outside its own two-sided interval. And an interval that includes 1 at the 95% level is not compatible with a two-sided P of .03.
- A single typo in the interval. If the lower limit should read 0.014, the point estimate fits (centre 0.126). But the interval would still include 1, with a Wald P of about 0.06, so the abstract would still conflict with its own P = .03. Reconciling HR 0.12 with P = .03 would need an interval of about 0.018 to 0.81, which differs from the printed one in both limits. No single-character change makes the abstract consistent.
- Text-conversion artefact. The publisher's typeset PDF, the PMC article, the Europe PMC full-text XML and the PubMed abstract all carry the same numbers, so the discrepancy is in the version of record.
Status
As of 2026-10-23:
- Version of record. ascopubs.org returned HTTP 403. The publisher's typeset PDF (JCO 2024;42:3247-3256, 14 pages including the Appendix) was read from a copy held in an institutional repository. Its abstract and Results carry the same wording and numbers as quoted above. The "P 5" in its extracted text is the journal's font glyph for "=". The PMC article (pmc.ncbi.nlm.nih.gov/articles/PMC11404760), the Europe PMC full-text XML and the PubMed record (PMID 39038268) agree.
- Supplements. There is no separate data supplement. The Appendix (Tables A1 and A2, Fig A1) is part of the article. It gives SLiM subgroup sizes and response rates but does not restate the HR for SLiM status and progression to MM. Individual patient data needed to refit the Cox model are not published.
- Corrections and notices. The project's
known.pyreturned no Crossref update, PMC notice or Europe PMC notice. The Crossref record has noupdate-toorupdated-byrelation, the PubMed record has no CommentsCorrections entries, and the PMC page shows no correction notice. A web search for an erratum or correction citing the DOI found none. - PubPeer. It could not be checked: pubpeer.com returned HTTP 403 (Cloudflare) to both the search page and the API.
- Sources: doi:10.1200/JCO.23.02771; PMC11404760; PubMed 39038268; Crossref; Europe PMC.
Suggested correction
- In the abstract, replace "hazard ratio, 0.12; 95% CI, 0.14 to 1.13; P = .03" with the values from the fitted model. If the model is the one reported in the Results and Fig 3B, these are "hazard ratio, 0.10; 95% CI, 0.01 to 0.96; P = .046".
- State the reference group for the SLiM hazard ratio (it appears to be SLiM present as reference), so that an HR below 1 reads correctly alongside "presence ... predicted progression". Consider reporting it as SLiM present vs absent (HR ≈ 10) instead.
- Given 5 events, consider stating the number of events with the HR, and describing the association as exploratory in the abstract and Discussion.
- Separately, check the 70-month TTP, OS and TTBP intervals (each excludes its own estimate). Also check the SLiM subgroup count (31 vs 28) in the biochemical-progression paragraph, and the sustained-uMRD count at 4 years (29 in the abstract, 28 in the Discussion and Table A1, 40 in the CONTEXT box).