← Back to the plain-language case
Anhedonia–TSPO correlation reported as P < 0.001 at N = 15 corresponds to P ≈ 0.1
Proc Natl Acad Sci U S A (2024) · doi:10.1073/pnas.2406005121 · PMC11363315
Summary
The association named in the title, between anhedonia severity and the LPS-induced change in TSPO availability ([11C]PBR28 VT) in the PTSD group, is reported as r = −0.425, P < 0.001 in the Results and as r = −0.45, P < 0.001 in the Fig. 2 legend, which states N = 15. For a correlation (or the slope of a simple linear regression) on 15 participants, these r values correspond to two-sided P = 0.114 and P = 0.092, and the 95% confidence interval for r includes zero in both cases (about −0.77 to +0.11). P < 0.001 would need |r| > 0.760 at N = 15, or about 51 to 57 independent participants at the reported r. No standard reading of the test that I could find (one-sided, rank-based, R², partial correlation, the N = 12 CAPS-5 subset) brings the P value near 0.001, so on the paper's own numbers the title association is not statistically significant. The main group comparison (PTSD vs. control, P = 0.021) does not depend on this test.
What the paper reports
Quotations are verbatim from the PMC-archived text (the PMC text renders the minus sign as a hyphen; the typeset text uses U+2212).
Title:
Microglia-mediated neuroimmune suppression in PTSD is associated with anhedonia
Results, "PTSD Is Associated with Lower TSPO Response to LPS Administration", paragraph 1:
In the PTSD group, greater baseline severity of anhedonia symptoms on the clinical administered PTSD scale (CAPS) was associated with a more “blunted” neuroimmune TSPO response to LPS (r = -0.425, P < 0.001) (Fig. 2).
Fig. 2 legend:
Individual data for N = 15 participants in the PTSD group demonstrating that a smaller percent change in [11C]PBR28 VT values following LPS administration was significantly associated with worse anhedonia scores from the CAPS (r = -0.45; P < 0.001) using linear regression analysis. Gray shading indicates the 95% CI for the linear regression.
Results, "Demographic and Clinical Characteristics":
Fifteen individuals who met DSM-5 criteria for PTSD participated in the study (9M and 6F).
Table 1, "Symptom scores" row:
CAPS-5 total * N = 12 | 0.6 (1.5) | 32 (11) | 10.95 | <0.001
Materials and Methods, "Trauma History Assessment":
To examine baseline PTSD symptom clusters associated with LPS-induced changes in TSPO availability, we computed sum scores of CAPS measures that assessed the seven symptom dimensions comprising the hybrid model of PTSD symptom structure (47)—intrusions, avoidance, negative affect, anhedonia, externalizing behaviors, anxious arousal, and dysphoric arousal.
Materials and Methods, "Statistical Analysis" (step 4):
Fourth, to determine whether certain PTSD symptom clusters were associated with changes in TSPO availability pre- and post-LPS administration in the PTSD group, we conducted a multivariable linear regression that included intrusion, avoidance, negative alterations in cognitions and mood, and alterations in arousal and reactivity entered as independent variables and LPS-induced changes in TSPO availability as the dependent variable.
Abstract:
Greater anhedonic symptoms in the PTSD group were associated with a more suppressed neuroimmune response.
Discussion, paragraph 3:
Another notable finding in this study is that greater severity of anhedonic symptoms in the PTSD group was associated with a more suppressed neuroimmune response.
Discussion, conclusion paragraph:
They further demonstrate a relationship between anhedonic symptoms of PTSD and neuroimmune suppression, which suggests that restoring neuroimmune function may potentially help mitigate these symptoms and serve as a treatment for PTSD.
What the paper's own numbers show
Method. The Fig. 2 legend describes a linear regression of percent change in VT on anhedonia score across N = 15 PTSD participants, reported with r. For a simple linear regression, the slope t test equals the test of Pearson's r: t = r·√(n − 2)/√(1 − r²) with n − 2 degrees of freedom. I applied it to both reported r values at n = 15 (df = 13), computed the 95% CI for r by the Fisher z transform, found the |r| and the n that P < 0.001 would need, and then repeated the test under each alternative reading listed in "Explanations considered". Every number below is printed by recompute.py.txt.
| Quantity | Location | Reported | Recomputed from the paper's own numbers |
|---|---|---|---|
| Anhedonia vs. % change VT, text | Results, "PTSD Is Associated with Lower TSPO Response…", para 1 | r = −0.425, P < 0.001 | t = −1.693, df = 13, two-sided P = 0.114 (one-sided 0.057) |
| Same association, figure | Fig. 2 legend (N = 15) | r = −0.45, P < 0.001 | t = −1.817, df = 13, two-sided P = 0.092 (one-sided 0.046) |
| 95% CI for r (Fisher z, n = 15) | derived | not reported | −0.770 to +0.112 (r = −0.425); −0.782 to +0.081 (r = −0.45) |
| |r| needed for two-sided P < 0.001 | derived, n = 15 (df = 13) | — | |t| > 4.221, i.e. |r| > 0.760 |
| n needed for P < 0.001 at the reported r | derived | — | 57 (r = −0.425); 51 (r = −0.45) |
| Fisher z test instead of t | derived, n = 15 | — | P = 0.116 / 0.093 |
| Spearman ρ = −0.45, exact permutation null | derived, n = 15 | — | P = 0.094; P < 0.001 needs |ρ| ≥ 0.775 |
| Only the 12 participants with CAPS-5 totals | Table 1, "CAPS-5 total * N = 12" | — | P = 0.168 / 0.142 (|r| > 0.823 needed) |
| 0.425 / 0.45 read as R² | alternative reading | — | r = −0.652 / −0.671, P = 0.0085 / 0.0062 |
| Partial r, 3 or 6 other covariates | Methods step 4; hybrid model | — | P = 0.168 / 0.142 (3); 0.254 / 0.224 (6) |
| Standardized β, uncorrelated predictors (best case) | Methods step 4 | — | P < 0.001 needs model R² > 0.914 (4 predictors) or > 0.957 (7 predictors) for β = −0.425 |
| 60 points treated as independent (4 regions × 15) | not described anywhere in the paper | — | P = 0.00071 / 0.00031 |
The direction and size of the association are unchanged by the recalculation: r is about −0.43 to −0.45. What changes is its significance. At n = 15 the reported P < 0.001 is not attainable for |r| below 0.760, and both reported r values are well below that. The two r values also differ from each other (−0.425 rounds to −0.43, not −0.45), but this smaller discrepancy does not matter for the conclusion, since neither value supports P < 0.001.
Figure
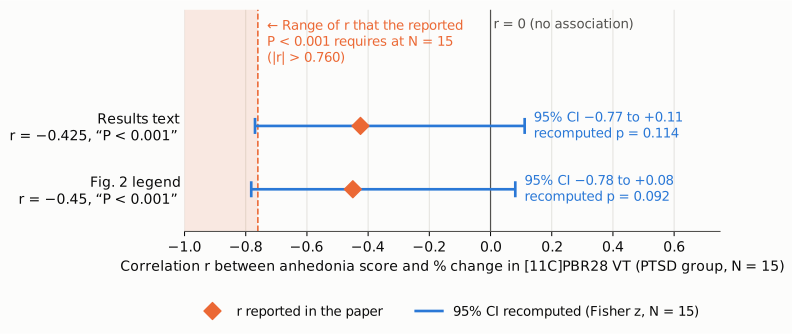
Figure 1. The anhedonia–TSPO correlation in the PTSD group (N = 15) on the r scale. Orange diamonds are the r values printed in the Results text (−0.425) and in the Fig. 2 legend (−0.45), both reported with P < 0.001. Blue intervals are 95% confidence intervals recomputed from each r with the Fisher z transform at n = 15 (−0.77 to +0.11 and −0.78 to +0.08), with the corresponding two-sided P values (0.114 and 0.092). The shaded orange region (|r| > 0.760) is the set of r values that could produce two-sided P < 0.001 with 15 participants. The thin grey line marks r = 0. Both intervals cross zero, and neither reported r is in the region the reported P value requires.
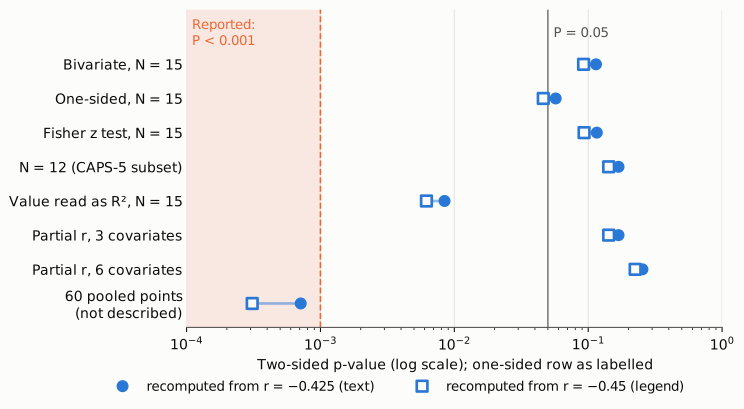
Figure 2. Recomputed P values under each alternative reading of the reported statistic, on a log scale. Filled circles use r = −0.425 (text); open squares use r = −0.45 (legend). The shaded orange region left of the dashed line is the reported P < 0.001; the grey line marks P = 0.05. Every reading that uses the stated 15 participants, or the 12 with CAPS-5 totals, gives P between 0.006 and 0.25. Only treating about 60 data points as independent (for example four regions × 15 participants, which the paper does not describe and which contradicts "N = 15" in the legend) gives P < 0.001.
Why it matters
- It is the title claim. "Neuroimmune suppression in PTSD is associated with anhedonia" rests on this one test. The same association is restated in the abstract ("Greater anhedonic symptoms in the PTSD group were associated with a more suppressed neuroimmune response"), in the abstract's closing claim that the suppressed response "is associated with the severity of symptoms", in the introduction's summary of findings, in the Discussion ("Another notable finding…"), and in the conclusion, which links it to restoring neuroimmune function as a possible treatment.
- The significance changes, not just the precision. On the paper's own numbers the association is not significant at the conventional 0.05 level (two-sided P = 0.09 to 0.11), and the 95% CI for r runs from a strong negative correlation to a weak positive one. The data are consistent with a moderate negative association, but they do not establish one.
- It was one of several symptom tests. The Methods describe sum scores for seven hybrid-model symptom dimensions, and the Results report that PCL-5, PCL-IV and full CAPS scores were not significantly correlated. No correction for multiple comparisons is described. A correction would raise the P value further.
- What is not affected. The primary result, the smaller LPS-induced TSPO increase in PTSD vs. controls (P = 0.021; Cohen d = 0.89), is a separate test and is not touched by this recalculation. The CRP–TSPO correlations also reproduce from their r and n (see the side observation below).
Explanations considered
- A different N. Not supported. The Fig. 2 legend says "N = 15 participants in the PTSD group", and Table 1 lists 15 PTSD participants. If only the 12 participants with CAPS-5 totals (Table 1) were analysed, P would be larger (0.17 / 0.14), not smaller.
- A one-sided test. Does not explain it. One-sided P is 0.057 / 0.046, still about 50 times the reported bound.
- Spearman instead of Pearson. Does not explain it. The usual t approximation for Spearman's ρ is the same formula. Under the exact permutation null at n = 15, P(|ρ| ≥ 0.45) = 0.094, and P < 0.001 needs |ρ| ≥ 0.775. The legend calls the analysis "linear regression".
- The printed value is R², not r. Does not explain it. If 0.425 or 0.45 were R², |r| would be 0.65 to 0.67 and P = 0.006 to 0.009, still not below 0.001. The text and legend both label the value r.
- A partial correlation or standardized coefficient from the multivariable model in Methods step 4. Does not explain it. Adjusting for 3 or 6 other symptom scores removes degrees of freedom and gives P = 0.14 to 0.25. A standardized β of −0.425 could reach P < 0.001 only if the whole model explained more than about 91% (4 predictors) or 96% (7 predictors) of the variance in TSPO change, even in the best case of uncorrelated predictors. Correlated symptom scores would require more. The legend describes a bivariate regression plotted with a 95% CI band, which matches a simple correlation.
- Pooling region-level values. This is the only reading I found that gives P < 0.001: about 51 to 57 or more points analysed as independent, for example four regions × 15 participants. The paper does not describe this. It defines the circuit as one gray-matter-weighted average per participant, the legend states N = 15, and such pooling would treat repeated measures from the same person as independent.
- Rounding of r. Does not explain the P value. The difference between −0.425 and −0.45 is larger than rounding, but at n = 15 any r between them gives P ≈ 0.09 to 0.11.
- A conversion or typesetting artifact. Ruled out. The PMC HTML page and the Europe PMC JATS XML both carry "r = −0.425, P < 0.001" and "r = −0.45; P < 0.001", with an encoded less-than sign and a true minus sign. The publisher's Fig. 2 image itself prints "r = -0.425, p<0.001" on the panel. Its 95% CI band is wide enough to contain a horizontal line, which is what a slope that is not significant at 0.05 looks like, and approximate readings of the plotted points give a correlation of about the printed size. So the printed r appears to describe the plotted data, and the P value is the number that does not fit.
- A correction already issued. None found (see Status).
- Side observation, not part of the main finding. In the CRP analysis the Results give r = −0.72, P = 0.019 for the PTSD subgroup (n = 10), and the Fig. 3 legend gives the same r with "P = 0.19". The recomputed value is P = 0.019, so the legend's 0.19 is very likely a typographical slip. The pooled CRP correlation (r = −0.58, n = 14) recomputes to P = 0.030, matching the text's 0.029; the legend gives 0.02. Separately, the text describes higher baseline CRP as associated with "greater severity of negative affect symptoms" but reports a negative coefficient (r = −0.61); the sign or the wording may need checking. None of these affects the main finding.
Status
- Version of record. The publisher's pages (pnas.org, reached through doi.org) returned HTTP 403 to automated requests. I checked the published text through its deposited copies: the PMC HTML page (https://pmc.ncbi.nlm.nih.gov/articles/PMC11363315/), the Europe PMC full-text JATS XML, and the publisher's Fig. 2 image from the Europe PMC supplementary bundle. All agree with the passages quoted here. Every quotation was checked verbatim against the PMC-archived text with
src/show.py. - Supplements. The only SI file,
pnas.2406005121.sapp.pdf(9 pages, "Appendix 01"), holds a cytokine time-course figure, regional VT before and after LPS (Table S1) and cytokine data (Table S2). It has no anhedonia, CAPS, correlation or regression analysis and no participant-level data. No data repository is cited. The supplement does not resolve the discrepancy. - Corrections and comments. As of 2026-10-24 I found no correction, erratum, retraction or expression of concern.
src/known.pyreturns no Crossref update relations, no PMC notices and no Europe PMC notices. The PubPeer API returned no record (HTTP 404) for the DOI, and a web search for the title with "PubPeer" found no thread. Two later items discuss the paper: a PNAS letter, "Microglia-mediated neuroimmune suppression in posttraumatic stress disorder" (doi:10.1073/pnas.2417472121, PMC11621761), which concerns the interpretation of the TSPO signal, and a research highlight in Psychoradiology (doi:10.1093/psyrad/kkaf004). Neither, as far as I could see, addresses the anhedonia statistic. - Sources. PMC article PMC11363315; Europe PMC full-text XML and supplementary files for PMC11363315; SI Appendix
pnas.2406005121.sapp.pdf; Crossref; Europe PMC; PubPeer; PMC11621761; https://journal.hep.com.cn/psyrad/EN/10.1093/psyrad/kkaf004; https://doi.org/10.1073/pnas.2406005121.
Suggested correction
The authors could report the exact test behind the anhedonia association: whether r is Pearson or Spearman, the n analysed, the degrees of freedom, any covariates, and the unit of analysis (one circuit value per participant or region-level values). If the analysis is the bivariate regression on 15 participants described in the Fig. 2 legend, the Results sentence would read
… was associated with a more “blunted” neuroimmune TSPO response to LPS (r = −0.425, P = 0.11) (Fig. 2).
with the Fig. 2 legend and panel changed to match (one r value, the same in both places, and P ≈ 0.1 rather than P < 0.001), and "significantly associated" removed from the legend. The 95% CI for r (about −0.77 to +0.11) could be added. The abstract, introduction, Discussion and conclusion statements that anhedonia, or symptom severity, is associated with a more suppressed neuroimmune response would then need to be described as a non-significant, exploratory trend, and the title revisited accordingly. Separately, the Fig. 3 legend's "P = 0.19" for the PTSD-only CRP correlation would read "P = 0.019", matching the Results.