← Back to the plain-language case
Primary-outcome 95% confidence interval is about 80 times too narrow for the reported failure counts
BMJ Glob Health (2024) · doi:10.1136/bmjgh-2023-014170 · PMC11331853
Summary
This non-inferiority trial compared spinal anaesthesia failure between trained medical officers (MOs) and consultant anaesthesiologists (CAs). It reports 7/231 (3.0%) versus 5/191 (2.6%) failures, a difference of 0.4 percentage points, with a 95% CI of 0.36–0.43% in the Abstract and Results and 0.36 to 0.44 in Table 3. From those counts, the 95% CI for the difference is −2.75 to 3.58 percentage points (Wald) or −3.29 to 3.85 (Newcombe). The printed interval is therefore about 79–90 times too narrow, and it excludes zero although the printed p = 0.7997, which the same counts reproduce exactly. The non-inferiority conclusion survives, because every recomputed upper bound stays below the 5-point margin. But the margin is cleared by about 1.2–1.4 points, not the 4.6 points the printed interval implies, and the emergent-case subgroup interval has the same defect.
What the paper reports
Abstract, Findings:
Spinal anaesthesia failure rate for MOs (7, 3.0%) was non-inferior to those of CA (5, 2.6%); difference in success rate of 0.4% (95% CI=0.36–0.43%; p=0.80).
Results, third paragraph (primary outcome):
There was no statistically significant difference in the primary outcome–delivery of spinal anaesthesia into the intrathecal space in three or fewer attempts (table 3). MOs were unsuccessful in 7 (3.0%) patients, while the CAs were unsuccessful in 5 (2.6%) patients, with a difference in success rate of 0.4% (CI=0.36–0.43%; p=0.7997).
Table 3, "Primary outcome measure: failure to deliver spinal anaesthesia". The columns are: outcome | N | Medical officers (n=231) | Consultant anaesthesiologists (n=191) | % between-group difference (95% CI) | P value. The footer reads "*Fisher’s exact test, otherwise χ2 test."
Failure to deliver spinal anaesthesia in all cases | 422 | 7 (3.0%) | 5 (2.6%) | 0.4 (0.36 to 0.44) | 0.7997
Failure to deliver spinal anaesthesia in emergent cases | 61 | 1 (3.6%) | 2 (6.1%) | -2.5 (-2.92 to -2.08) | 1.0000*
Failure due to inaccessibility of intrathecal space | 422 | 7 (3.0%) | 5 (2.6%) | 0.4 (0.36 to 0.44) | 0.7997
Table 2 gives the emergent-case denominators (columns: MO | CA | P value):
Emergency | 28 (12.2%) | 33 (17.3%) | 0.1435
Abstract, Methods, which defines the margin:
The primary outcome measure was spinal anaesthesia failure with a non-inferiority margin of 5%.
Methods, Statistical analysis, which names the analysis methods:
Patient characteristics, spinal anaesthesia failure rates and incidence of postoperative complications were analysed with T-test and Wilcoxon rank sum for continuous variables, and χ squared and Fisher’s exact tests for discrete variables.
The conclusions that rest on this result. Abstract, Interpretation:
This study demonstrates that failure rates of spinal anaesthesia care provided by trained MOs are non-inferior to care provided by CAs in low-risk surgical patients. This may support policy measures that use task-sharing as a means of expanding anaesthesia care capacity in rural Indian hospitals.
Discussion, fourth paragraph:
We believe this study may facilitate regional and national policy measures on the practical viability of task-sharing.
What the paper's own numbers show
Method. I took the failure counts and arm sizes from Table 3 (7/231 and 5/191) and the emergent-case denominators from Table 2 (28 and 33). Those emergent denominators are the only pair summing to 61 that reproduces the printed 3.6% and 6.1%. For each comparison I computed the difference in failure proportions (MO − CA) and its unpooled standard error, then the 95% CI by three standard methods for a difference of two independent proportions: Wald, Newcombe (hybrid Wilson score) and Agresti–Caffo. I also computed the uncorrected and Yates-corrected chi-square and the Fisher exact p-values, to check that the counts match the printed p-values. From the half-width of each printed interval I derived the standard error it implies under a normal approximation, and the p-value that standard error would imply. Every number below is printed by recompute.py.txt.
| Quantity | Location | Reported | Recomputed from the paper's numbers |
|---|---|---|---|
| MO failure rate, all cases | Abstract; Results; Table 3 | 7 (3.0%), n = 231 | 3.03% |
| CA failure rate, all cases | Abstract; Results; Table 3 | 5 (2.6%), n = 191 | 2.62% |
| Difference, MO − CA | Abstract; Results; Table 3 | 0.4 | 0.413 percentage points (pp) |
| p-value, all cases | Table 3; Results (0.80 in Abstract) | 0.7997 (χ²) | 0.7997, uncorrected chi-square (Yates 1.0000; Fisher 1.0000) |
| 95% CI of difference, all cases | Abstract; Results | 0.36–0.43% | Wald −2.75 to 3.58 pp; Newcombe −3.29 to 3.85; Agresti–Caffo −3.06 to 3.71 |
| 95% CI of difference, all cases | Table 3, rows 1 and 3 | 0.36 to 0.44 | as above |
| Width of the 95% CI, all cases | Table 3; Abstract | 0.08 (Table 3); 0.07 (Abstract) | 6.33 pp (Wald): 79 times the Table 3 width and 90 times the Abstract width |
| Standard error, all cases | not reported | 0.0204 pp, implied by the Table 3 interval | 1.615 pp (Wald), 79 times larger |
| p-value implied by the printed interval, all cases | derived | z = 0.40 / 0.0204 = 19.6 | p ≈ 1.6 × 10⁻⁸⁵, against the printed 0.7997 |
| Emergent cases, rates and difference | Table 3, row 2; Table 2 | 1 (3.6%) vs 2 (6.1%); −2.5 | 1/28 = 3.57%, 2/33 = 6.06%; −2.49 pp |
| 95% CI, emergent cases | Table 3, row 2 | −2.92 to −2.08 | Wald −13.14 to 8.17 pp; Newcombe −16.35 to 12.32; width 21.31 pp, 25 times the printed 0.84 |
| p-value, emergent cases | Table 3, row 2 | 1.0000 (Fisher) | Fisher 1.0000; the printed interval would imply p ≈ 1.9 × 10⁻³¹ |
| Upper 95% bound vs the 5 pp margin, all cases | Abstract; Methods | 0.43 or 0.44, leaving about 4.6 pp | 3.58 (Wald), 3.71 (Agresti–Caffo), 3.85 (Newcombe), leaving 1.42, 1.29 and 1.15 pp; non-inferiority still holds |
| Upper bound of a two-sided 90% interval (one-sided 5% test) | derived | not reported | 3.07 pp, leaving 1.93 pp |
The counts and the p-value agree exactly, so the counts are not in doubt. Only the intervals are inconsistent with them. Both printed all-cases intervals lie entirely above zero, which would mean a significant difference in favour of CAs, while the stated p = 0.80 and the text's "no statistically significant difference" say the opposite. The emergent-case interval lies entirely below zero, which would mean MOs had significantly fewer failures, while its printed p is 1.0000.
Figure
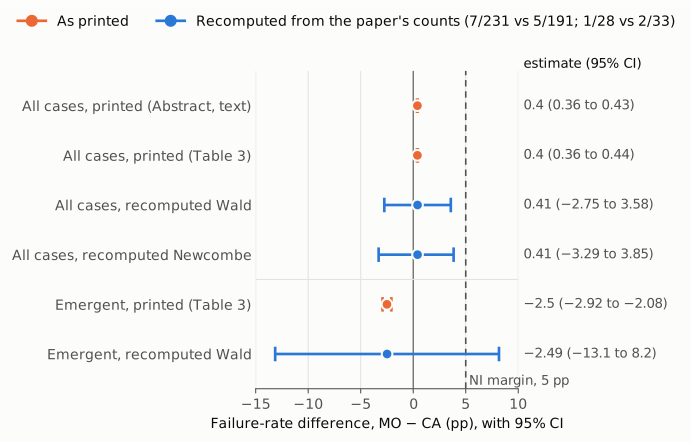
Each row shows a point estimate and its 95% confidence interval for the difference in failure rate between medical officers and consultant anaesthesiologists (MO − CA, percentage points), on a single linear axis. Orange rows are the paper's printed values: 0.4 (0.36 to 0.43) in the Abstract and Results text, 0.4 (0.36 to 0.44) in Table 3, and −2.5 (−2.92 to −2.08) for emergent cases. All three printed intervals are narrower than the plotted dot. Blue rows are recomputed from the paper's own counts (7/231 vs 5/191; 1/28 vs 2/33) with the Wald and Newcombe methods. The thin solid line marks no difference (0), and the dashed line marks the 5-point non-inferiority margin from the Methods. The recomputed all-cases intervals span zero, as the printed p = 0.7997 requires, and still end below the margin. The recomputed emergent-case interval is roughly 21 points wide and crosses both zero and the margin.
Why it matters
The confidence interval's upper bound is the statistic on which a non-inferiority trial's conclusion rests, and this one appears in the Abstract, the Results text and Table 3. As printed, it suggests that the difference in failure rates is known to within about ±0.04 percentage points. The counts support only about ±3.2 points, so the data are compatible with MOs having a failure rate up to about 3.6–3.9 points higher than CAs. Non-inferiority at the 5-point margin still holds under every standard method I checked. But the evidence is much less decisive than the printed interval suggests, and a reader using the printed interval would overstate it. That matters because the Interpretation and Discussion present the trial as support for regional and national task-sharing policy.
The printed intervals also contradict the paper's own tests. An interval that excludes zero cannot accompany p = 0.80, so a reader cannot tell from the paper which of the two to believe without recomputing. In the emergent-case subgroup, the printed interval implies that MOs were reliably better in emergencies. Recomputed, the subgroup (61 patients, 3 failures) is uninformative in either direction. Any later meta-analysis or sample-size calculation that took the printed interval or its implied standard error at face value would understate the uncertainty about 80-fold.
Explanations considered
- Different population or denominator. This does not account for the numbers. The Abstract, the Results text and Table 3 rows 1 and 3 all use the same 422 patients and the same 7/231 versus 5/191. The emergent denominators (28 and 33) come from Table 2 and reproduce the printed percentages.
- Scale: proportion versus percentage points. This does not account for the numbers. The estimate 0.4 is in percentage points (0.004 as a proportion). On the proportion scale the Wald interval is −0.028 to 0.036, and on the percentage-point scale it is −2.75 to 3.58. Neither resembles 0.36 to 0.44.
- Ratio rather than difference. This does not account for the numbers. A risk-ratio interval would be centred near 1.16 and contain 1 (0.37 to 3.59), not sit around 0.4. The column heading reads "% between-group difference (95% CI)".
- One-sided or 90% interval. This does not account for the numbers. The upper bound of a two-sided 90% interval (equivalent to a one-sided 5% test) is 3.07 pp, still about seven times the printed 0.44.
- Choice of interval method. This does not account for the numbers. Wald, Newcombe and Agresti–Caffo intervals all span zero and run from about −3 to +4 pp. The paper does not name its interval method.
- Adjusted or stratified analysis. This does not account for the numbers. The Statistical analysis section lists only t-tests, Wilcoxon rank-sum, chi-square and Fisher's exact tests, with no regression, stratification or clustering, and none of these would shrink a standard error about 79-fold. The printed p = 0.7997 matches an unadjusted, uncorrected chi-square on these counts to four decimals, which confirms that the unadjusted 2 × 2 table was analysed.
- Rounding or typesetting. This does not account for the numbers. The interval appears three times in two forms (0.36–0.43% and 0.36 to 0.44), with ordinary decimal points, and the emergent row keeps its minus signs. A width error of this size cannot come from rounding.
- A possible arithmetic route (diagnostic only). If the estimate is kept in percentage points but the standard error is used as a proportion, 0.413 ± 1.96 × 0.0161 gives 0.38 to 0.44, and 0.4 ± 1.96 × 0.0161 gives 0.37 to 0.43. These are close to the printed all-cases intervals. The same route applied to the emergent row gives −2.60 to −2.38, not the printed −2.92 to −2.08. So this route does not explain every printed interval, and the actual computation cannot be identified without the analysis code. Either way, the printed intervals cannot be reconciled with the printed counts.
- Wording "difference in success rate". This is a separate, minor point. The Abstract and Results call 0.4 a "difference in success rate", but 3.0% − 2.6% is a difference in failure rates. A difference in success rates (MO − CA) would be −0.4. This affects the sign convention, not the width problem.
Status
- Version of record. The publisher's pages (gh.bmj.com, reached from the DOI, including the full-text, PDF and info pages) returned HTTP 403 to automated access, and the PMC HTML page showed only a CAPTCHA. I therefore checked the publisher-deposited JATS XML from Europe PMC against the PMC archive used here. The two agree word for word at every quoted place: the Abstract's "0.36–0.43%", the Results' "(CI=0.36–0.43%; p=0.7997)", and Table 3's three rows, each value in its own table cell. Every quote above was confirmed verbatim against the PMC-archived text.
- Supplements and data. The JATS XML lists no supplementary material, and the Europe PMC supplementary-files bundle holds only Figure 1. The data availability statement offers de-identified data on request, so no public dataset exists. The ClinicalTrials.gov record NCT04438811 is marked completed with no posted results. No source was available to reconstruct the authors' interval method, and none is needed, because the counts in Table 3 are enough to show that the printed intervals are impossible.
- Corrections and comments. As of 2026-10-23 I found no correction, erratum, expression of concern or retraction. Crossref lists no update relations for the DOI, and PMC and Europe PMC list no correction or comment links (PMID 39153752). A web search for the title with "correction" returned only the article and index listings. The PubPeer API request for the DOI was blocked by a Cloudflare challenge, so I could not determine whether PubPeer has comments on this article.
- Sources. PMC article PMC11331853; Europe PMC full-text XML for PMC11331853; Europe PMC supplementary-files endpoint; ClinicalTrials.gov NCT04438811; Crossref; DOI landing page https://doi.org/10.1136/bmjgh-2023-014170 (publisher page not reachable).
Suggested correction
- Replace the 95% CI for the all-cases difference in the Abstract, the Results text and Table 3 (rows 1 and 3) with an interval computed from 7/231 versus 5/191. For example, the Wald interval is −2.75 to 3.58 percentage points and the Newcombe interval is −3.29 to 3.85. State which method is used.
- Replace the emergent-case interval in Table 3 (row 2), for example with the Wald interval −13.1 to 8.2 or the Newcombe interval −16.4 to 12.3 percentage points.
- Report the non-inferiority comparison explicitly, as the corrected upper bound against the 5-point margin. State whether the test is one-sided at 2.5% (95% CI) or at 5% (90% CI, upper bound 3.07).
- Make the Abstract, the Results text and Table 3 agree. They currently give 0.43 and 0.44 as the upper bound.
- Describe 0.4 as a difference in failure rates (MO − CA), or report −0.4 if it is meant as a difference in success rates.
- Review the wording of the Interpretation and Discussion in light of the wider interval: non-inferiority holds, but with about 1.2–1.4 points of headroom rather than about 4.6.