← Back to the plain-language case
Abstract's tissue-culture counts (1/6, 6/6) conflict with the paper's Results and design (2/8, 8/8)
Proc Natl Acad Sci U S A (2024) · doi:10.1073/pnas.2318627121 · PMC11331133
Summary
The abstract reports the study's postmortem tissue-culture result as MAP-positive tissue in "1 out of 6" phage-treated calves and "6 out of 6" infected control calves. The Methods and the Fig. 1 legend assign 8 calves to each infected group, and the Results, using the same 49-day tissue culture and duplex qPCR at the single necropsy (16 weeks post-inoculation), report 8 MAP-positive calves in the MAP-only group and 2 in the phage-treated group, which is 8/8 and 2/8, with no calf reported as excluded. The direction and significance of the protective effect are unchanged (recomputed Fisher exact p = 0.015 for the abstract's counts, 0.0070 for the Results'), but the abstract understates the infected calves in each group as 6 rather than 8, and puts residual infection in the phage-treated group at 16.7% (1 calf) rather than 25.0% (2 calves).
What the paper reports
Abstract, the postmortem result:
Postmortem tissue culture analysis further supported the effectiveness of MPs, with only 1 out of 6 animals in the phage-treated group testing positive for MAP colonized tissues compared to 6 out of 6 animals in the infected control group.
Results, "Oral Administration of Phages Prevented Establishment of MAP Infection in Intestinal Tissues", first paragraph:
To quantify the prevention of infection, MAP infection status was measured in intestinal tissues with high sensitivity (20) via duplex qPCR after samples were cultured for 49 d.
Within the MAP-only group, there were eight MAP-positive calves, each with 3 to 6 positive tissue types (Fig. 4A). However, in the phage-treated group, only two calves were MAP positive, with only one positive tissue type each.
Therefore, MP administration strongly reduced MAP-positive tissues (P value > 0.01) and provided almost complete protection against MAP infection.
Materials and Methods, "Study Design":
The first eight calves were designated the MAP-inoculated control group (MAP-only group). The next eight calves to arrive were designated the phage-treated MAP infection group (phage-treated group). The last three calves were designated the uninfected control (control).
Fig. 1 legend:
Newborn dairy calves (n = 19) were collected within 12 h of birth and randomly assigned into three groups: MAP-only (n = 8), phage-treated (n = 8), and control (n = 3).
Materials and Methods, "Inoculum":
Pellets were prepared per group (n = 8) per day.
Materials and Methods, "Necropsies and Tissue Cultures":
Calves were killed 16 wk postinoculation
Six tissue samples per calf were obtained: ileum, distal jejunum, ileocecal valve, and their associated lymph nodes.
The only "6 out of 8" in the paper concerns phage recovery, not MAP. Results, "Phages Were Persistent in the Small Intestine...":
MPs were detected in both the ileum and jejunum of 6 out of 8 of the phage-treated calves. The inability to recover MPs from the tissues of two calves was attributed to a documented sampling error with these specific samples
The only exclusions reported are for the blood assay. Results, first section:
Two samples were excluded from our results based on cell viability assessments (19).
The conclusion that rests on the tissue result, Discussion, first sentence:
This study demonstrated the ability of MPs to provide almost complete protection against MAP infection and the ability to eliminate fecal shedding by calves.
What the paper's own numbers show
Method. I took the group sizes from the Methods and the Fig. 1 legend and the numbers of MAP-positive calves from the Results text. I computed animal-level positivity for each group, with exact (Clopper–Pearson) 95% intervals, and did the same for the abstract's counts. For both versions I computed the risk difference, the relative reduction and a two-sided Fisher exact test on the 2×2 table. The paper itself reports only per-tissue chi-square tests, so the Fisher test is my addition and serves only to compare the two versions. I worked out which calves would have to be left out to turn the Results' counts into the abstract's. As a cross-check on the per-calf counts, I read the bar heights of the paper's Fig. 4A, which gives the number of positive animals for each tissue type. Every number below is printed by recompute.py.txt.
| Quantity | Location | Reported | Recomputed from the paper's numbers |
|---|---|---|---|
| Calves per group | Methods; Fig. 1 legend; Inoculum | MAP-only 8, phage-treated 8, control 3; total 19 | 8 + 8 + 3 = 19, consistent; 16 infected calves |
| Phage-treated calves with MAP-positive tissue | Abstract | 1 out of 6 | 16.7% (exact 95% CI 0.4–64.1%) |
| Phage-treated calves with MAP-positive tissue | Results, tissue paragraph | "only two calves were MAP positive" | 2/8 = 25.0% (exact 95% CI 3.2–65.1%) |
| Infected-control calves with MAP-positive tissue | Abstract | 6 out of 6 | 100% (exact 95% CI 54.1–100%) |
| MAP-only calves with MAP-positive tissue | Results, tissue paragraph | "eight MAP-positive calves" | 8/8 = 100% (exact 95% CI 63.1–100%) |
| Risk difference, phage minus control | derived | — | abstract −83.3 points; Results −75.0 points |
| Relative reduction in positive calves | derived | — | abstract 83.3%; Results 75.0% |
| Fisher exact test, two-sided | derived (not in the paper) | — | abstract [[1, 5], [6, 0]] p = 0.0152; Results [[2, 6], [8, 0]] p = 0.0070 |
| Calves that would have to be left out to get the abstract's counts | derived | — | phage-treated: 1 positive and 1 negative; MAP-only: 2 positives |
| Most MAP-only animals positive in any one tissue type | Fig. 4A (read from image) | 8 (jejunum LN) | consistent with 8 positive calves of 8 |
| MAP-only positive tissues, summed over the six types | Fig. 4A (read from image) | 7, 7, 6, 7, 8, 3 | 38 over 8 calves = 4.75 per calf, consistent with "3 to 6 positive tissue types" each |
| Phage-treated positive tissues | Fig. 4A (read from image) | jejunum 1, ileocecal valve 1 | 2 tissues in 2 different tissue types, consistent with "two calves ... one positive tissue type each" |
The Results text, the Methods group sizes and Fig. 4A agree with each other: 8 of 8 MAP-only calves and 2 of 8 phage-treated calves had at least one MAP-positive tissue. The abstract is the only place where the result appears as 1/6 and 6/6.
Three smaller inconsistencies turned up during the check. None affects the claim above or any conclusion.
| Quantity | Location | Reported | Recomputed / note |
|---|---|---|---|
| MAP-only fecal shedding "increased from 60 to 100%" | Results, fecal shedding | 60% | 60% of 8 = 4.8 calves, not a whole number. Fig. 3 shows 3/8 = 37.5% (F57) or 5/8 = 62.5% (IS900) at 10 wk PI, and 8/8 at 16 wk |
| Significance of the tissue reduction | Results, tissue paragraph | "(P value > 0.01)" | inconsistent with "strongly reduced"; Fig. 4A marks the significant tissue types with asterisks, so "<" was probably meant |
| qPCR positivity cutoff | Methods "qPCR Procedure"; Fig. 4 legend; Fig. 3 legend | "Ct values ≤ 37 considered positive"; "Ct < 37"; "Ct ... >37.0" | the Fig. 3 legend reverses the direction of the cutoff |
Figure
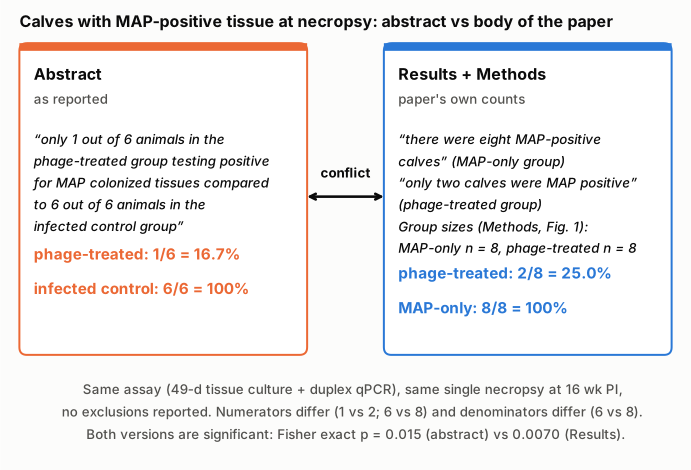
Figure 1. The abstract's sentence (left, orange) and the corresponding statements in the Results and Methods (right, blue), with the proportions each implies. The two panels refer to the same assay (49-day tissue culture followed by duplex F57/IS900 qPCR) and the same single necropsy at 16 weeks post-inoculation, and the paper reports no calf excluded from it. The numerators disagree (1 vs 2 positive phage-treated calves; 6 vs 8 positive infected controls), and so do the denominators (6 vs the 8 calves enrolled per group). The Fisher exact p-values at the bottom were recomputed from each pair of counts; the paper does not report them.
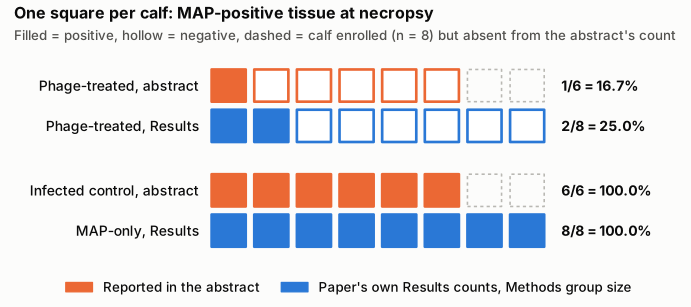
Figure 2. One square per calf. Filled squares are calves with MAP-positive tissue, hollow squares are calves without, and dashed outlines are calves enrolled in the group (n = 8, Methods and Fig. 1 legend) that the abstract's count leaves out. Orange rows are the abstract's counts. Blue rows are the Results' counts set against the Methods group size. Going from the Results to the abstract takes away one positive and one negative calf in the phage-treated group and two positive calves in the infected control group.
Why it matters
The postmortem tissue result is the study's direct measure of infection, and the abstract is where most readers, and abstracting services, will take it from. As published, the abstract:
- Misstates the sample size. It describes two groups of 6 animals (12 in total) where the study enrolled two infected groups of 8 (16 in total). A reader using the abstract would take the study to be smaller than it was.
- Overstates the protective effect somewhat. It puts residual infection in the phage-treated group at 1 calf (16.7%) instead of 2 (25.0%), and the relative reduction at 83.3% instead of 75.0%. With groups this small, each calf moves the proportion by 12.5 points.
- Does not change the qualitative conclusion. Both versions show a large reduction in the same direction, and both are significant by Fisher's exact test (p = 0.015 and p = 0.0070). The exact 95% intervals for the phage-treated proportion are wide either way (0.4–64.1% and 3.2–65.1%). The title, the Significance statement, the Discussion and the Conclusion state the effect qualitatively and are not affected. The fecal-shedding result is separate and is also not affected.
So this is an error in a headline number, not in the study's main finding. It matters for anyone who quotes the abstract's figures, pools them in a meta-analysis or uses them to plan a follow-up study's sample size.
Explanations considered
- Some calves were excluded from the tissue analysis. This does not account for the numbers. The paper reports no death, removal or exclusion of any calf. All calves were killed at 16 weeks post-inoculation, and six tissues were taken from each. The only exclusions mentioned are two or three blood samples for the IFN-γ assay. Even if exclusions had happened, getting from 2/8 to 1/6 means leaving out exactly one positive and one negative phage-treated calf, and getting from 8/8 to 6/6 means leaving out two positive controls. Nothing in the paper describes such a selection, and the Results text itself counts 8 and 2 positive calves.
- The abstract refers to the 6 phage-treated calves from which phages were recovered. This does not account for the numbers. That "6 out of 8" is phage recovery from tissue, with two calves lost to a sampling error. It cannot apply to the infected control group, which received no phage, and the paper does not report MAP status for that subset.
- The abstract uses a different assay. This does not account for the numbers. The abstract says "postmortem tissue culture analysis", which is the 49-day culture plus duplex qPCR behind the Results' 8 and 2 positive calves (Fig. 4A). The direct-extraction F57 data (Fig. 4B and 4C) show a similar per-tissue pattern and give no per-calf count that would give 1/6 or 6/6.
- The abstract uses a different time point. This does not account for the numbers. There is a single necropsy, at 16 weeks post-inoculation.
- The 6 refers to the six tissue types, not to animals. This partly matches the numbers. Fig. 4A shows positive tissue in all 6 tissue types in the MAP-only group, which would give "6 out of 6". In the phage-treated group, however, the two positive tissues were in two different tissue types (jejunum and ileocecal valve), so the same reading gives 2/6, not 1/6. The abstract also says "animals" explicitly. This reading therefore reconciles neither figure as written.
- A conversion or typesetting artifact. This is excluded. The numbers are plain inline integers and words ("1 out of 6", "eight", "two"). They appear identically in the JATS XML from Europe PMC, the PMC HTML page and the PMC archive used here.
- The error was corrected later. As of 2026-10-23 no correction has been issued (see Status).
Status
- Version of record. The abstract sentence and the Results sentences quoted above appear word for word in the Europe PMC full-text XML (the JATS version of record) and on the PMC HTML page, and they match the PMC archive used for this check. The publisher's page on pnas.org returned HTTP 403 to automated access. Every quote above was checked verbatim against the PMC-archived text. The Fig. 3A/3B and 4A counts were read from the PMC copies of the figure images (pnas.2318627121fig03.jpg and pnas.2318627121fig04.jpg).
- Supplements. The SI Appendix (pnas.2318627121.sapp.pdf, 2 pages, from the Europe PMC supplementary-files bundle) holds Supplementary Table 1, which lists phage presence in fecal and tissue samples for each animal. It numbers the calves 1–8 (MAP-only), 9–16 (phage-treated) and 17–19 (uninfected control), which confirms the group sizes of 8. It gives no MAP tissue results, so it does not reconcile the abstract with the Results.
- Corrections and comments. Crossref lists no update relations for the DOI. PMC and Europe PMC (PMID 39102547) list no correction, erratum, expression of concern or retraction. The PubPeer API and search page refused automated access (HTTP 403 / Cloudflare challenge), so PubPeer could not be checked directly. A web search for the title with "pubpeer" returned no PubPeer page.
- Sources. PMC article PMC11331133; Europe PMC full-text XML and supplementary files; Crossref; Europe PMC record PMID 39102547; web search. Checked as of 2026-10-23.
Suggested correction
- Change the abstract sentence to match the Results and the design, for example: "Postmortem tissue culture analysis further supported the effectiveness of MPs, with only 2 out of 8 animals in the phage-treated group testing positive for MAP colonized tissues compared to 8 out of 8 animals in the infected control group." If the abstract's figures came from a different analysis or subset, state that analysis and its denominators in the Methods and Results instead.
- Minor: correct "(P value > 0.01)" in the tissue paragraph, presumably to "<"; give the MAP-only fecal-shedding proportions as counts out of 8 (for example 5/8 at 10 weeks by IS900, or 3/8 by F57), since 60% is not a possible proportion of 8 calves; and change "Ct value of >37.0" in the Fig. 3 legend to match the Methods ("≤ 37").