← Back to the plain-language case
Abstract gives the unknown-IVS and incident-TB mortality estimates as poor IVS and prior TB
Lancet Reg Health Eur (2024) · doi:10.1016/j.lanepe.2024.100989 · PMC11259909
Summary
This EuroSIDA cohort study of 20,364 people with HIV reports adjusted incidence rate ratios (aIRRs) for all-cause mortality. The abstract gives three of them as headline risk factors: off ART 2.42 (2.14–2.74), poor immunologic-virologic status (IVS) 4.2 (3.39–5.20) and prior TB 3.33 (2.75–4.03). In the paper's own Table 2 and Results text, the triple 4.2 (3.39–5.20) is the estimate for unknown IVS, while poor IVS is 7.61 (6.68–8.68). The triple 3.33 (2.75–4.03) is the estimate for TB diagnosed during follow-up, while TB before baseline is 1.45 (1.26–1.67). The abstract therefore understates the poor-IVS association by 45% and overstates the prior-TB association 2.3-fold. Every risk factor stays above 1 and statistically significant, so the paper's qualitative conclusions hold. The abstract also gives region-interaction p-values (IVS p = 0.02, TB p = 0.5) that differ from the Results (p = 0.001 and p = 0.22).
What the paper reports
Abstract, Findings:
Being off ART (aIRR 2.42; 95% CI 2.14–2.74), poor IVS (aIRR 4.2; 95% CI 3.39–5.20) and prior TB (aIRR 3.33; 95% CI 2.75–4.03) were associated with higher all-cause mortality. For all-cause mortality the effect of ART (test for interaction: p < 0.001) and IVS (p = 0.02), but not TB (p = 0.5) varied across regions.
Abstract, Interpretation:
A poor IVS, being off ART and prior active TB were related to higher mortality.
Abstract, Methods (the IVS categories):
Immunologic-virologic status (IVS) was categorized as poor (CD4-cell count ≤350 cells/mm3 and viral load (VL) > 200 copies/ml), good (CD4 ≥ 500 and VL < 200), or intermediate (remaining combinations). Participants missing either CD4-cell count or VL were categorized as unknown.
Methods, "Variable selection" (the TB categories):
history of active TB was classified as no history of TB, TB pre-baseline (or at baseline), and incident TB during follow-up
Results, "Risk factors for all-cause mortality":
The most important risk factors for all-cause mortality in the adjusted multivariable model were poor IVS (vs good IVS; aIRR 7.61; 95% CI 6.68–8.68) or unknown IVS (aIRR 4.20; 95% CI 3.39–5.20), incident active TB during follow-up (aIRR 3.33; 95% CI 2.75–4.03), being off ART (aIRR 2.42; 95% CI 2.14–2.74), and receiving care in Eastern Europe (vs. Western Europe; aIRR 1.55; 1.40–1.71).
Results, "Effect of ART-status, IVS and active TB on mortality across regions":
We also observed significant interactions on the risk of all-cause mortality between region of Europe and ART-status (p < 0.001 for interaction) and IVS (p = 0.001) but not for active TB (p = 0.22).
Table 2 ("Risk factors for all-cause and AIDS-related mortality in univariable and multivariable adjusted Poisson regression models"), all-cause columns, IRR (95% CI) | aIRR (95% CI):
Poor | 8.54 (7.63, 9.57) | 7.61 (6.68, 8.68)
Unknown | 4.26 (3.51, 5.18) | 4.2 (3.39, 5.2)
Off ART | 3.91 (3.5, 4.37) | 2.42 (2.14, 2.74)
History of TB, pre-baseline | 1.76 (1.53, 2.02) | 1.45 (1.26, 1.67)
Incident TB during follow-up | 5.55 (4.63, 6.65) | 3.33 (2.75, 4.03)
Eastern | 1.55 (1.4, 1.71) | 1.5 (1.33, 1.69)
Discussion:
The most important risk factors for all-cause mortality in the adjusted multivariable model were poor or unknown IVS, being off ART, and pre-baseline as well as incident active TB during follow-up.
What the paper's own numbers show
Method. No model needs to be refitted: this is a matching check. For each of the abstract's three estimates I searched Table 2's all-cause columns (adjusted and unadjusted) for a row whose point estimate and both confidence limits agree within rounding (±0.005). I then compared each abstract value with the Table 2 row that its label names. To confirm that each Table 2 row is internally coherent, I checked that each estimate equals the geometric mean of its CI limits, as a log-scale Wald interval from a Poisson model requires. To show that the swapped rows are distinct estimates, not near-duplicates, I computed an approximate z for each pair from the standard errors implied by the CIs, SE = (ln hi − ln lo)/(2 × 1.96). This ignores the covariance between coefficients and is only illustrative. Every number below is printed by recompute.py.txt.
| Quantity | Location | Reported | Recomputed from the paper's numbers |
|---|---|---|---|
| "poor IVS" aIRR | Abstract, Findings | 4.2 (3.39–5.20) | Matches only Table 2 Unknown IVS, 4.2 (3.39, 5.2). Table 2 Poor IVS is 7.61 (6.68–8.68) |
| "prior TB" aIRR | Abstract, Findings | 3.33 (2.75–4.03) | Matches only Table 2 Incident TB during follow-up. Table 2 pre-baseline TB is 1.45 (1.26–1.67) |
| "off ART" aIRR (control) | Abstract, Findings | 2.42 (2.14–2.74) | Matches Table 2 Off ART, the row its label names |
| Row coherence, estimate vs sqrt(lo × hi) | Table 2 | 7.61; 4.20; 1.45; 3.33; 2.42 | 7.61; 4.20; 1.45; 3.33; 2.42 (all coherent) |
| Poor IVS: Table 2 / abstract | derived | — | 7.61 / 4.20 = 1.81; abstract is 44.8% lower |
| Poor IVS excess risk (aIRR − 1) | derived | 3.20 (abstract) | 6.61 (Table 2); abstract gives 48% of it |
| Prior TB: abstract / Table 2 pre-baseline | derived | — | 3.33 / 1.45 = 2.30-fold |
| Prior TB excess risk (aIRR − 1) | derived | 2.33 (abstract) | 0.45 (Table 2); abstract is 5.2-fold larger |
| CI overlap, abstract vs correctly labelled row | derived | — | none for poor IVS (5.20 < 6.68) or prior TB (2.75 > 1.67) |
| Approximate z, poor vs unknown IVS | derived | — | 4.64 |
| Approximate z, incident vs pre-baseline TB | derived | — | 6.86 |
| Supplement all-cause aIRRs (Tables S1, S2, S4) | mmc1.docx | — | poor IVS 6.80–10.25; pre-baseline TB 1.21–1.99; none equals 4.20 or 3.33 for these categories |
| Region × IVS interaction p | Abstract vs Results | 0.02 (Abstract) | 0.001 (Results) |
| Region × TB interaction p | Abstract vs Results | 0.5 (Abstract) | 0.22 (Results) |
| Eastern vs Western Europe "aIRR" | Results text vs Table 2 | 1.55 (1.40–1.71) | This is the unadjusted IRR in Table 2. The adjusted value is 1.50 (1.33–1.69) |
Off ART, the control, maps to its own row, so the abstract was drawn from the same adjusted all-cause column. The other two triples each match exactly one row of that column, but not the row their label names. The Results text, Table 2 and the Discussion agree with each other and disagree with the abstract.
Figure
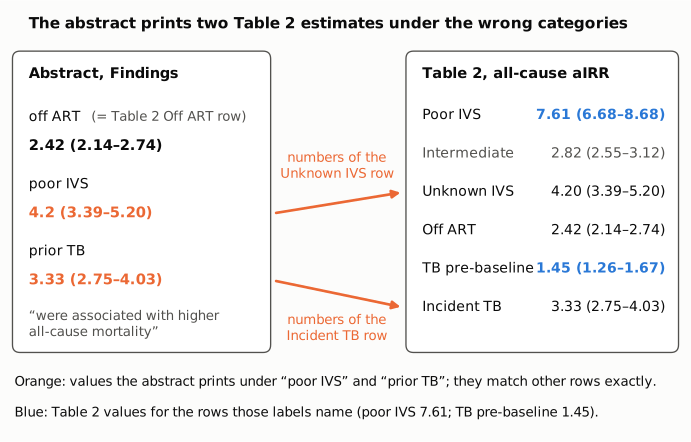
Figure 1. Left: the three all-cause aIRRs in the abstract's Findings, with their labels. Right: the corresponding rows of Table 2's adjusted all-cause column, in table order. The off-ART value (black) matches the Off ART row. The values printed as "poor IVS" and "prior TB" (orange) match, in estimate and both CI limits, the Unknown IVS and Incident TB rows (arrows). The Table 2 values for the rows those labels actually name (blue) are 7.61 (6.68–8.68) for poor IVS and 1.45 (1.26–1.67) for pre-baseline TB. They appear nowhere in the abstract.
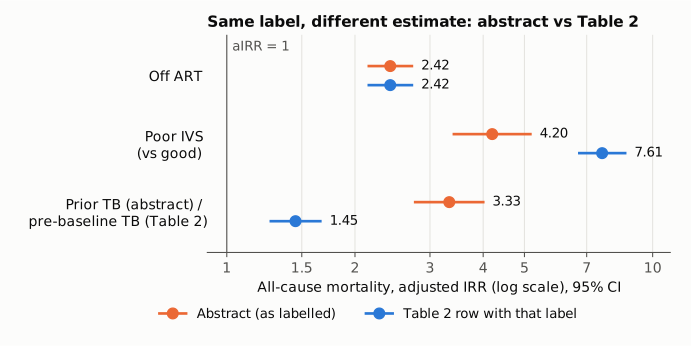
Figure 2. For each of the abstract's three all-cause risk factors, the orange interval is the aIRR and 95% CI the abstract gives, and the blue interval is the Table 2 aIRR for the category the label names. The axis is logarithmic; the thin line marks aIRR = 1. For off ART the two coincide. For poor IVS and prior (pre-baseline) TB the intervals do not overlap: the abstract understates the poor-IVS association and overstates the prior-TB association. All six intervals lie above 1, so no association changes direction or significance.
Why it matters
The abstract is the part of the paper that most readers, indexers and guideline reviewers use. Its Findings sentence gives exactly three quantified all-cause risk factors, and two of them are paired with the wrong category.
- Poor IVS. A reader of the abstract would conclude that poor immunologic-virologic control carries about a fourfold mortality rate. The paper's own estimate is about 7.6-fold, and its excess risk is roughly twice what the abstract implies. The abstract number belongs to people whose CD4 count or viral load is missing. That group matters in its own right: the Interpretation highlights Eastern Europe's high share of "poor or unknown IVS". Presenting the unknown-IVS estimate as poor IVS removes the distinction the paper draws.
- Prior TB. "Prior TB" and the Interpretation's "prior active TB" suggest a history of TB before entry, which the Methods call "TB pre-baseline (or at baseline)". That category has an aIRR of 1.45. The value of 3.33 belongs to TB diagnosed during follow-up, a different exposure with different clinical implications: an active disease episode rather than a past history. The abstract thus overstates the long-term mortality burden of a TB history and does not report the larger incident-TB effect under its own name.
- Interaction p-values. The abstract's IVS interaction (p = 0.02) is weaker, and its TB interaction (p = 0.5) less suggestive, than the Results report (p = 0.001 and p = 0.22). The significant/non-significant classification is the same in both places.
The study's main conclusions are not affected. Mortality fell over time, it remained higher in Eastern Europe, and poor IVS, being off ART and TB are associated with higher mortality. The Research-in-context panel, the Results, Table 2 and the Discussion all state these correctly. The separate Results statement that Eastern Europe has "aIRR 1.55; 1.40–1.71" uses the unadjusted IRR. The adjusted value, 1.50 (1.33–1.69), differs only slightly and does not change the conclusion.
Explanations considered
- The abstract reports a different model, period or region. This does not account for the numbers. The abstract calls them all-cause aIRRs, and all three match Table 2's adjusted all-cause column exactly, one of them (off ART) on the correct row. The stratified and sensitivity estimates in the supplement are all different numbers. Poor IVS ranges from 6.80 to 10.25 and pre-baseline TB from 1.21 to 1.99 across Tables S1 (by period), S2 (by region) and S4 (February 2020 cut-off). No supplementary estimate for those categories equals 4.20 or 3.33.
- "Poor IVS" in the abstract includes unknown IVS. This does not account for the numbers. The abstract's own Methods define poor, good, intermediate and unknown as separate categories, and Table 2 and the Results give each its own estimate. The value 4.2 (3.39–5.20) is the unknown row alone, not a pooled estimate.
- "Prior TB" loosely means any TB diagnosed before death, including incident TB. This is possible as wording, but it does not fully account for the numbers. The paper defines three TB categories, and "prior" corresponds most naturally to "pre-baseline". Even on the loose reading, the abstract would be reporting only the incident-TB estimate under a label that also covers pre-baseline TB, whose effect (1.45) is very different (approximate z = 6.86). The poor-IVS mismatch stands independently of this point.
- Rounding or a typographical slip in a single number. This does not account for the numbers. In each case all three numbers (estimate and both limits) are identical to another row, and each Table 2 row is internally coherent (estimate = sqrt(lo × hi)). The two estimates in each pair differ clearly (approximate z = 4.64 and 6.86).
- A conversion or typesetting artefact in the archived copy. This is excluded. The PMC text, the Europe PMC full-text XML, the PubMed abstract and the Elsevier-typeset PDF all carry the same abstract sentence and the same Table 2 rows.
- A published correction. None was found (see Status).
Status
- Version of record. I checked three copies, and all give identical numbers. The first is the Elsevier-typeset publisher PDF (27 pages; metadata "The Lancet Regional Health - Europe, 44 (2024) 100989", created 2024-06-25) held in an institutional repository. The second is the Europe PMC full-text XML, with Table 2 parsed from its table cells. The third is the PubMed abstract (PMID 39036304). The thelancet.com and sciencedirect.com pages returned HTTP 403 to automated access. Every quotation above was confirmed verbatim against the PMC-archived text with
src/show.py. - Supplements. I parsed the supplementary appendix (mmc1.docx, from the Europe PMC supplementary-files archive). It holds Table S1 (aIRRs by time period), S2 (by region), S3 (person-years), S4 (sensitivity analysis with a February 2020 cut-off) and S5 (CD4 and viral-load measurement rates). No table gives poor IVS as 4.2 (3.39–5.20) or prior/pre-baseline TB as 3.33 (2.75–4.03). The supplement does not resolve the discrepancy.
- Corrections and comments. As of 2026-10-24 I found no correction, erratum, expression of concern or retraction. Crossref lists no update relations for the DOI, and PMC and Europe PMC list no correction notices. A web search for corrections or comments on the article found none. The PubPeer API refused automated access (HTTP 403), so PubPeer could not be checked directly.
- Sources. PMC article PMC11259909; Europe PMC full-text XML and supplementary files for PMC11259909; PubMed 39036304; publisher PDF (repositoriosaludmadrid.es); Crossref; Europe PMC.
Suggested correction
- Abstract, Findings: replace "poor IVS (aIRR 4.2; 95% CI 3.39–5.20) and prior TB (aIRR 3.33; 95% CI 2.75–4.03)" with "poor IVS (aIRR 7.61; 95% CI 6.68–8.68), unknown IVS (aIRR 4.20; 95% CI 3.39–5.20), TB before baseline (aIRR 1.45; 95% CI 1.26–1.67) and incident TB during follow-up (aIRR 3.33; 95% CI 2.75–4.03)", or an equivalent wording that pairs each estimate with its Table 2 category.
- Abstract, Interpretation: replace "prior active TB" with wording that matches the corrected Findings, such as "active TB before or during follow-up".
- Abstract, Findings: reconcile the region-interaction p-values with the Results (IVS p = 0.001, TB p = 0.22), or explain which test each refers to.
- Results, "Risk factors for all-cause mortality": give the adjusted Eastern vs Western Europe estimate as aIRR 1.50 (95% CI 1.33–1.69), as in Table 2, or label 1.55 (1.40–1.71) as unadjusted.