← Back to the plain-language case
Abstract reports Table 2's other-respiratory-infection hazard ratios as the COVID-19 severity and mortality estimates
eLife (2024) · doi:10.7554/eLife.94973 · PMC11251724
Summary
This UK Biobank cohort study (160,923 participants) relates regular proton pump inhibitor (PPI) use to respiratory infections. Its abstract gives the hazard ratios for severe COVID-19 and COVID-19 mortality as 1.19 (95% CI 1.11–1.27) and 1.37 (1.29–1.46). Those two triplets match, digit for digit, the fully adjusted Table 2 estimates for other upper and other lower respiratory infections. The paper's Results text and Supplementary file 1e report the COVID-19 outcomes as 1.33 (1.09–1.61) and 1.46 (1.05–2.03). The paper's p-values, event counts and severity E-value fit the Results figures and not the abstract's. The direction and significance stay the same, but the abstract understates both effects and makes the two estimates look far more precise than they are: its intervals are 2.9 and 5.3 times too narrow on the log scale. The error has been in every version since the 2022 preprint, and as of 2026-10-24 no correction has been published.
What the paper reports
Abstract, Results:
In contrast, the risk of COVID-19 infection was not significant with regular PPI use (HR 1.08, 95% CI 0.99–1.17), while the risks of severe COVID-19 (HR 1.19. 95% CI 1.11–1.27) and mortality (HR 1.37. 95% CI 1.29–1.46) were increased.
Results, "Proton pump inhibitor use and other respiratory infections, COVID-19 severity, and COVID-19 mortality":
For other upper and lower respiratory infections, the risks among regular PPI users were increased by 19% (aHR 1.19, 95% CI 1.11–1.27, p<0.001; e-value 1.67) and 37% (aHR 1.37, 95% CI 1.29–1.46, p<0.001; e-value 2.08), respectively. In contrast, the risks of developing severe COVID-19 (aHR 1.33, 95% CI 1.09–1.61, p=0.004; e value 1.99) and mortality due to COVID-19 (aHR 1.46, 95% CI 1.05–2.03, p=0.024; e value 2.03) were significantly increased among PPI users compared to those among PPI non-users (Supplementary file 1e).
Table 2, regular PPI use rows. The columns are Case/person-years | non-adjusted HR (95% CI) | p | age/sex-adjusted HR (95% CI) | p | fully adjusted HR (95% CI) | p:
Other upper respiratory infections: Regular PPI use | 1 118/3 988 | 1.30 (1.22–1.38) | <0.001 | 1.31 (1.23–1.39) | <0.001 | 1.19 (1.11–1.27) | <0.001
Other lower respiratory infections: Regular PPI use | 1 486/5 598 | 1.78 (1.67–1.88) | <0.001 | 1.65 (1.56–1.74) | <0.001 | 1.37 (1.29–1.46) | <0.001
Supplementary file 1e, "Associations of PPI use with COVID-19 severity and mortality", regular PPI use rows (same column layout):
COVID-19 severity: Regular PPI use | 138/100 | 2.32 (1.94-2.77) | <0.001 | 1.95 (1.64-2.34) | <0.001 | 1.33 (1.09-1.61) | 0.004
COVID-19 mortality: Regular PPI use | 48/36 | 2.61 (1.93-3.54) | <0.001 | 1.90 (1.40-2.58) | <0.001 | 1.46(1.05-2.03) | 0.024
The matching non-regular-use rows have 1 104 and 337 cases.
Methods, "Definition of outcomes":
The secondary outcomes included other upper or lower respiratory infections, COVID-19 mortality, and COVID-19 severity.
Severe COVID-19 cases were defined as being hospitalized for COVID-19. COVID-19 mortality was defined as the underlying recorded cause of death due to COVID-19 (ICD-10 U07.1 and U07.2).
Abstract, Conclusions, and Discussion, "Conclusion":
PPI users are associated with increased risks of influenza, pneumonia, as well as COVID-19 severity and mortality compared to non-users, while the effects on pneumonia or COVID-19-related outcomes under PPI use were attenuated when compared to the use of H2RAs.
In conclusion, compared to non-users, people regularly taking PPIs are associated with increased susceptibility to influenza, pneumonia, as well as COVID-19 severity and mortality, while their association with pneumonia and COVID-19-related outcomes is diminished after comparison with H2RA use and remains to be further explored.
What the paper's own numbers show
Method. I compared each hazard ratio and confidence interval in the abstract with every fully adjusted row of Table 2, and with every COVID-19 severity and mortality estimate in Supplementary file 1. That covers table 1e (all three models), 1j (multiple imputation), 1m (propensity-score matched) and 1n (versus H2RA users). I treated each 95% CI as a Wald interval, symmetric on the log-HR scale as Cox output is, so SE = (ln U − ln L)/(2 × 1.96) and p = 2[1 − Φ(|ln HR|/SE)]. I recomputed each E-value from its point estimate as E = HR + √(HR(HR − 1)), which is the formula the paper's other printed E-values follow. To check how plausible each interval's width is, I compared its SE with √(1/d₁ + 1/d₀), where d₁ and d₀ are the event counts in the two groups. This is the approximate information-based SE of a log hazard ratio for a binary exposure, and covariate adjustment usually makes the actual SE larger, not smaller. recompute.py.txt prints every number below.
| Quantity | Location | Reported | Recomputed from the paper's numbers |
|---|---|---|---|
| Severe COVID-19, HR (95% CI) | Abstract | 1.19 (1.11–1.27) | Identical to Table 2, other upper respiratory infections, fully adjusted |
| COVID-19 mortality, HR (95% CI) | Abstract | 1.37 (1.29–1.46) | Identical to Table 2, other lower respiratory infections, fully adjusted |
| Severe COVID-19, aHR (95% CI) | Results text; Supp. 1e | 1.33 (1.09–1.61) | Differs from the abstract |
| COVID-19 mortality, aHR (95% CI) | Results text; Supp. 1e | 1.46 (1.05–2.03) | Differs from the abstract |
| Any other COVID-19 severity or mortality estimate equal to the abstract's values | Supp. 1e (non- and age/sex-adjusted), 1j, 1m, 1n; Table 2 COVID-19 positivity (3 models) | — | None |
| Influenza, pneumonia, COVID-19 positivity HRs | Abstract vs Table 2 | 1.32 (1.12–1.56); 1.42 (1.26–1.59); 1.08 (0.99–1.17) | Identical to Table 2 (the other abstract estimates are transcribed correctly) |
| Severe COVID-19: p from CI | Results | p = 0.004 | 0.0042 |
| COVID-19 mortality: p from CI | Results | p = 0.024 | 0.0244 |
| Severe COVID-19: E-value | Results | 1.99 | 1.99 for HR 1.33 (1.67 for HR 1.19) |
| COVID-19 mortality: E-value | Results | 2.03 | 2.28 for HR 1.46 (2.08 for HR 1.37); 2.03 corresponds to HR 1.347, nearer 1.37 than 1.46; it supports neither figure and is a separate minor inconsistency |
| E-values for influenza, pneumonia, other upper, other lower (Table 2 HRs) | Results | 1.97, 2.19, 1.67, 2.08 | 1.97, 2.19, 1.67, 2.08 |
| E-values vs H2RA: influenza, other upper, other lower | Results | 2.87, 1.88, 1.99 | 2.87, 1.88, 1.99 |
| Severe COVID-19: SE(ln HR) | Abstract vs Results | — | 0.0344 vs 0.0995 (ratio 2.90) |
| COVID-19 mortality: SE(ln HR) | Abstract vs Results | — | 0.0316 vs 0.1682 (ratio 5.33) |
| CI width on the HR scale | Abstract vs Results | 0.16 vs 0.52; 0.17 vs 0.98 | ratios 3.25 and 5.76 |
| Event-based SE, severe COVID-19 (138 / 1 104 events) | Supp. 1e | — | 0.0903. Results SE is 1.10 × this; abstract SE is 0.38 × this |
| Event-based SE, COVID-19 mortality (48 / 337 events) | Supp. 1e | — | 0.1543. Results SE is 1.09 × this; abstract SE is 0.20 × this |
| Event-based SE, other upper (1 118 / 14 449) and other lower (1 486 / 14 494) | Table 2 | — | 0.0310 and 0.0272. The abstract SEs (0.0344, 0.0316) are 1.11 × and 1.16 × these |
| Excess hazard, 100 × (HR − 1) | Abstract vs Results | 19% and 37% | 33% and 46% |
| All four intervals exclude HR = 1 | Abstract and Results | — | Yes |
| Separate minor point: COVID-19 mortality vs H2RA users, p from CI | Supp. 1n; Results | 0.83 (0.45–1.56), p = 0.745 | p = 0.557 (0.539–0.574 within 2-decimal rounding); not significant either way |
Four independent features of the paper point to the Results figures and away from the abstract. First, the HR and both CI limits of each abstract value match a different outcome's row exactly. Second, the printed p-values (0.004, 0.024) are those of the Results intervals. Third, the printed severity E-value (1.99) is that of HR 1.33, not of HR 1.19 (1.67, which the paper itself prints for the other upper respiratory row). Fourth, the abstract's interval widths are not attainable with 138 and 48 events. They need SEs of about 0.03, which is what roughly 1,100–1,500 events give, and those are the event counts of the two Table 2 rows they match. The printed mortality E-value (2.03) does not help decide the question. It matches neither HR 1.46 (2.28) nor HR 1.37 (2.08); it corresponds to HR 1.347, slightly nearer the abstract's 1.37 than the Results' 1.46. It is therefore treated as a separate minor inconsistency, not as evidence either way.
Figure
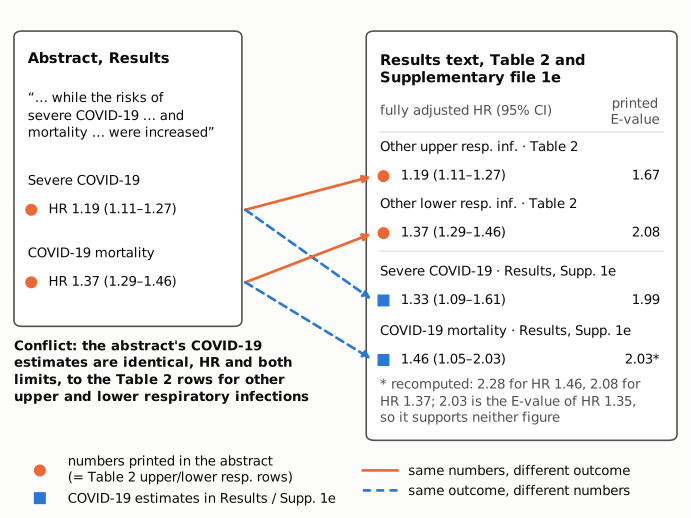
Figure 1. The left panel shows the two COVID-19 estimates printed in the abstract (orange circles). The right panel shows the fully adjusted Table 2 rows for other upper and other lower respiratory infections, and the fully adjusted severe-COVID-19 and COVID-19-mortality estimates in the Results text and Supplementary file 1e (blue squares), each with the E-value printed in the Results. The Table 2 rows carry the same orange marker as the abstract because their numbers are identical to the abstract's. Solid orange connectors join each abstract value to the Table 2 row with identical numbers but a different outcome. Dashed blue connectors join it to the estimate for the same outcome, which has different numbers. The printed severity E-value (1.99) follows the right-hand estimate. The asterisk marks the printed mortality E-value (2.03), which matches neither HR 1.46 (recomputed 2.28) nor HR 1.37 (2.08) and so supports neither figure. All numbers are printed in the paper or by recompute.py.txt. The paper's own figures are not reproduced.
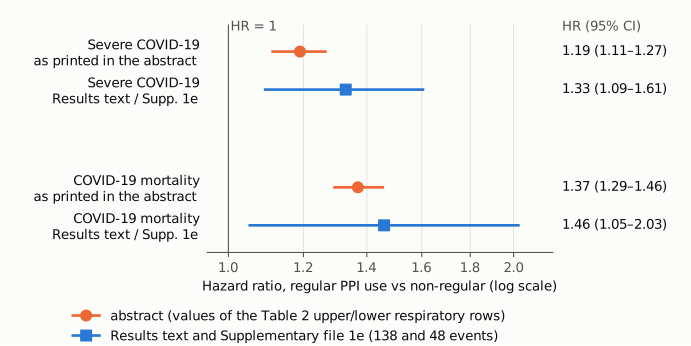
Figure 2. Hazard ratios for regular PPI use, on a log axis with a reference line at HR = 1. For each COVID-19 outcome, the orange circle and interval are the values printed in the abstract and the blue square and interval are the fully adjusted estimate in the Results text and Supplementary file 1e. The intervals in the Results, based on 138 and 48 events among regular PPI users, are 2.9 and 5.3 times wider on the log scale than the ones in the abstract. All four exclude 1, so the error changes the size and the apparent precision of the associations but not their direction or significance.
Why it matters
The abstract is where most readers, and most citing papers and evidence summaries, take the numbers from. For two of its five reported non-user comparisons, it gives effect sizes that belong to different outcomes. The COVID-19 severity and mortality associations are understated (19% vs 33% and 37% vs 46% excess hazard). More consequentially, they look about three to five times more precise than the data allow: the abstract implies a mortality HR known to within 1.29–1.46, when the 48 deaths among regular users support only 1.05–2.03. In a meta-analysis that took the abstract's figures, the inverse-variance weight of this study's mortality estimate would be inflated by a factor of about 28 (5.33²) and that of the severity estimate by about 8 (2.90²). Either estimate would then carry far more weight than the data justify.
The qualitative claims survive. All four intervals exclude 1, so "increased" is correct for both outcomes in both places. The conclusions of the abstract and the Discussion, which give no numbers, are unaffected. The comparison with H2RA users (Supplementary file 1n), on which the abstract bases its statement that COVID-19-related risks "were not evident", is a separate analysis and is not involved. Of the non-user comparisons, the influenza, pneumonia and COVID-19 positivity figures in the abstract match Table 2. The error is confined to the two secondary COVID-19 outcomes.
Explanations considered
- A different model (unadjusted, age/sex-adjusted, fully adjusted). This is ruled out. Supplementary file 1e gives all three models for both COVID-19 outcomes (2.32, 1.95, 1.33 for severity; 2.61, 1.90, 1.46 for mortality). None is 1.19 or 1.37, and none has an interval close to the abstract's.
- A sensitivity analysis (multiple imputation, propensity-score matching, CYP2C19 strata, H2RA comparison). This is ruled out. Tables 1j (1.47 (1.33–1.64); 1.53 (1.27–1.86)), 1m (1.10, 1.25; 1.15, 1.45) and 1n (0.91; 0.83) give no match. The CYP2C19 tables (1g, 1h) have no matching COVID-19 severity or mortality estimate either. The only places in the paper where 1.19 (1.11–1.27) and 1.37 (1.29–1.46) appear are the Table 2 upper and lower respiratory rows and the Results sentence that describes those rows.
- The abstract is right and the Results / Supplementary file 1e are wrong. This does not fit. The Results p-values and the severity E-value are consistent with the Results intervals. The Results SEs are 1.09–1.10 times the event-based approximation from the paper's own case counts (138 and 48), which is what a fully adjusted Cox model would give. The abstract SEs are 0.38 and 0.20 times that approximation, which a model fitted to those events cannot produce. They are 1.11–1.16 times the approximation for the upper and lower respiratory rows, which have 1,118 and 1,486 events.
- "Severe COVID-19" and "mortality" in the abstract mean something broader, such as respiratory infections in general. This does not fit the text. The sentence opens with COVID-19 infection, and the Methods define severe COVID-19 as hospitalisation for COVID-19 and COVID-19 mortality by ICD-10 U07.1/U07.2. The upper and lower respiratory outcomes are defined separately (J00–J06, J20–J22). They are not mentioned anywhere in the abstract.
- Conversion or typesetting artefact. This is ruled out. The same abstract numbers appear in the PMC text, in both eLife Version-of-Record versions (v1, 16 July 2024; v2, 18 July 2024) retrieved from the eLife API, and in all three medRxiv versions of the preprint (22 August 2022, 9 January 2024, 7 May 2024).
Status
As of 2026-10-24:
- Version of record. Both Version-of-Record versions in the eLife API (https://api.elifesciences.org/articles/94973, v1 dated 2024-07-16 and v2 dated 2024-07-18) carry the abstract with "HR 1.19. 95% CI 1.11–1.27" and "HR 1.37. 95% CI 1.29–1.46". Each also carries the Results sentences with "aHR 1.33, 95% CI 1.09" and "aHR 1.46, 95% CI 1.05". The v2 update therefore left the discrepancy in place. The PMC-archived text and Table 2 agree, and every quotation above from the article was checked verbatim against the PMC copy. The medRxiv preprint (doi:10.1101/2022.08.21.22279047), versions 1–3, has the same abstract figures, so the discrepancy goes back to the first preprint.
- Supplement. Supplementary file 1 (https://cdn.elifesciences.org/articles/94973/elife-94973-supp1-v2.docx, tables 1a–1n), the article's only supplementary data file, was downloaded and read. The other additional file listed in the Version of Record is the MDAR checklist (elife-94973-mdarchecklist1-v2.pdf). Table 1e confirms the Results values and contains no estimate equal to the abstract's. Tables 1j, 1m and 1n were also checked (see above). The supplement supports the Results text, so it resolves which figures are correct. The abstract is unchanged.
- Corrections. None found. Crossref update metadata, PMC notices and Europe PMC notices list no correction, erratum, retraction or expression of concern. The public peer reviews and the author response on the eLife site do not mention the discrepancy.
- PubPeer. The PubPeer search page and API refused automated access (HTTP 403 and a "human verification required" response). A web search for the title together with "PubPeer" found no PubPeer thread, only the article and its preprint versions. That there is no PubPeer thread is therefore likely but not confirmed.
- Sources. PMC11251724; https://elifesciences.org/articles/94973; https://api.elifesciences.org/articles/94973 (versions 1 and 2); Supplementary file 1 (elife-94973-supp1-v2.docx); medRxiv doi:10.1101/2022.08.21.22279047 (versions 1–3); https://elifesciences.org/articles/94973/peer-reviews.
Suggested correction
In the Abstract, Results, replace "while the risks of severe COVID-19 (HR 1.19. 95% CI 1.11–1.27) and mortality (HR 1.37. 95% CI 1.29–1.46) were increased" with "while the risks of severe COVID-19 (HR 1.33, 95% CI 1.09–1.61) and COVID-19 mortality (HR 1.46, 95% CI 1.05–2.03) were increased". These are the fully adjusted estimates in the Results and Supplementary file 1e. The authors may also wish to check two minor points. First, the E-value printed for COVID-19 mortality (2.03), which would be 2.28 for HR 1.46. Second, the p-value in Supplementary file 1n for COVID-19 mortality versus H2RA users (printed 0.745; the printed interval 0.45–1.56 implies about 0.56). Neither changes a conclusion. A typographic slip in Table 2 could be fixed at the same time: the influenza interval is printed as "1.32 (1,12–1.56)".