← Back to the plain-language case
Rapa Nui population estimates in Table 3 use 760 ha, but 0.76 km² is 76 ha
Sci Adv (2024) · doi:10.1126/sciadv.ado1459 · PMC11192071
Summary
The paper maps 0.76 km² of rock gardens on Rapa Nui and uses this area in Table 3 to estimate how many people sweet potatoes grown in the gardens could have fed. Since 1 km² = 100 ha, 0.76 km² is 76 ha, but Table 3 enters 760 ha (380 ha and 126.67 ha for the two shifting-cultivation scenarios). The table's own arithmetic reproduces every printed population from these hectare figures, so all six "this study" estimates are ten times what the paper's stated area implies. With 76 ha, the maximum falls from 3,901 to about 390 people, and the "~3000" that the paper says "matches historical accounts" becomes about 300. The abstract's conclusion, that gardening could not support the large populations assumed before, is unaffected and, if anything, stronger.
What the paper reports
Results, after the model output was cleaned by hand:
The resulting dataset contains a total of 0.76 km2 of rock gardens across Rapa Nui (Fig. 1).
Discussion, first paragraph:
Ladefoged et al.’s (26) mulching estimates ranged from 4.3 to 21.1 km2. Our study estimates indicate that the total area of rock gardening is 0.76 km2, approximately one-fifth of the most conservative previous estimates, including many misclassified colluvium areas, lava flows, and roadways.
Discussion, "Reevaluating population estimates", first paragraph, giving the conversion factors:
Puleston et al. (6) rely on estimates of sweet potato yields to approximate the pre-European contact population size of Rapa Nui and report that 1 ton/year of sweet potato produces a yield of 2809 kcal/day.
(maximum of 2785 kcal per day per person)
Table 3 (column header, then the six "This study" rows):
Cultivation frequency | N availability | Sweet potato yield (tons/ha/year) | Rock garden area estimate | Land available for rock gardening (ha) | Sweet potato yield (kcal/day) | Number of individuals supported
Continuous | Low | 1.46 | This study | 760 | 3,116,886.4 | 1,119 Continuous | High | 5.09 | This study | 760 | 10,866,335.6 | 3,901 Shifting (5/5) | Low | 2.38 | This study | 380 | 2,540,459.6 | 912 Shifting (5/5) | High | 8.00 | This study | 380 | 8,539,360.0 | 3,066 Shifting (15/3) | Low | 5.61 | This study | 126.67 | 1,996,075.4 | 716 Shifting (15/3) | High | 17.60 | This study | 126.67 | 6,262,384.6 | 2,248
Table 3 caption:
We use the same ratios as Puleston et al. (6) (100% for continuous, 50% for shifting 5 years off 5 years on, and 25% for shifting 15 years off 3 years on).
Discussion, conclusions drawn from Table 3:
In contrast, baseline estimates of the population size using our new rock gardening data suggest that population sizes could not have exceeded 4000 (Table 3).
The average carrying capacity of rock gardening calculated in this study is ~2000. If we add 50% to this estimate to account for marine and additional terrestrial foods from nonmulched areas, we arrive at an estimated carrying capacity of ~3000 people. This value matches historical accounts of population size at the time of European arrival in the 18th century (44, 45).
Our estimates suggest that the maximum population supported by rock gardening is not ~17,000 as claimed through Ladefoged et al.’s (26) rock gardening calculations but just 3901 using our measurements.
Introduction, paragraph setting out the study's aims:
We demonstrate that the extent of rock gardening cultivation found in the occupied coastal areas comports with estimates of the population from observations made by early European visitors to the island in the 18th century, which is about 3000 (36).
Abstract, final sentence:
We show that the extent of this agricultural infrastructure is substantially less than previously claimed and likely could not have supported the large population sizes that have been assumed.
What the paper's own numbers show
Method. Table 3 follows the model the Discussion describes: daily kcal = yield (tons/ha/year) × area (ha) × 2809, and people supported = kcal ÷ 2785. I first applied this to all twelve printed rows, using the printed hectares, to establish which area each row actually used. I then recomputed the six "this study" rows with the paper's stated 0.76 km² = 76 ha, keeping the yields and the area fractions the table applies (1, 1/2 and 1/6 for continuous, 5/5 and 15/3 cultivation). Finally I checked which of the two areas fits the paper's own verbal comparisons with earlier estimates. Every number below is printed by recompute.py.txt.
| Quantity | Location | Reported | Recomputed from the paper's own numbers |
|---|---|---|---|
| Mapped rock-garden area | Results; Discussion | 0.76 km² | = 76 ha (1 km² = 100 ha) |
| Land available, continuous | Table 3 | 760 ha | 76 ha; 760 ha would be 7.6 km² |
| Land available, shifting 5/5 and 15/3 | Table 3 | 380 ha; 126.67 ha | 38 ha; 12.67 ha (380/760 = 1/2; 126.67/760 = 1/6) |
| Printed populations reproduced from printed hectares | Table 3, all 12 rows | e.g. 1,119; 3,901; 16,089 | 1,119.2; 3,901.7; 16,089.0 (every row agrees to rounding) |
| People supported, continuous, low N / high N | Table 3 | 1,119 / 3,901 | 111.9 / 390.2 |
| People supported, shifting 5/5, low N / high N | Table 3 | 912 / 3,066 | 91.2 / 306.6 |
| People supported, shifting 15/3, low N / high N | Table 3 | 716 / 2,248 | 71.7 / 224.9 |
| Ratio printed / recomputed, each row | Table 3 | — | 10.00 (9.99 for one row) |
| Upper bound | Discussion | "could not have exceeded 4000" | about 390 |
| Maximum | Discussion | "just 3901" | 390.2 |
| Average of the six rows | Discussion | "~2000" | 1,993.7 as printed; 199.4 with 76 ha |
| Average + 50% for other foods | Discussion | "~3000", "matches historical accounts" | 2,990.5 as printed; 299.1 with 76 ha (10% of ~3000) |
| Previous minimum / this study | Discussion: "approximately one-fifth" | ~1/5 | 4.3/0.76 = 5.7 (fits 0.76 km²); 4.3/7.6 = 0.57 (7.6 km² would exceed the previous minimum) |
| Previous range / this study | Discussion, last section: "between 5 and 20 times too high" | 5 to 20 | 5.7 to 27.8 with 0.76 km²; 0.57 to 2.8 with 7.6 km² |
Three smaller points, none of which affects the factor of ten:
- The continuous low-N row prints 3,116,886.4 kcal/day; 1.46 × 760 × 2809 = 3,116,866.4, a difference of 20.0 kcal/day. The 15/3 rows were evidently computed with 760/6 = 126.6667 ha, which reproduces the printed 1,996,075.4 exactly.
- The caption says 25% of the area for 15/3 shifting cultivation, but both blocks of the table apply 1/6 (522.3/3,133.9 = 0.1667; 126.67/760 = 0.1667).
- The lower bound of the earlier estimate appears as 4.9 km² in the Introduction ("between 4.9 and 21.1 km2 of the island’s total 163.6 km2 area") and as 4.3 km² in the Discussion. The comparison above holds with either.
Figure
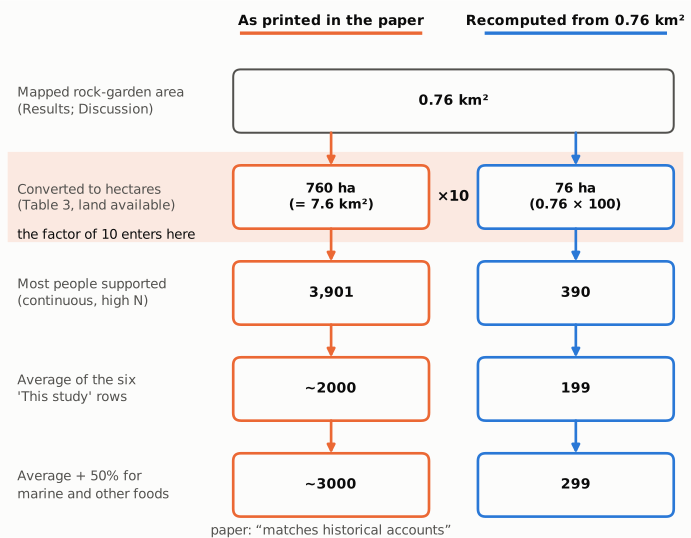
Figure 1. The calculation chain from the mapped area to the carrying capacity the paper compares with historical accounts. The left column (orange outline) gives the values printed in Table 3 and the Discussion; the right column (blue outline) gives the values recompute.py.txt obtains from the same formula and the paper's stated 0.76 km². The two columns diverge at one step only, the conversion of km² to hectares (shaded): 0.76 km² is 76 ha, and Table 3 uses 760 ha. Every later value differs by the same factor of ten. Maximum: continuous cultivation, high soil nitrogen (5.09 t/ha/yr × ha × 2809 ÷ 2785). Average: mean of the six "This study" rows of Table 3.
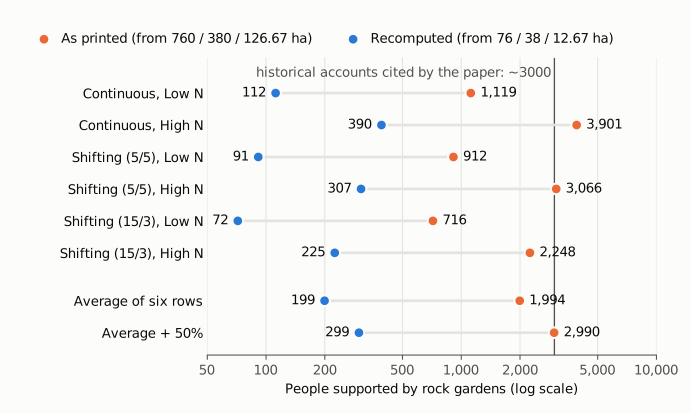
Figure 2. People supported in each of the six "This study" scenarios of Table 3 (cultivation frequency × soil nitrogen), and the average of the six with and without the paper's 50% addition for marine and other foods. Orange: the table's printed values, computed from 760, 380 and 126.67 ha (for the two summary rows, the mean of the printed values, which the text rounds to ~2000 and ~3000). Blue: the same formula with 76, 38 and 12.67 ha. The vertical line marks the ~3000 of historical accounts that the paper says its adjusted estimate matches. The horizontal axis is logarithmic, so the constant factor of ten appears as equal-length connectors; all values are drawn from recompute.py.txt.
Why it matters
- The paper's headline numbers on population depend on Table 3. The maximum of 3,901, the bound of 4,000, the average of ~2,000 and the adjusted ~3,000 all come from the six "this study" rows. Each is ten times what the paper's own mapped area gives.
- The claimed agreement with historical observations does not hold under the stated area. The paper presents its ~3,000 as matching the population observed by Europeans in the 18th century, and the Introduction states that the extent of rock gardening "comports with" that figure. With 76 ha, the same reasoning gives about 300 people, about a tenth of the observed figure. Under the paper's model, rock gardens of 0.76 km² would then feed only a small share of the population recorded at contact, and the remainder would have to come from other sources.
- The error travelled beyond the paper. The institutional press release (Columbia Climate School, State of the Planet, 21 June 2024) gives the area correctly as "about 188 acres" (76.1 ha) but repeats the table-derived "about 2,000 people" and "about 3,000".
- The direction of the main argument is unaffected. The abstract says only that gardening "likely could not have supported the large population sizes that have been assumed". A smaller carrying capacity strengthens rather than weakens that statement. The mapped area itself, as stated in the text, is not affected by this inconsistency.
Explanations considered
- The table is right and the text should say 7.6 km². Not supported by the paper. The area is given as 0.76 km² twice (Results and Discussion). The Discussion calls it "approximately one-fifth of the most conservative previous estimates" (4.3 km²): 0.76 km² is about 1/5.7 of that, while 7.6 km² would be larger than the previous minimum. The final section says previous estimates were "between 5 and 20 times too high", which fits 0.76 km² (5.7 to 27.8 times) and not 7.6 km² (0.57 to 2.8 times). The press release's 188 acres is 76.1 ha.
- "Land available" means something other than the mapped area, such as a buffer around the gardens. Not supported. The column is headed "Land available for rock gardening (ha)", the row is labelled "This study", the caption says the rows use "our revised estimates for rock garden areas", and the shifting rows are exactly 1/2 and 1/6 of 760, as the (26) rows are of 3,133.9 ha. No other area of 7.6 km² appears in the paper.
- A rounding or typesetting slip in the table only. Not supported. If 760 were a mistyped 76, the kcal and population columns would have been computed from 76 ha. They were not: yield × 760 × 2809 ÷ 2785 reproduces every printed population, and the Discussion's ~2,000 (mean of the printed rows 1,993.7), ~3,000 (2,990.5) and 3,901 all follow from the 760-ha values.
- The version archived in PMC differs from the version of record. Not supported. The PMC text, the Europe PMC full-text XML and a copy of the publisher's typeset PDF all give 0.76 km² in the text and 760 / 380 / 126.67 ha in Table 3 (see Status).
- A text extraction or conversion artefact (for example a lost decimal point). Not supported: the typeset PDF has the same numbers, and the kcal column is consistent with the 760-ha figure, not with 76 ha.
Status
- Version of record. The publisher's site (science.org, reached through the DOI) returned HTTP 403 to automated requests. The PMC article (PMC11192071), the Europe PMC full-text XML (PMC11192071, version 1) and a copy of the publisher-typeset PDF hosted on a Columbia University laboratory site (metadata "Sci. Adv. 2024.10:eado1459"; pages stamped as downloaded from science.org on 21 June 2024) give the same text and numbers, including the Table 3 rows quoted above. Every quotation above was checked verbatim against the PMC-archived text with
src/show.py. - Supplements and data. Crossref lists no journal-hosted supplementary material. The data statement points to Dryad (doi:10.5061/dryad.gqnk98swd) and a GitHub repository; the Dryad record has versions dated 2024-05-15, 2024-06-13 and 2024-11-15 with identical files (the later two are metadata changes). I downloaded the GitHub copy.
Supplemental_Code.RandREADME.mdcontain no area total and no Table 3 calculation.Mulch_Estimation.zipholdsMulch_Cleaned.tif, a rock-garden raster with 3.7 m cells (EPSG:32712) and 750,880 garden cells, which is 10.28 km² (1,028 ha) at 13.69 m² per cell. That matches neither the text's 0.76 km² (76 ha) nor the table's 760 ha. The deposited files do not state how 0.76 km² was obtained, so this observation does not settle what the mapped area is; it is one more reason for the area to be stated explicitly (see below). - Corrections and comments. As of 2026-10-24 I found no correction, erratum, retraction or expression of concern.
src/known.pyreturns no Crossref update relations and no PMC notices; its Europe PMC query was unavailable at the time of the check. A Crossref search for works related to this DOI returned none. PubPeer's API required human verification and could not be queried automatically; web searches for the title and DOI together with "PubPeer", and for published comments or replies, found no PubPeer thread, technical comment or author response. - Sources. PMC article PMC11192071; Europe PMC full-text XML; publisher-typeset PDF (copy at obtlab.climate.columbia.edu); Dryad doi:10.5061/dryad.gqnk98swd; GitHub repository named in the data statement (
Mulch_Estimation.zip,Supplemental_Code.R,README.md); Crossref; PubPeer; Columbia Climate School State of the Planet, "Study Challenges Popular Idea That Easter Islanders Committed 'Ecocide'", 21 June 2024; https://doi.org/10.1126/sciadv.ado1459.
Suggested correction
If the mapped area is 0.76 km², Table 3's "This study" rows should read 76, 38 and 12.67 ha, with kcal/day and people supported of about 311,687 and 112 (continuous, low N), 1,086,634 and 390 (continuous, high N), 254,046 and 91 (5/5, low N), 853,936 and 307 (5/5, high N), 199,608 and 72 (15/3, low N), and 626,220 and 225 (15/3, high N). The Discussion would then read "could not have exceeded ~400" instead of 4000, an average of ~200 instead of ~2000, ~300 instead of ~3000 after the 50% addition, and a maximum of 390 instead of 3901. The sentences on agreement with the ~3000 of historical accounts, in the Introduction and the Discussion, would need to be revised accordingly.
Because the deposited raster sums to a third value (10.28 km² at its native cell size), the authors may wish to state how the 0.76 km² total was computed and confirm it before revising Table 3. Whatever the confirmed area, the text and Table 3 should use the same figure. The caption's "25%" for 15/3 shifting cultivation should be changed to the 1/6 the table applies (or the table recomputed with 25%), and the minimum of the earlier estimate should be given consistently as 4.3 or 4.9 km².