← Back to the plain-language case
Abstract says gender-stereotype thumbnails increased with engagement; Results, Table 2 and Discussion report a decrease
JAMA Netw Open (2024) · doi:10.1001/jamanetworkopen.2024.13855 · PMC11137630
Summary
The abstract reports that, over 20 sequential engagements with recommended videos, "the gender stereotypes feature increased with more engagement in the recommendations feed (P for trend < .001)". The body reports the opposite direction for the same feature and the same test. The Results say gender stereotypes "decreased (P for trend < .0001)", the Discussion says prevalence "decreased for gender stereotypes", and Table 2 gives a negative Spearman correlation with screenshot number (ρ = −0.08), which with the paper's 2880 thumbnails corresponds to t = −4.31 and P = 1.7 × 10⁻⁵. The feature that did increase was visual loudness, which the Results report with the same P for trend (< .001) that the abstract gives. The trend over screenshots is how the study tests its stated hypothesis (that recommendations drift toward more problematic content), so a reader of the abstract alone gets the direction of that result reversed.
What the paper reports
Abstract, Results paragraph (final sentence):
Contrary to the hypotheses, problematic feature prevalence did not increase over time, but the gender stereotypes feature increased with more engagement in the recommendations feed (P for trend < .001).
Results, section "Trends Over 20 Screenshots":
Both Spearman correlations and tests of trend demonstrated that visual loudness increased over the 20 screenshots (P for trend < .001), while gender stereotypes decreased (P for trend < .0001) (Figure).
Discussion, first paragraph:
Contrary to our hypothesis, the prevalence of most codes did not increase over time when following recommendations over 20 sequential engagements; prevalence only increased slightly for visual loudness and decreased for gender stereotypes.
Table 2 ("Spearman Correlations Between Content Codes Among 2880 Thumbnails"), column "Screenshot No. (1-20)":
Visual loudness | .09 (<.001)
Gender stereotypes | -0.08 (<.001)
Methods, "Statistical Analysis", which defines both trend analyses:
To examine whether the frequency of content features changed over the course of 20 sequential screenshots, we conducted Spearman correlations between screenshot number (1 through 20) and each feature. We also dichotomized each feature as present (codes of levels 1 or 2) vs not present and tested significance of trend over 20 screenshots with the Cochran-Armitage trend test.
Introduction, the hypothesis the trend analysis tests:
We hypothesized that the prevalence of problematic thumbnail features would increase over time with sequential engagement with recommended videos (ie, approximating going down the rabbit hole).
The coding levels are defined in the Methods as "0 = absent, 1 = mild or latent, and 2 = clear or dominant", so a higher code means the feature is more present, and a positive correlation with screenshot number means more of the feature at later screenshots.
What the paper's own numbers show
Method. The paper does not publish screenshot-level counts (the Data Sharing Statement says "Data available: No"), so the Cochran-Armitage statistic itself cannot be recomputed. The direction can be checked in three ways from what is published. (1) I compared the direction stated in each place the paper reports the trend. (2) I converted the Table 2 correlation into a two-sided P value with the usual t approximation, t = ρ√((n − 2)/(1 − ρ²)), at n = 2880 (the table's stated denominator) and at n = 2574 (the number of unique thumbnails), and computed a Fisher-z 95% interval. Because ρ is printed to two decimals and Spearman ties are ignored, these values are approximate, but the sign is not affected. (3) As a supporting check only, I read by eye the level-0 (absent) bar heights in the paper's Figure, panels E (gender stereotypes) and A (visual loudness), converted them to counts of "present" thumbnails out of 144 per screenshot (12 search terms × 12 thumbnails), and ran a Cochran-Armitage test. Those readings are approximate (about ±1–2 percentage points per bar). I also checked the prevalence counts against Supplement 1, eTable 1. Every number below is printed by recompute.py.txt.
| Quantity | Location | Reported | Recomputed from the paper's own numbers |
|---|---|---|---|
| Direction of gender stereotypes trend | Abstract, Results | "increased" (P for trend < .001) | decrease (opposite sign) |
| Direction of gender stereotypes trend | Results, Trends Over 20 Screenshots | "decreased" (P for trend < .0001) | decrease (agrees) |
| Direction of gender stereotypes trend | Discussion, first paragraph | "decreased" | decrease (agrees) |
| ρ, screenshot no. vs gender stereotypes | Table 2 | −0.08 (<.001) | t = −4.31; P = 1.7 × 10⁻⁵ (n = 2880), 4.8 × 10⁻⁵ (n = 2574); 95% CI −0.116 to −0.044 |
| ρ, screenshot no. vs visual loudness | Table 2 | .09 (<.001) | t = +4.85; P = 1.3 × 10⁻⁶; 95% CI +0.054 to +0.126 (an increase) |
| P for trend in the abstract's sentence | Abstract vs Results | < .001 | matches the Results' P for visual loudness (< .001), not gender stereotypes (< .0001) |
| Other four features, ρ with screenshot no. | Table 2 | −0.01 to 0.02, P = .29 to .73 | all 95% CIs include 0 (no trend) |
| Gender stereotypes, prevalence | Abstract, Table 1 | 525 (18.2%); 387 at level 1, 138 at level 2 | 387 + 138 = 525; 525/2880 = 18.2%; eTable 1 per-term counts also sum to 387 and 138 |
| Gender stereotypes present, screenshots 1–5 vs 16–20 | Figure, panel E (read by eye) | plotted only | about 25.0% vs 17.0%; Cochran-Armitage z = −4.27, P ≈ 2 × 10⁻⁵ (a decrease) |
| Visual loudness present, screenshots 1–5 vs 16–20 | Figure, panel A (read by eye) | plotted only | about 70.4% vs 81.4%; z = +5.94 (an increase; checks the reading method) |
All six prevalence totals in the abstract equal the Table 1 level 1 + level 2 sums, so the abstract's prevalence figures are sound; the problem is confined to the direction of the gender stereotypes trend.
A separate, minor inconsistency: the Results give drama and intrigue for the search term Roblox as "218 of 240 thumbnails [96.7%]". 218/240 is 90.8%. Supplement 1, eTable 1 lists Roblox drama and intrigue as 8 at level 0, 115 at level 1 and 117 at level 2, so 232 of 240 thumbnails (96.7%) had the feature. The percentage is right and the count in the text is wrong. It does not affect any conclusion.
Figure
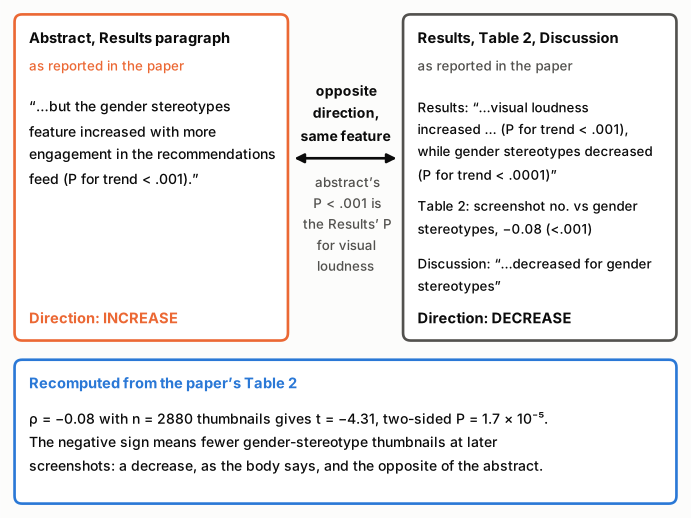
Figure 1. The conflicting statements about the same feature and the same trend test. Left (orange outline): the abstract's sentence, which says gender stereotypes increased (P for trend < .001). Right (grey outline): the Results, Table 2 and Discussion, which all say or show a decrease. The double arrow marks the conflict; the note under it records that the abstract's P value is the one the Results give for visual loudness. Bottom (blue outline): the two-sided P implied by the Table 2 correlation, recomputed by recompute.py.txt; the negative sign means fewer gender-stereotype thumbnails at later screenshots. All quoted text is verbatim from the article as archived in PMC.
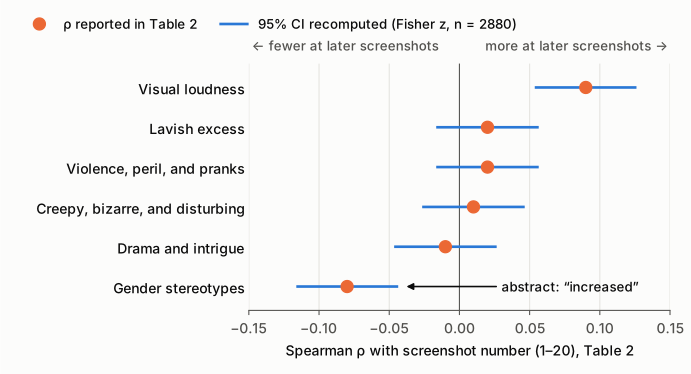
Figure 2. The six correlations with screenshot number (1–20) printed in Table 2 (orange dots), each with a 95% interval recomputed by recompute.py.txt (blue lines; Fisher z, n = 2880). The vertical line marks no trend (ρ = 0). Only two features have intervals that exclude 0: visual loudness, above 0 (more at later screenshots), and gender stereotypes, below 0 (fewer at later screenshots). The abstract describes the gender stereotypes trend as an increase. Intervals use the two-decimal ρ printed in the table, so they are approximate.
Why it matters
- It is the abstract's only trend finding, and the trend is how the study tests its hypothesis. The Objective is "to test whether VSP algorithmic recommendations offer more problematic thumbnail features over time", and the Introduction frames this as "going down the rabbit hole". The abstract tells readers that the one problematic feature the recommendations amplified was gender stereotypes (sexual objectification). The body shows that this feature became less common across the 20 engagements, and that no problematic feature increased.
- Abstracts are read and cited on their own. Readers, indexers and secondary sources that rely on the abstract will take away that recommendation feeds increase sexualized or stereotyped thumbnails over sequential viewing, a policy-relevant claim the paper's data do not support. The increase that did occur (visual loudness, an attention-capture feature rather than a problematic one) is not mentioned in the abstract.
- The main conclusions are not affected. The title, Key Points and Conclusions rest on how common problematic and attention-capturing thumbnails were, and those prevalence figures check out against Table 1 and eTable 1. With the direction corrected, the abstract's own "Contrary to the hypotheses" framing becomes stronger: no problematic feature increased, and one decreased.
Explanations considered
- A conversion or typesetting artifact. Not supported. The publisher's page, the PMC version, the Europe PMC full-text XML and the PubMed abstract all carry the same wording ("increased") in the abstract and the same "decreased" in the Results. Table 2 shows a true minus sign on the publisher's page.
- A reversed coding scale for this feature. Not supported. The levels are defined once for all features (0 absent, 2 clear or dominant), and Table 1 counts level 1 and level 2 as prevalence. The same sign convention gives visual loudness a positive ρ that the Results call an increase. The level-0 (absent) share in Figure panel E rises at later screenshots, which is a fall in presence.
- "More engagement" meaning something other than the screenshot sequence, such as co-occurrence with attention-capture features. Not supported. Gender stereotypes do co-occur with visual loudness (ρ = 0.08) and drama and intrigue (ρ = 0.12) in Table 2, but the abstract's sentence gives a "P for trend", which the Main Outcomes define as the Cochran-Armitage trend over 20 engagements, and it speaks of engagement "in the recommendations feed". The sentence also opens by contrasting with prevalence "over time".
- A small, unstable effect whose sign is uncertain. Not supported. The effect is small (ρ = −0.08; roughly 25% to 17% present from the first to the last five screenshots, by the approximate reading of panel E), but its interval excludes 0 (−0.116 to −0.044), and the Results report P < .0001. The sign does not depend on rounding or on whether n is 2880 or 2574.
- The abstract describing visual loudness under the wrong feature name. The numbers are consistent with this: visual loudness is the feature that increased, and its P for trend in the Results (< .001) is the P the abstract gives, whereas the Results give gender stereotypes P < .0001. This would account for both the direction and the P value, but the paper itself cannot confirm how the sentence came about.
Status
As of 2026-10-24:
- Version of record. The wording is the same in the publisher's version (doi.org resolves to jamanetwork.com, article 2819134), the PMC version, the Europe PMC full-text XML and the PubMed record (PMID 38809550). Quotes above were checked verbatim against the PMC text.
- Supplements. Supplement 1 (eTable 1, codes by search term; eTable 2, descriptions and examples) was checked. Its gender stereotypes counts sum to Table 1 (387 at level 1, 138 at level 2), and it gives the Roblox drama and intrigue count (232 of 240). It has no counts by screenshot, so it neither confirms nor resolves the trend direction. Supplement 2 is the Data Sharing Statement ("Data available: No").
- Corrections. None found. Crossref has no update-to or updated-by records and no relations to this DOI. PMC and Europe PMC list no correction or retraction notices, the PubMed record has no CommentsCorrections entries, and the publisher's page shows no correction notice. A web search found no erratum. The Europe PMC search API was unavailable when queried, so its comment/correction list could not be checked through that route.
- PubPeer. Could not be checked: the site was behind a human-verification page.
Sources: the article in PMC (PMC11137630) and on the publisher's site; Europe PMC full text and supplementary files; PubMed; Crossref REST API.
Suggested correction
In the Abstract, Results paragraph, replace
Contrary to the hypotheses, problematic feature prevalence did not increase over time, but the gender stereotypes feature increased with more engagement in the recommendations feed (P for trend < .001).
with wording consistent with the Results, Table 2 and the Discussion, for example:
Contrary to the hypotheses, problematic feature prevalence did not increase over time; the gender stereotypes feature decreased with more engagement in the recommendations feed (P for trend < .0001), and the visual loudness feature increased (P for trend < .001).
In the Results, "Attention-Capture Designs", the Roblox count for drama and intrigue should read 232 of 240 thumbnails (96.7%), as in eTable 1, rather than 218 of 240.