← Back to the plain-language case
Abstract gives Padj = 0.010 for a primary macrolide comparison; Results give 0.19 (Table 2: 0.187)
PLoS Med (2024) · doi:10.1371/journal.pmed.1004386 · PMC11073710
Summary
This MORDOR sub-study compares gut macrolide resistance determinants across four azithromycin treatment histories. For the comparison of 4.5 years of treatment (group 1) with 2.5 years (group 2), the abstract reports "fold change 0.80, 95% CI 0.50 to 1.00, Padj = 0.010". The Results report the same comparison as "0.80-fold, 95% CI: 0.52 to 1.00, Padj = 0.19", and Table 2(A) gives its min-P adjusted p-value as 0.187. That value rounds to 0.19, not to 0.010, and a 95% interval that reaches 1.00 is not compatible with an adjusted p of 0.010. The paper's own wording ("no significant increase") and its conclusion are consistent with the correct value, 0.19. But anyone who extracts the abstract's number gets a nominally significant result, apparently a significant decrease, for the comparison that underlies the conclusion that "resistance may plateau".
What the paper reports
Abstract, "Methods and findings" (Padj is printed with a subscript in the original):
However, there was no significant increase in macrolide resistance in communities treated 4.5 years (group 1) compared to just the most recent 2.5 years (group 2) (fold change 0.80, 95% CI 0.50 to 1.00, Padj = 0.010), or between communities that had been treated for 3 years in the past (group 3) versus just 1 year in the past (group 4) (fold change 1.00, 95% CI 0.78 to 2.35, Padj = 0.52).
Results, "Primary outcome", the same comparison:
Finally, we did not find a statistically significant difference in macrolide resistance determinants between 4.5 years of azithromycin treatment (group 1) compared to 2.5 years of treatment (group 2) (0.80-fold, 95% CI: 0.52 to 1.00, Padj = 0.19, Wilcoxon rank-sum, min-P adjustment) or 3 years of treatment (group 3) (1.60-fold, 95% CI: 1.00 to 3.08, Padj = 0.06, Wilcoxon rank-sum, min-P adjustment).
Results, "Primary outcome", group 1 vs group 4:
In particular, 4.5 years of azithromycin treatments (group 1) resulted in a 2.23-fold (95% CI: 1.20 to 5.17) increase in macrolide resistance determinants compared to 1 year of azithromycin treatment only during year 3 of the study (Padj = 0.01, Wilcoxon rank-sum (i.e., without covariate adjustment), min-P adjustment).
Table 2(A), rows 1 vs. 2 and 1 vs. 4. The columns are Groups | Treatment | Aminoglycosides | Cationic antimicrobial peptides | Macrolides | Metronidazole | Multi drug resistance | Tetracyclines | Trimethoprim | Beta-lactams:
1 vs. 2 | AA-AA-AA-AA-A vs.PP-PP-AA-AA-A | 0.218 | 0.918 | 0.187 | 0.255 | 0.945 | 0.140 | 0.112 | 0.408
1 vs. 4 | AA-AA-AA-AA-A vs.PP-PP-AA-PP-P | 0.218 | 0.791 | 0.014 | 0.884 | 0.848 | 0.927 | 0.730 | 0.957
Table 2 footnote (A):
The P-values derived from the min-P procedure that were prespecified in the Statistical Analysis Plan are presented in this table.
Methods, "Statistical methods > Primary outcome":
Pairwise Wilcoxon rank-sum tests for macrolide resistance determinants between each of the treatment history groups, accounting for multiple comparisons by means of the Westfall–Young min-P method [20], which are reported as adjusted P-values.
Methods, "Statistical methods > Secondary outcomes", on how fold changes and CIs were obtained:
Fold changes were estimated by transforming normalized read counts using the transformation log(x + epsilon) where epsilon = 0.001 (qualitative results are not sensitive to choice of small epsilon) and performing analysis using the unadjusted confidence interval from the Wilcoxon rank-sum test.
Specifically, the Hodges–Lehmann estimator was computed on the transformed scale, and the inverse transformation was used to yield an approximate ratio.
The statements that rest on this comparison. Abstract, "Conclusions":
resistance may plateau after 2 to 3 years of treatment
Author summary:
Longer periods of treatment with azithromycin were not associated with increased macrolide resistance
Discussion, first paragraph:
However, we were unable to find a difference between communities treated for 4.5 years versus just 2.5 years. Thus resistance in the gut may plateau after several MDAs, rather than continue to increase until it saturates the age-group [22].
What the paper's own numbers show
Method. I matched every macrolide p-value printed in the abstract and Results to its cell in Table 2(A) and checked that each text value is the table value rounded to the printed number of decimals. I then asked whether the abstract's 0.010 could come from any other reading of the same comparison, and listed the Table 2(A) cells closest to 0.010. Finally, I used the printed 95% CI to bound the unadjusted p-value for group 1 vs group 2. The interval is the unadjusted Wilcoxon/Hodges–Lehmann interval on the log scale, and its upper bound is 1.00, the null ratio. By test inversion that corresponds to an unadjusted two-sided p of about 0.05 or more. For a rough numerical check I also approximated the standard error on the log scale from the lower half-width, the upper half-width and the full width of the interval. The community-level data are not published, so the permutation test itself cannot be redone. Every number below is printed by recompute.py.txt.
| Quantity | Location | Reported | Recomputed from the paper's numbers |
|---|---|---|---|
| Macrolides, 1 vs 2, min-P Padj | Table 2(A) | 0.187 | source value |
| Macrolides, 1 vs 2, Padj | Results | 0.19 | 0.187 to 2 dp = 0.19, consistent |
| Macrolides, 1 vs 2, Padj | Abstract | 0.010 | does not match: the Table value is 18.7 times larger; 0.187 cannot round to 0.010 |
| Significance at 0.05 of the same comparison | Abstract vs Results / Table 2(A) | 0.010 vs 0.19 / 0.187 | 0.010 < 0.05; 0.187 > 0.05. The two classifications differ |
| Macrolides, 1 vs 3, Padj | Results / Table 2(A) | 0.06 / 0.063 | consistent |
| Macrolides, 1 vs 4, Padj | Results / Table 2(A) | 0.01 / 0.014 | consistent |
| Macrolides, 2 vs 3, Padj | Results / Table 2(A) | 0.003 / 0.003 | consistent |
| Macrolides, 2 vs 4, Padj | Results / Table 2(A) | < 0.001 / < 0.001 | consistent |
| Macrolides, 3 vs 4, Padj | Abstract / Table 2(A) | 0.52 / 0.517 | consistent; the abstract's only other Padj (3 vs 4) matches Table 2(A) |
| Table 2(A) cells closest to 0.010 | Table 2(A) | — | Aminoglycosides 2 vs 4 = 0.011; Macrolides 1 vs 4 = 0.014; Macrolides 2 vs 3 = 0.003. Macrolides 1 vs 2 is 0.187 |
| 1 vs 2 CI on the log scale | Results / Abstract | 0.52 to 1.00 / 0.50 to 1.00 | −0.654 to 0.000 / −0.693 to 0.000; both reach the null (log ratio 0) |
| Approximate unadjusted p implied by the Results CI (normal approximation, log scale) | derived | — | 0.18 from the full width; 0.05 to 0.31 depending on which half-width sets the SE |
| Same, from the Abstract CI | derived | — | 0.21 from the full width; 0.05 to 0.35 |
| One-sided reading of the Table value | derived | — | 0.187 / 2 = 0.094, still not 0.010 |
| 1 vs 2 CI lower bound | Abstract vs Results | 0.50 vs 0.52 | differ by 0.02; cannot be resolved without the data |
| Groups 1+2 vs 3+4 CI lower bound | Abstract vs Results | 1.5 vs 1.49 | 1.49 to 1 dp = 1.5, rounding only |
Two points make 0.010 impossible for this comparison, not merely inconsistent. First, a Westfall–Young min-P adjusted p-value can never be smaller than the unadjusted p-value for the same hypothesis. Second, the unadjusted p implied by an interval that reaches 1.00 is about 0.05 or more. Even if the printed 1.00 were rounded up from a bound just below 1 (for example 0.995), the unadjusted p would be only slightly below 0.05, far above 0.010. Every other macrolide Padj in the text matches Table 2(A). The abstract's 0.010 is the only exception, and it sits close to the 1 vs 4 value (0.014, reported in the Results as 0.01).
Figure
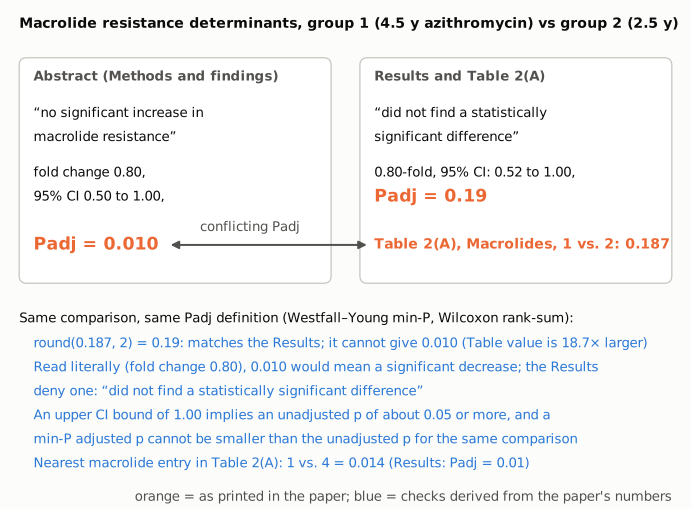
Figure 1. Short excerpts for the macrolide comparison of group 1 (4.5 years of azithromycin) with group 2 (2.5 years). The left panel is the abstract; the right panel is the Results text and the Table 2(A) macrolide cell for row "1 vs. 2". Orange values are printed in the paper. The blue lines below are checks derived from the paper's numbers by recompute.py.txt. The Results value is the Table 2(A) value rounded to two decimals. The abstract's 0.010 is 18.7 times smaller than the table value and cannot be reconciled with a 95% CI whose upper bound is 1.00. Read literally, with a fold change of 0.80, it would mean a significant decrease, which the abstract does not report and the Results deny ("did not find a statistically significant difference").
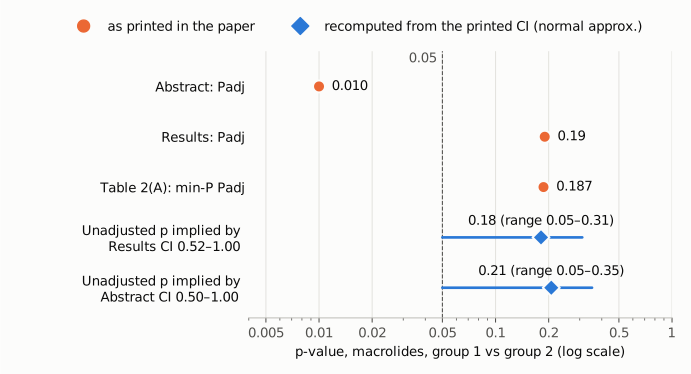
Figure 2. P-values for the group 1 vs group 2 macrolide comparison on one log-scale axis; the dashed line marks 0.05. Orange circles are the three printed values: the abstract (0.010), the Results (0.19) and Table 2(A) (0.187). Blue diamonds are approximate unadjusted two-sided p-values recomputed from each printed 95% CI (normal approximation on the log scale, SE from the full width); the blue bars span the values obtained when the SE is taken from either half-width instead. A min-P adjusted p cannot be smaller than the unadjusted p, and an upper CI bound of 1.00 puts the unadjusted p at about 0.05 or more (the left end of the blue bars). The Results and Table 2(A) values are above that floor; the abstract's 0.010 is well below it.
Why it matters
The comparison of group 1 with group 2 is part of the prespecified primary outcome. It is the evidence behind the abstract's conclusion that "resistance may plateau after 2 to 3 years of treatment", the Author summary's statement that "Longer periods of treatment with azithromycin were not associated with increased macrolide resistance", and the corresponding sentence of the Discussion. With the correct value (Padj = 0.19, Table 2(A) 0.187) these statements are supported as written. The analysis, the body text and the table are consistent with each other, and the paper's conclusions do not change.
The error matters because it sits in the abstract, which is the part most often read on its own, indexed and extracted into reviews and meta-analyses. Read literally, the abstract pairs a fold change of 0.80 and an upper bound of 1.00 with Padj = 0.010. That reads as a statistically significant decrease in macrolide resistance with longer treatment, which the data do not show. The abstract does not report a significant decrease, and the Results deny any significant difference ("did not find a statistically significant difference"). A reader who takes the number at face value would put this comparison in the wrong significance class. The 0.50 vs 0.52 mismatch in the CI lower bound is a separate, minor inconsistency and does not affect any interpretation.
Explanations considered
- A different test or adjustment. This does not account for the numbers. The abstract and the Results both label the value Padj. The Methods define Padj as the Westfall–Young min-P adjusted pairwise Wilcoxon p-value. Table 2(A) prints that value as 0.187.
- The abstract quotes the unadjusted p. This does not account for the numbers. The paper does not print an unadjusted p for this comparison. The printed CI is the unadjusted Wilcoxon/Hodges–Lehmann interval, and its upper bound of 1.00 corresponds to an unadjusted p of about 0.05 or more (roughly 0.18–0.21 by normal approximation with the SE from the full width; 0.05–0.35 across SE choices), not 0.010.
- A one-sided test. This does not account for the numbers. Nothing in the paper describes a one-sided test, and halving 0.187 gives 0.094.
- The FDR (Benjamini–Hochberg) row of Table 2(B). This does not account for the numbers. That row is "NA" for macrolides.
- A different outcome class, population or time point. This does not account for the numbers. The abstract and the Results describe the same groups, the same outcome and the same fold change (0.80). The value 0.010 does not appear in the macrolide 1 vs 2 cell. The nearest Table 2(A) values are aminoglycosides 2 vs 4 (0.011) and macrolides 1 vs 4 (0.014, reported as Padj = 0.01 in the Results).
- A conversion or typesetting artifact in PMC. This is excluded. The publisher's PDF, the publisher's HTML page, PMC and the Europe PMC full-text XML all print the same abstract (0.50 to 1.00, Padj = 0.010) and the same Results (0.52 to 1.00, Padj = 0.19). No minus sign, superscript or decimal separator is involved, and the Table 2(A) column order was checked against the header in the PDF.
- The abstract value is right and the table and Results are wrong. This is not plausible. 0.010 cannot be an adjusted p for an interval that reaches the null. The table and the Results agree with each other, and the Results state that the difference is not statistically significant.
- The abstract claims a significant difference. This is not the case. The abstract says "no significant increase" and reports no significant decrease. The error is the printed number: read literally, 0.010 with a fold change of 0.80 would mean a significant decrease, which the abstract does not report and which conflicts with the Results ("did not find a statistically significant difference") and Table 2(A).
- The CI lower bound (0.50 vs 0.52). This is unexplained. It is a 0.02 difference between two printed versions of the same interval; which one is correct cannot be determined without the data. It does not affect the conclusion.
Status
- Version of record. The publisher's PDF (journals.plos.org printable file, 16 pages, text extracted) and the PLOS HTML article page carry the same abstract text (CI 0.50 to 1.00, Padj = 0.010) and the same Results text (CI 0.52 to 1.00, Padj = 0.19) as the PMC archive. In the PDF's Table 2(A), the macrolide value for "1 vs. 2" is 0.187 and for "1 vs. 4" is 0.014. On the HTML page, Table 2 is an image. The Europe PMC full-text XML matches. Every quote above was confirmed verbatim against the PMC-archived text.
- Supplements. S1 Appendix (pmed.1004386.s001.pdf, 178 pages) holds community-level summary statistics by group and class (Table A), a trial schematic, the group list, the protocols and the statistical analysis plans. It has no pairwise fold changes, CIs or p-values, so it does not resolve the discrepancy. S1 CONSORT Checklist is not relevant. The data availability statement points only to raw sequences (SRA PRJNA1066963). No community-level analysis dataset is published, so the min-P p-value cannot be recomputed.
- Corrections and comments. As of 2026-10-23 I found no correction, erratum, retraction or expression of concern. Crossref lists no update relations for the DOI, and its relation records list only the article's own components. PMC and Europe PMC (PMID 38709718) list no correction or comment links. The PLOS article page shows no correction notice. A web search for a correction notice citing the DOI returned nothing relevant. PubPeer could not be checked: both the PubPeer API and its search page returned a Cloudflare block (HTTP 403) to automated access.
- Sources. PMC article PMC11073710; publisher page and PDF at journals.plos.org (doi:10.1371/journal.pmed.1004386); S1 Appendix (pmed.1004386.s001.pdf); Europe PMC full-text XML; Crossref; PubPeer (not reachable).
Suggested correction
- In the abstract ("Methods and findings"), replace "Padj = 0.010" for group 1 vs group 2 with the Table 2(A) value, "Padj = 0.19" (0.187), after confirming it against the original analysis output.
- Reconcile the lower confidence limit for the same comparison: the abstract gives 0.50 and the Results give 0.52. Use whichever the analysis output supports in both places.
- Optionally, harmonize "1.5" (abstract) with "1.49" (Results) for the lower confidence limit of the groups 1+2 vs 3+4 comparison.
No change to the Results, Table 2, the Author summary, the Discussion or the conclusions appears to be needed.