← Back to the plain-language case
Oral cancer test's accuracy table counts 101 subjects in a cohort the paper gives as 92
Cell Rep Med (2024) · doi:10.1016/j.xcrm.2024.101447 · PMC10983043
Summary
The paper reports that the beta-defensin index (BDI) detects oral squamous cell carcinoma (OSCC) with 98.2% sensitivity (95% CI 90.3–99.9) and 82.6% specificity (95% CI 68.6–92.2) in "a multi-center validation study". These figures come from Table 1, whose four cells (TP 54, TN 38, FP 8, FN 1) add up to 101, while the text twice says the analysis covers 92 subjects: 54 cancers and 38 benign lesions in the discovery and validation cohorts. The printed TP and TN equal the cancer and benign totals, so the 8 false positives and 1 false negative are counted twice, and the denominators become 55 and 46 instead of 54 and 38. With the paper's own counts, which the subject-level labels in supplementary Table S1 confirm, specificity is 30/38 = 78.9% (exact 95% CI 62.7–90.4), not 82.6%. Sensitivity barely changes (53/54 = 98.1%). Because the abstract presents these as validation results, it also matters that they pool the discovery cohort in which the 1.25 cutoff was chosen. The validation cohorts alone give 96.6% sensitivity and 78.3% specificity.
What the paper reports
Abstract (Summary):
A multi-center validation study shows sensitivity and specificity values of 98.2% (95% confidence interval [CI] 90.3–99.9) and 82.6% (95% CI 68.6–92.2), respectively.
Highlights:
A multi-center validation study yields sensitivity and specificity of 98% and 83%
Results, "Beta-defensin index: Proof-of-concept, discovery, and validation studies" (study design paragraph):
We recruited a total of 92 subjects for the discovery and validation study
Results, discovery-phase study:
Of the 40 oral lesions, 25 were diagnosed by pathology review as being cancerous while 15 were benign (see Table S1B diagnoses).
We arrived at a BDI cutoff value of 1.25 and found 100% sensitivity with an acceptable specificity value of 80% (Figures 4B and 4C).
Figure 4 legend, panel D:
(D) BDI values for 23 non-cancerous and 29 OSCC lesions from the three validation cohorts (blue: internal validation cohort [n = 21]; green: external validation cohort 1 [n = 19]; orange: external validation cohort 2 [n = 12]).
Results, "Sample size and power calculation":
In the validation cohort (total 52 subjects; 29 OSCC: mean = 6.1, SD = 6.9; 23 benign: mean = 0.8, SD = 0.64)
Results, validation study:
We then calculated the sensitivity and specificity of the BDI, based on the threshold value of 1.25 from the discovery cohort, and found overall sensitivity of 98.2% and specficity of 82.6%. For all the subjects (n = 92), sensitivity/specificity and positive/negative predictive values, with a confidence interval of 95%, are shown in Table 1. Among 92 subjects, we recorded eight false positives (FPs) and one FN (Tables 1 and S1).
Table 1, "Sensitivity, specificity, and positive and negative predictive values of BDI in OSCC detection" (columns: values (BDI vs. biopsy) | 95% confidence interval):
True positive, TP | 54 | –
True negative, TN | 38 | –
False positive, FP | 8 | –
False negative, FN | 1 | –
Sensitivity, TP/(TP + FN) | 98.2 | 90.28%–99.95%
Specificity, TN/(TN + FP) | 82.6 | 68.58%–92.18%
Positive predictive value | 87.10 | 78.22%–92.69%
Negative predictive value | 97.44 | 84.44%–99.63%
Results, "Benchmarking of BDI against other OSCC biomarkers/platforms":
Figure S5 shows that the BDI is the most sensitive (98%) in detecting OSCC
Discussion:
In the discovery and validation studies, we reported eight FP cases.
Additionally, one of the benefits of using the BDI would be the reduction of unnecessary biopsies conducted by dentists in the United States from >90% to 17.4% when considering the FP rate of 82.6%.
what we believe happened in our one and only FN result obtained through the validation study at CMC (where the BDI score was reported as 0.23 [Figure 4D and Table S1])
What the paper's own numbers show
Method. I added up the cancer and benign counts that the paper gives for the discovery cohort (Results) and the three validation cohorts (Figure 4D legend; power-calculation paragraph), and checked them against the site sizes in the STAR Methods (40, 21, 19 and 12 subjects). I then summed the four Table 1 cells and derived the disease-positive (TP + FN) and disease-negative (TN + FP) totals they imply. I recomputed every Table 1 estimate from its printed cells to identify the computation behind it: exact Clopper–Pearson intervals for sensitivity and specificity, and the logit interval of Mercaldo et al. (2007), as used by MedCalc, for the predictive values. Finally I rebuilt the 2×2 table from the stated cohort (54 cancers, 38 benign) and the stated 8 FP and 1 FN, and checked it against the TP/TN/FP/FN label for each subject in supplementary Table S1 (mmc2.xlsx), cohort by cohort. Every number below is printed by recompute.py.txt.
| Quantity | Location | Reported | Recomputed from the paper's numbers |
|---|---|---|---|
| Subjects, discovery + validation | Results; STAR Methods (40 + 21 + 19 + 12) | 92 | 92 |
| Cancers | Results (discovery 25); Fig 4D legend (validation 29) | 25 + 29 | 54 |
| Benign lesions | Results (discovery 15); Fig 4D legend (validation 23) | 15 + 23 | 38 |
| Sum of Table 1 cells | Table 1 | TP 54, TN 38, FP 8, FN 1 (text: n = 92) | 54 + 38 + 8 + 1 = 101; the excess of 9 equals FP + FN |
| Cancers implied by Table 1 (TP + FN) | Table 1 | — | 55 (cohort has 54) |
| Benign lesions implied by Table 1 (TN + FP) | Table 1 | — | 46 (cohort has 38) |
| Sensitivity | Table 1; Abstract; Results | 98.2 (90.28–99.95) | 54/55 = 98.18% (90.28–99.95): reproduces the printed value from the printed cells. Stated cohort: 53/54 = 98.15% (90.11–99.95) |
| Specificity | Table 1; Abstract; Results | 82.6 (68.58–92.18) | 38/46 = 82.61% (68.58–92.18): reproduces the printed value. Stated cohort: 30/38 = 78.95% (62.68–90.45) |
| Positive predictive value | Table 1 | 87.10 (78.22–92.69) | 54/62 = 87.10% (78.22–92.69): reproduces the printed value. Stated cohort: 53/61 = 86.89% (78.14–92.47) |
| Negative predictive value | Table 1 | 97.44 (84.44–99.63) | 38/39 = 97.44% (84.44–99.63): reproduces the printed value. Stated cohort: 30/31 = 96.77% (81.04–99.53) |
| Discovery cohort counts | Results (100% sensitivity, 80% specificity in 25 + 15); Table S1B | 100%, 80% | TP 25, FN 0, TN 12, FP 3 (text and Table S1B agree) |
| Validation cohorts, pooled | Table S1C–S1E (21 + 12 + 19 subjects) | — | TP 28, FN 1, TN 18, FP 5. Sensitivity 28/29 = 96.55% (82.24–99.91); specificity 18/23 = 78.26% (56.30–92.54) |
| Discovery + validation, from Table S1 labels | Table S1B–S1E | — | TP 53, TN 30, FP 8, FN 1, N = 92: identical to the table rebuilt from the stated counts |
| Specificity by cohort | Table S1B–S1E | — | discovery 12/15; internal 4/6; external (12 subjects) 10/12; external (19 subjects) 4/5 |
| Location of the single FN | Discussion; Table S1E | "validation study at CMC", BDI 0.23 | the only FN label in Table S1 is in the 19-subject external cohort, BDI 0.23 |
| Share of benign lesions classed positive | Discussion ("17.4%") | 17.4% | 17.4% = 100 − 82.6 = 8/46; stated cohort: 8/38 = 21.1% |
| Highlights | Highlights | 98% and 83% | stated cohort: 98% and 79% |
All Table 1 estimates and confidence intervals follow exactly from the printed cells, so the table is arithmetically consistent with itself. What is wrong is the cells: they describe 55 cancers and 46 benign lesions, whereas the study had 54 and 38. The 8 FP and 1 FN given in the text (and listed one by one in Table S1) match the stated cohort; only TP and TN are off, by exactly FN (1) and FP (8). All 92 Table S1 labels agree with the BDI value and the 1.25 cutoff.
Figure
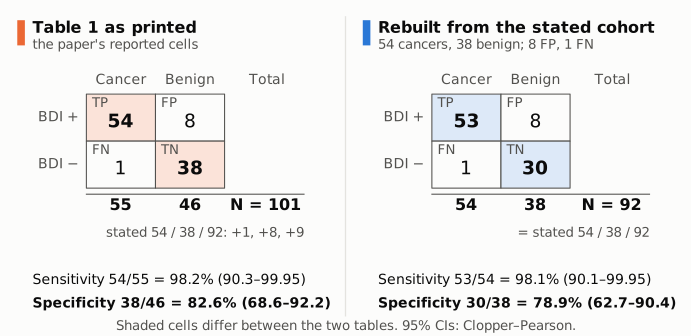
Figure 1. Left (orange): the 2×2 table as printed in Table 1, with its row and column sums. Right (blue): the same table rebuilt from the paper's stated cohort of 54 cancers and 38 benign lesions and its stated 8 false positives and 1 false negative; the subject-level labels in Table S1 give the same four counts. The shaded TP and TN cells are the only ones that differ. The printed table's columns sum to 55 and 46 (N = 101), one and eight more than the cohort contains, and its specificity is therefore 38/46 = 82.6% instead of 30/38 = 78.9%. Intervals are exact Clopper–Pearson 95% CIs.
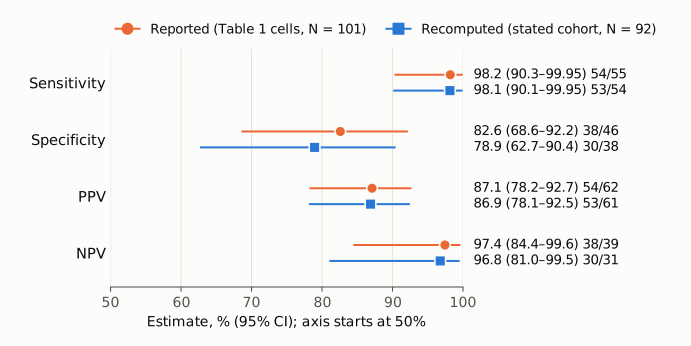
Figure 2. The four accuracy estimates in Table 1 with their 95% CIs: as reported (orange circles, from the printed cells) and as recomputed from the stated 92-subject cohort (blue squares). Sensitivity, PPV and NPV move by at most 0.7 points. Specificity falls by 3.7 points to 78.9%, and the lower limit of its interval falls from 68.6% to 62.7%. Sensitivity and specificity use Clopper–Pearson intervals, PPV and NPV the logit interval, the same methods that reproduce the printed CIs exactly. The horizontal axis starts at 50%.
Why it matters
Sensitivity and specificity are the paper's main quantitative result. They appear in the abstract, the highlights, Table 1, the Results and the Discussion, and the specificity feeds the Discussion's estimate of how far the test would cut unnecessary biopsies.
- Specificity is overstated. With the cohort the paper describes, specificity is 78.9% (62.7–90.4), not 82.6% (68.6–92.2). The highlights' "83%" becomes 79%. PPV (86.9% vs 87.1%) and NPV (96.8% vs 97.4%) are slightly overstated too. Sensitivity is essentially unchanged (98.1% vs 98.2%), so the benchmarking statement that the BDI is "the most sensitive (98%)" still holds as rounded.
- The unnecessary-biopsy estimate changes. The Discussion's 17.4% is 100 − 82.6, the proportion of benign lesions the test would call positive. (The text calls 82.6% the "FP rate"; it is the specificity, and 17.4% is the false-positive rate.) With the stated cohort that proportion is 8/38 = 21.1%.
- The headline figures are not validation-only figures. The abstract and highlights call them results of "a multi-center validation study", but the Results state that Table 1 covers "all the subjects (n = 92)", which includes the 40-subject discovery cohort in which the 1.25 cutoff was selected to maximise sensitivity. In the 52 validation subjects alone, sensitivity is 28/29 = 96.6% (82.2–99.9) and specificity 18/23 = 78.3% (56.3–92.5).
The overall conclusion, that the BDI separates OSCC from benign lesions with high sensitivity and moderate specificity, survives. What changes is the size of the headline specificity and its interval, and the description of which subjects those numbers come from.
Explanations considered
- The proof-of-concept cohort is included. This does not account for the numbers. That cohort has 8 subjects, 4 with OSCC and 4 benign (Results; STAR Methods), so adding it gives 100 subjects, 58 cancers and 42 benign, not 101, 55 and 46. Its Table S1A rows carry no TP/TN/FP/FN labels, and the Results say Table 1 covers the 92.
- The point-of-care (microfluidic) cohort is included. This does not account for the numbers either. The STAR Methods give it 5 subjects, so adding it gives 97 (or 105 with the proof-of-concept cohort), and no combination of the stated cohorts gives 55 cancers and 46 benign lesions.
- The tables count lesions rather than subjects. The Figure 4 legends count lesions (15 + 25 and 23 + 29), and these also total 92 and match the site sizes (40 + 21 + 19 + 12), so lesions and subjects coincide here.
- Oropharyngeal lesions were added back. The Results say these were excluded from the discovery and validation studies, and no count of them is given that would produce +1 cancer and +8 benign.
- Only the validation cohorts are tabulated. These contain 29 cancers and 23 benign lesions (52 subjects), which does not match the table.
- Rounding, or a different interval method. Neither works. 53/54 = 98.15% would print as 98.1, not 98.2, and its exact lower limit is 90.11, not 90.28. With FP = 8, a specificity of 82.6% requires TN = 38, i.e. 46 benign lesions. Every printed interval is reproduced to two decimals by standard methods applied to the printed cells (54/55, 38/46, 54/62, 38/39), so the cells, not the interval method, determine the printed values.
- A conversion or typesetting artifact. Excluded. The publisher's own typeset PDF (bundled as "Document S2. Article plus supplemental information") shows the same Table 1 cells, text and abstract as the PMC archive. In the archived XML each count sits in its own table cell, with no stray signs or characters.
- The text, not the table, is wrong (the cohort really had 55 cancers and 46 benign lesions). Contradicted by the paper's own records. The four cohort counts are given in several independent places (Results text, Figure 4 legends, power calculation, STAR Methods), and the subject-level Table S1 lists exactly 54 cancers and 38 benign lesions in these cohorts, with TP 53, TN 30, FP 8 and FN 1.
Status
- Version of record. The publisher's HTML could not be loaded (the DOI redirect returned only a redirect stub, and cell.com returned HTTP 403). I checked instead the Elsevier-typeset PDF of the article (mmc4.pdf, "Cell Reports Medicine, 5 (2024) 101447", created 2024-03-15) from the Europe PMC supplementary-files bundle, and the Europe PMC full-text XML. Both match the PMC archive: abstract (p. 2), "92 subjects" (p. 6), "n = 92" and "Among 92 subjects" (p. 7), Table 1 (p. 8) and the 17.4% sentence (p. 11). Every quote above was checked verbatim against the PMC-archived text.
- Supplements. I downloaded the Europe PMC supplementary-files bundle and opened Table S1 (mmc2.xlsx), which gives each subject's diagnosis, BDI value and TP/TN/FP/FN label. The per-cohort counts above were tallied from it (only aggregate counts are reported here). The bundle also holds Document S1 (Figures S1–S7, Tables S2–S4), Data S1 (whole-exome data) and the article PDF.
- Corrections and comments. As of 2026-10-23 I found no correction, erratum, retraction or expression of concern. Crossref lists no update relations for the DOI, and PMC and Europe PMC (PMID 38442713) list no correction or comment links. The PMC record carries one "retraction-forward" link, to PMC10830194; it belongs to reference 26, a cited 2022 Stem Cells International paper that was later retracted, and is not a notice about this article. PubPeer's API and search page refused automated access (HTTP 403, a Cloudflare challenge), so PubPeer could not be checked directly. A web search for the title together with "correction" and "PubPeer" returned only the article and press coverage, so the absence of a PubPeer thread is not fully confirmed.
- Sources. PMC article PMC10983043; Europe PMC full text and supplementary files (mmc1–mmc4); Crossref; PubPeer (not reachable).
Suggested correction
- Replace the Table 1 cells with the counts from Table S1 (TP 53, TN 30, FP 8, FN 1; N = 92) and recompute the four estimates and their CIs: sensitivity 98.1% (90.1–99.95), specificity 78.9% (62.7–90.4), PPV 86.9% (78.1–92.5), NPV 96.8% (81.0–99.5).
- Update the Abstract ("82.6% (95% CI 68.6–92.2)"), the Highlights ("83%"), the Results text ("specficity of 82.6%") and the Discussion's biopsy estimate (17.4% becomes about 21.1%). In the Discussion, describe 82.6% (corrected, 78.9%) as specificity rather than "FP rate".
- Either describe the pooled figures as discovery-plus-validation results, or report the validation-only estimates in the Abstract and Highlights (sensitivity 28/29 = 96.6%, specificity 18/23 = 78.3%), since the cutoff was selected in the discovery cohort.