← Back to the plain-language case
Abstract reports all-cause grade ≥3 adverse event figures as treatment-related adverse events
Lancet Reg Health Eur (2024) · doi:10.1016/j.lanepe.2024.100875 · PMC10924203
Summary
This prospective real-world cohort of 151 patients treated with cemiplimab names grade ≥3 treatment-related adverse events (TRAEs) as one of its primary endpoints. The Abstract reports "Sixty-eight TRAEs occurred in 29.8% of patients." In the Results, 68 events in 45/151 patients (29.8%) is the count for grade ≥3 adverse events of any attribution. Grade ≥3 TRAEs were 42 events in 28/151 patients (18.5%), and the entries of Table 4 sum to 42. The Abstract therefore reports a primary safety endpoint with the all-cause figures, which overstate it by 26 events and 11.3 percentage points. The direction is unfavourable to the drug, so the paper's conclusion that cemiplimab was safe is not weakened, but anyone who takes the safety rate from the Abstract gets the wrong number.
What the paper reports
Abstract, Methods (primary endpoints):
Primary endpoints were objective clinical benefit rate (CBR), defined as objective response (OR) or stable disease (SD) at 16 weeks, physician-assessed CBR, defined as clinician’s documentation of improved disease or SD based on evaluation of all available clinical parameters at 16 weeks, objective response rate (ORR), and safety, defined as grade ≥ 3 treatment related adverse events (TRAEs) occurring up to 30 days after last drug administration.
Abstract, Findings:
Between February 2021 and December 2022, 151 patients started treatment.
Sixty-eight TRAEs occurred in 29.8% of patients. Most commonly reported TRAE was a kidney transplant rejection (9.5%).
Abstract, Interpretation:
Cemiplimab proved highly effective and safe in this real-world cohort of patients with laCSCC or mCSCC, confirming its therapeutic value in the treatment of advanced CSCC in daily clinical practice.
Methods:
Safety was measured by the frequency of grade ≥ 3 treatment related adverse events (TRAEs) and serious adverse events (SAEs) occurring up to 30 days after the last administration of drug.
All patients that received at least one administration of cemiplimab were included in the efficacy and safety analyses.
Results, Safety (the spelling "TREAs" is the paper's):
A total of 68 AEs of grade ≥ 3 occurred in 45 of 151 patients (29.8%). Of all grade ≥ 3 AEs, 42 (61.8%) were TREAs (Table 4), which occurred in 28 of 151 patients (18.5%). Of note, the most commonly reported TRAE was rejection of a kidney transplant (n = 4, 9.5%).
Other commonly reported TRAEs were hypertension (n = 3, 4.8%) and increased gamma glutamyl transferase (n = 3, 4.8%).
Table 4 title:
Possibly, probably, or definitely related adverse events grade ≥ 3.
Table 4 lists 31 event types with counts by grade 3, 4 and 5. Its only footnote reads "These were originally reported as acute kidney injuries", referring to the kidney transplant rejection row (2 grade 3, 2 grade 4).
What the paper's own numbers show
Method. I summed the grade 3, 4 and 5 columns of Table 4. I then recomputed each safety proportion from the counts printed in the Results, using N = 151, the treated cohort that the Methods say forms the safety population. For the per-event percentages (kidney transplant rejection, hypertension, GGT increase), I listed every denominator that reproduces the printed percentage after rounding to one decimal. Every number below is printed by recompute.py.txt.
| Quantity | Location | Reported | Recomputed from the paper's numbers |
|---|---|---|---|
| Grade ≥3 TRAE events | Abstract, Findings | "Sixty-eight TRAEs" | 42 (Table 4: 34 grade 3 + 7 grade 4 + 1 grade 5; Results also say 42) |
| Patients with a grade ≥3 TRAE | Abstract, Findings | 29.8% | 28/151 = 18.5% (Results) |
| All grade ≥3 AEs, any attribution | Results, Safety | 68 AEs in 45/151 (29.8%) | 45/151 = 29.8%; 45 is the only count out of 151 that rounds to 29.8% |
| Share of grade ≥3 AEs that were TRAEs | Results, Safety | 42 (61.8%) | 42/68 = 61.8% |
| Grade ≥3 TRAEs, total in Table 4 | Table 4 | (no total printed) | 42 events across 31 rows |
| Abstract minus TRAE figures | derived | — | 68 − 42 = 26 events (1.62×); 45 − 28 = 17 patients; 29.8 − 18.5 = 11.3 percentage points (1.61×) |
| Kidney transplant rejection | Abstract; Results | 9.5% (n = 4) | 4/42 = 9.5% of TRAE events; 42 is the only denominator that gives 9.5%. As a share of patients, 4/151 = 2.6% |
| Hypertension; GGT increase (side finding) | Results, Safety | n = 3, 4.8% each | 3/42 = 7.1% on the kidney-rejection denominator; 4.8% needs a denominator of 62 or 63 (3/68 = 4.4%) |
| Fatal AEs | Results, Safety | 3 (2%) | 3/151 = 2.0% |
| Discontinued because of an AE | Results, Safety | 15 (9.9%) | 15/151 = 9.9% |
| Kidney rejection among transplant recipients | Discussion | 4 of 7 (57.1%) | 4/7 = 57.1% |
Both numbers in the Abstract sentence, 68 events and 29.8%, equal the Results figures for all grade ≥3 adverse events. Neither equals the TRAE figures (42 events, 18.5%). The next Abstract sentence, which gives kidney transplant rejection as 9.5%, uses the TRAE event count of 42 as its denominator. So the two consecutive Abstract sentences rest on different event totals. All the other safety percentages in the Results reproduce from their counts, apart from the 4.8% figures noted as a side finding.
Figure
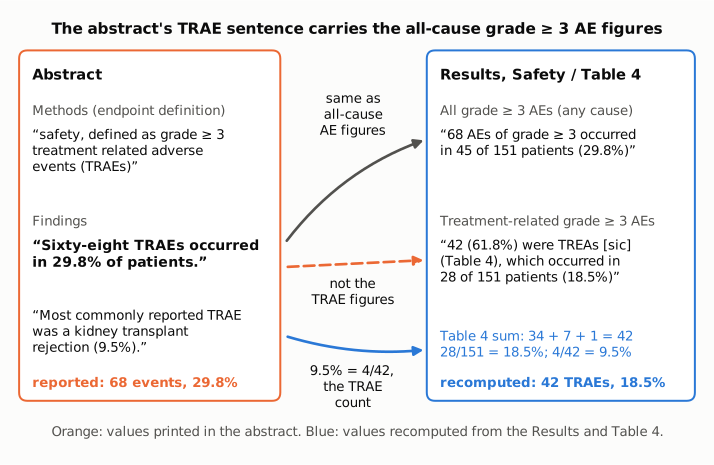
Figure 1. Left: the Abstract's definition of the safety endpoint and its two safety sentences, with the values it prints in orange. Right: the Results, Safety paragraph and Table 4, with the TRAE values recomputed from them in blue. The grey arrow shows that the Abstract's "68 TRAEs ... 29.8% of patients" equals the Results figures for all grade ≥3 AEs regardless of attribution (68 events, 45/151 patients). The dashed orange arrow marks the mismatch with the Results figures for treatment-related events (42 events, 28/151 = 18.5%). The blue arrow shows that the Abstract's kidney rejection figure, 9.5%, is 4/42, so it uses the TRAE count that the preceding sentence does not. All excerpts are verbatim; "[sic]" marks the paper's spelling "TREAs".
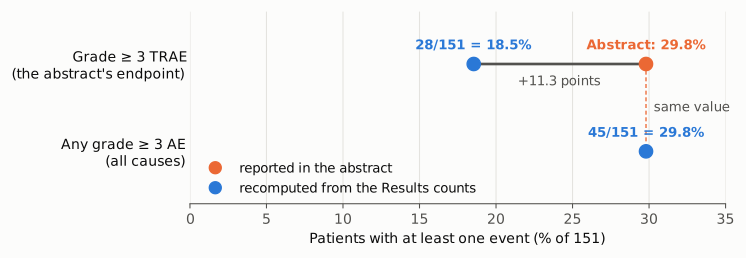
Figure 2. Percentage of the 151 treated patients with at least one grade ≥3 event. Top row: the primary safety endpoint (grade ≥3 TRAE), as printed in the Abstract (orange, 29.8%) and as computed from the Results count of 28 patients (blue, 18.5%). Bottom row: any grade ≥3 AE, computed from the Results count of 45 patients (blue, 29.8%). The Abstract's value lies on the all-cause row's value, 11.3 percentage points above the treatment-related rate. The axis starts at zero.
Why it matters
The Abstract names grade ≥3 TRAEs as a primary endpoint and gives one number for it. Readers who see only the Abstract (the PubMed record, indexing services, systematic reviews and health technology assessments that extract abstract-level data) will take the real-world grade ≥3 TRAE rate of cemiplimab in this cohort to be 29.8% of patients, with 68 events. The paper's own Results give 18.5% of patients and 42 events. The relative overstatement is about 1.6-fold. Real-world cohorts like this one are cited mainly to compare toxicity in older, frailer patients with the registration trials, and the Discussion notes that the cohort was older (median 78 years vs 72) and included patients with ECOG ≥ 2, autoimmune disease and organ transplants. A rate inflated by attribution-independent events would make the drug look more toxic in this population than the paper's data show.
The error does not reverse any conclusion. The correct TRAE rate is lower, so the Interpretation, "Cemiplimab proved highly effective and safe", is if anything better supported. The efficacy endpoints, the all-cause safety figures in the Results, Table 4, the fatal-AE and discontinuation figures, and the kidney transplant findings are unaffected. The title, the Research-in-context panel and the closing paragraphs of the Discussion (the article has no separate Conclusions section) give no safety number.
The side finding is minor. Hypertension and GGT increase (3 events each) are given as 4.8%, which no denominator printed in the paper reproduces: 3/42 = 7.1%, 3/68 = 4.4%, 3/28 = 10.7%. It does not change the ranking of events.
Explanations considered
- "TRAEs" in the Abstract is loose wording for adverse events in general. This does not account for the numbers. The Abstract's own Methods sentence defines the safety endpoint as "grade ≥ 3 treatment related adverse events (TRAEs)", and the paper's Methods use the same definition. The next Abstract sentence also uses "TRAE" in the treatment-related sense, with a percentage computed on 42 TRAEs.
- 68 is a count of TRAEs of all grades, or of a different category. This does not account for the numbers. The paper reports no all-grade TRAE count anywhere. The pair 68 events / 29.8% equals, in both numbers, the Results figure for all grade ≥3 AEs, and 45 is the only patient count out of 151 that rounds to 29.8%. A second category that happens to match both would be a coincidence.
- A different population or denominator. This does not account for the numbers. The Abstract and the Results both use the 151 treated patients, and the Methods state that all patients with at least one dose form the safety population. 28/151 = 18.5% and 45/151 = 29.8% both reproduce exactly.
- A different observation window. This does not account for the numbers. The Abstract and the Methods use the same window (up to 30 days after the last dose), and the Results give no second window.
- Table 4 covers only a subset of TRAEs. This does not account for the numbers. Table 4 is titled as the possibly, probably or definitely related grade ≥3 events, and it sums to 42, the same count the Results give for TRAEs.
- A conversion artifact in the archived text. This is excluded. The publisher's typeset PDF deposited in PMC, the Europe PMC full-text XML and the PubMed abstract all carry the same sentence (see Status).
- The 9.5% kidney rejection figure shows that the Abstract uses another TRAE total. This does not account for the numbers. 9.5% reproduces only with 42 as the denominator (4/42), which is the Results TRAE count, not 68 (4/68 = 5.9%). The 9.5% is a share of TRAE events, not of patients (4/151 = 2.6%); the Abstract's wording "(9.5%)" does not say which, but the Results give the same figure as an event count.
- The hypertension and GGT percentages (4.8%) use a different but stated denominator. No such denominator is stated. 4.8% reproduces only with 62 or 63 as the denominator, and neither number appears in the safety section. This is a separate, minor inconsistency and does not bear on the main finding.
Status
- Version of record. As of 2026-10-24. The publisher HTML (thelancet.com, sciencedirect.com) could not be fetched automatically: doi.org redirects to linkinghub.elsevier.com, which returns only a redirect stub, and both publisher sites returned HTTP 403. I checked the publisher's typeset PDF as deposited in the PMC Open Access dataset (PMC10924203.1.pdf; PDF metadata: Elsevier, "The Lancet Regional Health - Europe, 39 (2024) 100875", 12 pages) and the Europe PMC full-text XML. Both carry the quoted Abstract and Results sentences word for word, and Table 4 on page 10 of the PDF has the same 31 rows and values as the XML. The PubMed abstract (PMID 38464480) carries the same "Sixty-eight TRAEs occurred in 29.8% of patients" sentence. Every quotation above was confirmed verbatim against the PMC-archived text with
src/show.py. - Supplements. The single supplementary file (mmc1.pdf, 5 pages) contains Supplementary Tables 1A–1C (baseline characteristics by clinical benefit and response) and Supplementary Fig. S1 (flow diagram). Its only adverse-event content is the count of 15 discontinuations because of an adverse event. It has no grade ≥3 AE or TRAE listing that could reconcile 68 with 42 events or 45 with 28 patients. The data sharing statement says the raw data are available on request.
- Corrections and comments. I found no correction, erratum, expression of concern or retraction. Crossref lists no update relations for the DOI (update-to and updated-by absent, relation empty), and PMC and Europe PMC list no notices. A web search for corrections or comments on the article found none. The PubPeer API and search page refused automated access (Cloudflare challenge and HTTP 403), so PubPeer could not be checked directly.
- Sources. PMC article PMC10924203; PMC Open Access PDF PMC10924203.1; Europe PMC full-text XML and supplementary files for PMC10924203; PubMed 38464480; Crossref record for 10.1016/j.lanepe.2024.100875.
Suggested correction
- In the Abstract, Findings, replace "Sixty-eight TRAEs occurred in 29.8% of patients" with the treatment-related figures given in the Results, for example: "Forty-two grade ≥ 3 TRAEs occurred in 28 of 151 patients (18.5%)." If the authors also wish to report all-cause events, they can add: "Grade ≥ 3 AEs of any attribution (68 events) occurred in 45 patients (29.8%)."
- In the Abstract, state that the kidney transplant rejection figure is a share of TRAE events (4 of 42, 9.5%), or give it per patient (4 of 151, 2.6%; 4 of the 7 transplant recipients).
- In the Results, Safety, correct the percentages for hypertension and increased GGT (3 events each) to the denominator used for kidney transplant rejection (3/42 = 7.1%), or state the denominator used. Correct the spelling "TREAs" to "TRAEs".