← Back to the plain-language case
Subgroup effects called significantly different although their 95% CIs overlap, contrary to the paper's criterion
JAMA Network Open (2024) · doi:10.1001/jamanetworkopen.2023.56619 · PMC10891466
Summary
The paper asks whether food insecurity modifies the association between SNAP receipt and nonadherence to antihypertensive medication. Its Methods say two subgroup estimates count as significantly different only if their 95% CIs do not overlap, and its Results then call the food-insecure estimate (−13.6 percentage points [pp]; 95% CI −25.0 to −2.3) and the food-secure estimate (5.0 pp; 95% CI −15.8 to 25.7) "statistically significantly different". Those intervals overlap from −15.8 to −2.3, and a Wald test on the same intervals gives a difference of 18.6 pp (95% CI −5.1 to 42.3; p = 0.12). The paper answers yes to its own effect-modification question, but neither its stated criterion nor a conventional test supports that answer. The food-insecure estimate on its own is not affected.
What the paper reports
The research question (Abstract, Key Points, Question):
"Is receipt of Supplemental Nutrition Assistance Program (SNAP) benefits associated with nonadherence to antihypertensive medications and, if so, does this association vary by food insecurity status?"
The criterion for effect modification (Methods, Statistical Analysis, second paragraph):
"The potential effect modification of food insecurity was tested by evaluating for statistical differences in the magnitude and direction of the PATEs for the food-secure and food-insecure subgroups; PATEs were considered statistically significantly different if their respective 95% CIs did not overlap."
The two subgroup estimates (Results, "Association Between SNAP Receipt and Nonadherence to Antihypertensive Medications"):
"Similarly, the rate of nonadherence to antihypertensive medication was similar (385 [56.7% weighted] vs 2671 [55.2% weighted]; PATE, 5.0 [95% CI, -15.8 to 25.7]) between SNAP recipients and nonrecipients among the 5354 patients who did not report experiencing food insecurity."
"In contrast, among the subgroup of 1338 antihypertensive medication users who experienced food insecurity, the rate of nonadherence to antihypertensive medications was 8.17 percentage points lower among SNAP recipients compared with nonrecipients (302 [56.0% weighted] vs 491 [60.0% weighted]; PATE, -13.6 [95% CI, -25.0 to -2.3])."
The conclusion drawn from them (Results, same paragraph, the sentence that follows):
"The observed PATE estimates among the food-secure vs food-insecure subgroups were statistically significantly different, suggesting that food insecurity modified the association between SNAP and nonadherence to antihypertensive medication therapy."
Table 2 gives the same values: food insecure, 302 (56.0) vs 491 (60.0), PATE −13.6 (−25.0 to −2.3); food secure, 385 (56.7) vs 2671 (55.2), PATE 5.0 (−15.8 to 25.7); overall, 687 (56.4) vs 3162 (55.8), PATE 1.7 (−21.2 to 24.6).
The finding is carried into the Discussion (first paragraph):
"Among a US sample of patients with hypertension identified from a linked, nationally representative dataset, we observed that SNAP had a differential association with nonadherence to antihypertensive medications between food-secure and food-insecure subgroups."
and into the Strengths (Discussion, Strengths and Limitations):
"Second, this study presented data suggesting that the potential consequences of SNAP receipt on adherence to antihypertensive medications are greatest among the food-insecure population. Thus, we have identified the food-insecure hypertension population as a target for food assistance intervention to address adherence to antihypertensive medications, especially when food assistance resources are limited."
(Quotes are from the PubMed Central archive, which prints minus signs as hyphens; the publisher's page prints the same values with true minus signs.)
What the paper's own numbers show
Method. All inputs come from Table 2 and the Results text. (1) The paper's criterion is applied as written: do the two reported 95% CIs overlap? (2) Each standard error (SE) is recovered from its CI as (upper − lower)/(2 × 1.96). Both CIs are symmetric about their point estimates, so this is valid. (3) The two subgroups are disjoint sets of participants, and the Methods describe a stratified analysis with subgroup-specific propensity scores. The difference is therefore tested with the usual Wald test for two independent estimates, z = (5.0 − (−13.6)) / √(SE₁² + SE₂²). (4) To check whether a different confidence level would rescue the claim, the confidence level at which the two intervals just stop overlapping is also computed. Every number below is printed by recompute.py.txt.
| Quantity | Location | Reported | Recomputed |
|---|---|---|---|
| Food-insecure PATE (95% CI) | Table 2; Results; Abstract | −13.6 (−25.0 to −2.3) | Symmetric (half-widths 11.4 / 11.3); SE 5.79 pp; single-group p = 0.019 |
| Food-secure PATE (95% CI) | Table 2; Results | 5.0 (−15.8 to 25.7) | Symmetric (half-widths 20.8 / 20.7); SE 10.59 pp |
| Do the two 95% CIs overlap? (paper's criterion) | Methods vs Results | "statistically significantly different" | Yes, they overlap, from −15.8 to −2.3 (13.5 pp). The criterion is not met |
| Food-insecure point estimate inside the food-secure 95% CI? | Table 2 | — | Yes (−13.6 lies within −15.8 to 25.7) |
| Difference, food secure − food insecure | derived from Table 2 | "statistically significantly different" | 18.6 pp, SE 12.07, 95% CI −5.1 to 42.3 (includes 0) |
| Wald test of the difference | derived from Table 2 | no test statistic given | z = 1.54; two-sided p = 0.123 (one-sided p = 0.062) |
| Confidence level at which the two CIs stop overlapping | derived | — | Only below 74.4%. The 90%, 85.1%, 83.4%, 80% and 75% intervals all overlap |
| Confidence level at which non-overlap would match p < 0.05 for these SEs | derived | — | 85.1%. The intervals overlap at that level too |
| Correlation between the subgroup estimates needed for p = 0.05 | derived | — | 0.45 |
| Nonadherent counts | Table 2; Results | 687; 3162; 3849 | 302 + 385 = 687; 491 + 2671 = 3162; 687 + 3162 = 3849 (consistent) |
| Subgroup sizes | Results | 5354 food secure; 1338 food insecure | 6692 − 1338 = 5354; 540 + 798 = 1338 (consistent) |
| Food-insecure gap described in the text | Results | "8.17 percentage points lower" | Weighted crude gap 56.0 − 60.0 = −4.0 pp; unweighted 55.9% − 61.5% = −5.6 pp; adjusted PATE −13.6 pp. 8.17 matches none of them (separate, minor) |
| Model behind the PATEs | Methods and Abstract vs Table 2 footnote b | Methods and Abstract: probit; footnote b: "from a logit model" | Internal inconsistency in the description (minor; does not change the CIs) |
The counts and sample sizes are mutually consistent, so the problem is not in the reported data. It lies only in the inference drawn from the two intervals.
Figure
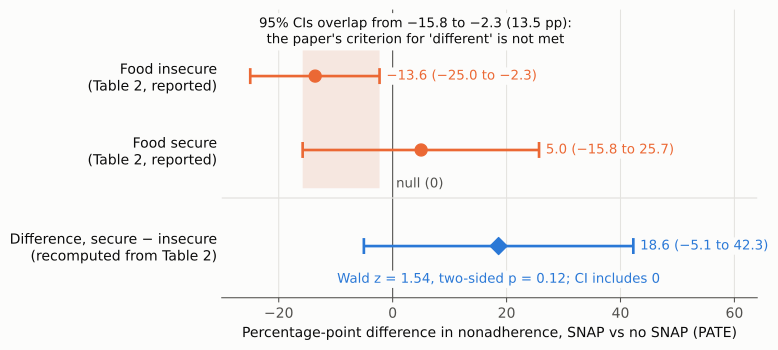
Figure 1. All values are on one percentage-point axis (SNAP recipients minus nonrecipients; negative means less nonadherence with SNAP). Orange: the two subgroup PATEs and 95% CIs as reported in Table 2. The shaded band marks where the two intervals overlap (−15.8 to −2.3, 13.5 pp); under the paper's stated rule, any overlap means the estimates are not significantly different. Blue: the difference between subgroups (food secure − food insecure), recomputed from the same table, 18.6 pp (95% CI −5.1 to 42.3; z = 1.54; p = 0.12). The thin vertical line labelled "null (0)" marks no effect for the subgroup rows and no difference for the bottom row; the interval for the difference includes it.
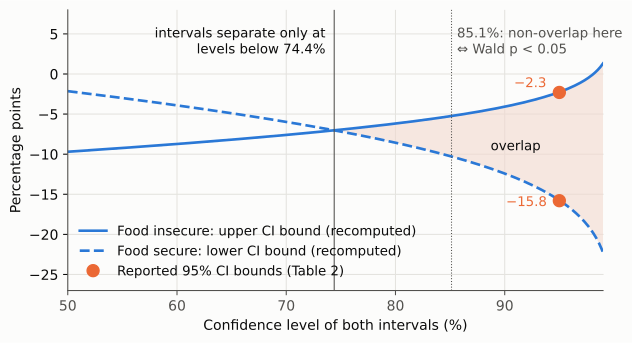
Figure 2. Would a different confidence level change the conclusion? Blue curves: the food-insecure upper bound (solid) and the food-secure lower bound (dashed), recomputed from the SEs implied by Table 2 for confidence levels from 50% to 99%. Orange points: the reported 95% bounds (−2.3 and −15.8). The intervals overlap (shaded) at every level above 74.4%. That includes 85.1%, the level at which non-overlap of these two particular intervals would correspond to a two-sided Wald p < 0.05 (dotted line).
Why it matters
Effect modification by food insecurity is the paper's stated question. It is the second half of the Key Points question, it is the Objective ("To evaluate whether receipt of SNAP benefits can modify the consequences of food insecurity on nonadherence to antihypertensive medications."), and it is the purpose of the prespecified stratified analysis. The claim that the association differs by food-insecurity status underpins:
- the Key Points Findings and the Abstract Results ("among the food-insecure subgroup but not among their food-secure counterparts");
- the Key Points Meaning ("especially among food-insecure individuals") and the Abstract and main Conclusions ("especially if they are experiencing food insecurity");
- the opening of the Discussion ("a differential association ... between food-secure and food-insecure subgroups");
- the Strengths paragraph, which says the consequences of SNAP receipt are "greatest among the food-insecure population" and names that population "as a target for food assistance intervention".
On the paper's own numbers, the data are compatible with no difference between the subgroups: the difference has a 95% CI of −5.1 to 42.3 pp. A result that is significant in one subgroup and not in the other is not evidence that the subgroups differ, and the paper's non-overlap rule, conservative as it is, was the guard it set against that inference. What survives is the food-insecure estimate on its own (−13.6 pp, CI excluding 0, p ≈ 0.02 before any adjustment for multiple subgroups). The literal wording "associated ... among the food-insecure subgroup but not among their food-secure counterparts" therefore remains accurate as a description of the two subgroup estimates. The statement that food insecurity modified the association, the "differential association", and the targeting recommendations built on it are not supported. The hedged overall conclusion ("may be less likely ... especially if") is weakened rather than reversed.
Explanations considered
- The table and the text give different numbers. They do not. Table 2, the Results text and the Abstract all give −13.6 (−25.0 to −2.3); Table 2 and the Results give 5.0 (−15.8 to 25.7). Neither is a typo of the other.
- A sign was lost in conversion (for example, −2.3 was meant to be +2.3). No. Both intervals are symmetric about their point estimates (half-widths 11.4/11.3 and 20.8/20.7), and the publisher's own page prints these values with true minus signs. A positive upper bound would also make the food-insecure estimate itself non-significant, which contradicts the Abstract.
- Different estimands, scales or models. Both subgroup PATEs are average marginal effects on the percentage-point scale from the same weighted model specification. The probit/logit wording differs between the Methods and the Table 2 footnote, but that affects both subgroups alike and does not change the printed CIs.
- "Magnitude and direction" means opposite-signed point estimates are enough. The Methods attach that phrase to a statistical test with a specific rule (non-overlap of 95% CIs). Opposite signs of the point estimates do not satisfy that rule; the food-secure interval (−15.8 to 25.7) contains the food-insecure point estimate.
- A formal interaction test was run but not reported. The Methods name no such test, and Supplement 1 (eAppendix 2, the weighting and regression specification) contains no interaction term, heterogeneity test or other criterion. An unreported test cannot be ruled out, but the stated criterion is not met and a Wald test on the published intervals gives p = 0.12.
- A one-sided test, or a lower confidence level. Nothing in the paper states either. One-sided p = 0.062. The intervals separate only at confidence levels below 74.4% (Figure 2).
- The subgroup estimates are correlated, so the Wald SE is too large. For p = 0.05 the two estimates would need a correlation of about 0.45. They come from disjoint sets of participants with separately fitted weights; shared survey strata and clusters can induce some covariance, but one of that size is not plausible. In any case, the paper's own non-overlap criterion does not depend on the correlation.
- The error was corrected after publication. No correction, erratum or retraction was found (see Status).
One further observation does not change the conclusion. The overall-sample interval (1.7, −21.2 to 24.6; half-width 22.9) is about twice as wide as the food-insecure interval (half-width 11.4), although it covers five times as many participants. Without data or code this cannot be examined further; the analysis above uses the subgroup intervals exactly as published.
Status
As of 2026-10-23:
- Version of record. The publisher's page (doi.org redirects to jamanetwork.com, article 2815447) was read on 2026-10-23. It contains the criterion sentence ("PATEs were considered statistically significantly different if their respective 95% CIs did not overlap."), the "statistically significantly different, suggesting that food insecurity modified the association" sentence, the "8.17 percentage points lower" sentence, and the Table 2 rows food insecure −13.6 (−25.0 to −2.3) and food secure 5.0 (−15.8 to 25.7). The PMC archive (
src/show.py) and the Europe PMC full-text XML carry the same sentences and numbers, and the "from a logit model" footnote. The problem is in the version of record, not introduced by conversion. - Supplements. Supplement 1 (eAppendices 1 and 2, eFigure, eTable, eReferences) contains no subgroup comparison, interaction term or additional subgroup estimates. Supplement 2 is the Data Sharing Statement ("Data available: No"). Neither resolves the discrepancy, and no data or code are available to re-estimate the subgroup models.
- Corrections and comments. Crossref update metadata, PMC notices and Europe PMC notices show no correction, erratum, expression of concern or retraction; Europe PMC searches for an erratum in JAMA Network Open returned no hits. The only linked item is an invited commentary (PMID 38393734, "Food Security to Medication Adherence-Connecting Needs"), which is not a correction. The publisher page shows no correction notice. PubPeer could not be checked (its API and search page returned HTTP 403/404 to automated requests), and a general web search was not available in this session.
- Sources. https://doi.org/10.1001/jamanetworkopen.2023.56619 ; https://pmc.ncbi.nlm.nih.gov/articles/PMC10891466/ ; https://www.ebi.ac.uk/europepmc/webservices/rest/PMC10891466/fullTextXML ; Crossref REST API record for the DOI.
Suggested correction
- Replace "The observed PATE estimates among the food-secure vs food-insecure subgroups were statistically significantly different, suggesting that food insecurity modified the association …" with a statement that matches the stated criterion, for example: "The 95% CIs for the food-secure and food-insecure subgroups overlapped; by our prespecified criterion, the PATEs were therefore not statistically significantly different, and we did not find statistical evidence that food insecurity modified the association."
- Preferably also report a direct estimate of the difference between subgroups (an interaction model, or a test of the difference between the two PATEs), with its CI and p value. From the published intervals this is approximately 18.6 pp (95% CI −5.1 to 42.3; p ≈ 0.12).
- Revise the Key Points (Findings, Meaning), the Abstract Results and Conclusions, the opening of the Discussion, the Strengths paragraph and the Conclusions so that they report the food-insecure estimate without presenting a difference between subgroups as established.
- Correct "8.17 percentage points lower" to agree with Table 2 (adjusted PATE −13.6; weighted crude difference −4.0), and make footnote b of Table 2 ("from a logit model") agree with the probit model described in the Methods and the Abstract, or vice versa.