← Back to the plain-language case
Abstract reports a fetal HLA-B*39:06 effect at P < 0.001; its own P-value is 0.00384
Int J Epidemiol (2023) · doi:10.1093/ije/dyad142 · PMC10859143
Summary
The abstract and the Results say that HLA-B39:06 has a fetal allelic effect on birthweight at P < 0.001, the paper's Bonferroni threshold (α = 0.05/50 = 0.001). The same Results paragraph, and Supplementary Tables S7 and S8, give that fetal P-value as Pf = 3.84 × 10⁻³. The printed estimate and 95% CI, 0.090 (0.029, 0.151), imply P = 3.83 × 10⁻³, and the supplement's estimate and SE imply 3.88 × 10⁻³. So the reported Pf is internally consistent and the "P < 0.001" label is not: the effect is nominally significant but fails the threshold the paper set. This was the only fetal effect of a non-HLA-C allele that the abstract presents as passing the threshold, and no allele in Table S7 has an unconditional fetal P below 0.001. A second, smaller slip: the maternal 95% CI printed for B39:06 is not centred on its estimate.
What the paper reports
Quotations are verbatim from the PMC-archived text. Exponents are written here as superscripts, as they appear in the publisher's XML; the PMC plain text renders them as "10-3".
Abstract, Results:
Applying our SEM to imputed classical HLA alleles and own and offspring BW from the UKB replicated the previously reported association at the HLA-C locus and revealed strong evidence for maternal (HLA-A03:01, B35:01, B39:06, P <0.001) and fetal allelic effects (HLA-B39:06, P <0.001) of non-HLA-C alleles on BW.
Methods, "Application of SEM to BW data in the UK Biobank", on the tests used:
In addition to one degree of freedom tests where we evaluated the significance of the maternal and fetal components individually, we also compared the full model with a constrained model in which we fixed the maternal and fetal effects of the allele of interest to zero (i.e. a two degree of freedom test; Supplementary Note 6, Supplementary Table S6, available as Supplementary data at IJE online).
Results, "Empirical analysis in UK biobank", the significance threshold:
We further set a more stringent threshold for significance using Bonferroni correction for 50 tests (α = 0.05/50 = 0.001), on the rationale that the locus with the most coded alleles (HLA-B, 25 alleles) involved 50 statistical tests (i.e. one maternal and one fetal effect for each coded allele).
Same paragraph, next sentence:
Three of the alleles exhibited significant evidence for maternal effects, with P-values less than 0.001 (A03:01, B35:01, B39:06, labelled in Figure 4), and the HLA- B39:06 allele exhibited a significant fetal effect at P <0.001 (labelled in Figure 4).
Same paragraph, two sentences later:
The allele with the largest estimated maternal and fetal effects was B*39:06, which had a relatively low allele frequency of 0.69% and consequently wide confidence intervals for the effect sizes [maternal effect = -0.111 (-0.151, -0.029), Pm = 7.10 × 10⁻⁴; fetal effect = 0.090 (0.029, 0.151), Pf = 3.84 × 10⁻³].
Figure 4 legend:
Triangles indicate alleles where tests for both maternal and fetal effects reached the threshold; solid dots represent alleles which did not (P < 0.05). Alleles with P < 0.001 are explicitly labelled.
Discussion, fifth paragraph (first and last sentences):
The HLA-B*39:06 allele displayed the largest estimated maternal and fetal effects among all associated alleles.
These associations could be partly attributable to HLA-B*39:06, as our results indicate a positive fetal and a negative maternal effect of this allele on BW.
Supplementary Table S7, row B*3906 (columns: frequency; maternal effect, SE, P; fetal effect, SE, P):
B*3906 | 0.69% | -0.1108 | 0.0327 | 7.10E-04 | 0.0901 | 0.0312 | 3.84E-03
What the paper's own numbers show
Method. I treated the paper's 1-df maternal and fetal tests as Wald tests: two-sided P = 2Φ(−|β/SE|), with the SE taken either from Table S7 or from the printed 95% CI as (upper − lower)/(2 × 1.96). Each P was compared with the paper's own threshold, 0.001. To check that this approximates the paper's SEM tests, I applied it to the other effects quoted in the Results; it reproduces their P-values to within about 3% (for example A03:01 maternal 8.98 × 10⁻⁸ against a reported 9.21 × 10⁻⁸, and DRB111:04 fetal 1.36 × 10⁻³ against 1.34 × 10⁻³). Every number below is printed by recompute.py.txt.
| Quantity | Location | Reported | Recomputed from the paper's own numbers |
|---|---|---|---|
| Bonferroni threshold | Results | α = 0.05/50 = 0.001 | 0.0010 |
| B*39:06 fetal P, as labelled | Abstract; Results | "P <0.001" | not supported (next rows) |
| B*39:06 fetal P, as printed | Results; Tables S7, S8 | Pf = 3.84 × 10⁻³ | 3.84 times the threshold; Bonferroni-adjusted P = 50 × Pf = 0.192 |
| B*39:06 fetal P from the printed CI | Results: 0.090 (0.029, 0.151) | — | SE 0.0311, z = 2.89, P = 3.83 × 10⁻³ |
| B*39:06 fetal P from β and SE | Table S7: 0.0901, SE 0.0312 | 3.84E-03 | z = 2.89, P = 3.88 × 10⁻³; 95% CI (0.029, 0.151), matching the text |
| B*39:06 fetal P, one-sided | derived from Table S7 | — | 1.94 × 10⁻³, still above 0.001 |
| Fetal estimate needed for P < 0.001 at SE 0.0312 | derived | — | |z| ≥ 3.29, so β ≥ 0.103 (the estimate is 0.090) |
| B*39:06 fetal 99.9% CI (the interval matching α = 0.001) | derived from Table S7 | — | (−0.013, 0.193), which includes zero |
| B*39:06 maternal P | Results; Table S7: −0.1108, SE 0.0327 | Pm = 7.10 × 10⁻⁴ | 7.03 × 10⁻⁴, below 0.001; the maternal claim holds |
| B*39:06 maternal 95% CI | Results | −0.111 (−0.151, −0.029) | (−0.175, −0.047) from Table S7. The printed interval's midpoint is −0.090, not −0.111; it is the fetal interval (0.029, 0.151) with the signs reversed |
| Alleles with unconditional fetal P < 0.001 | Table S7 (all 19 alleles with a maternal or fetal P < 0.05) | the text names B*39:06 | none; the smallest fetal P is DRB1*11:04, 1.34 × 10⁻³ |
| Alleles with maternal P < 0.001 | Table S7 | A03:01, B35:01, B*39:06 | A03:01, B35:01, B*39:06 (agrees) |
| B*39:06 fetal P, conditional on rs9366778 and rs6911024 | Table S8 | 6.04E-04 | 6.13 × 10⁻⁴, below 0.001 (a different model; see Explanations) |
| B*39:06 maternal P, conditional | Table S8 | 1.67E-02 | 1.66 × 10⁻², above 0.001 |
| B*39:06 2-df joint test (maternal and fetal both zero) | Table S6; Supplementary Note | 7.65E-04 (Table S6); 7.56 × 10⁻⁴ (Note) | below 0.001, but a test of any effect, not of the fetal effect |
Two independent routes, from the printed CI and from the supplement's estimate and SE, both give a fetal P of about 0.0038, matching the printed Pf = 3.84 × 10⁻³. Only the label "P <0.001" in the abstract and the Results disagrees with it. A one-sided test would not close the gap. The maternal P for B*39:06 (7.10 × 10⁻⁴) is below 0.001, so the abstract's list of maternal effects is correct. Because Table S7 contains every allele with a nominal maternal or fetal effect, no allele omitted from it could have a fetal P below 0.001.
Figure
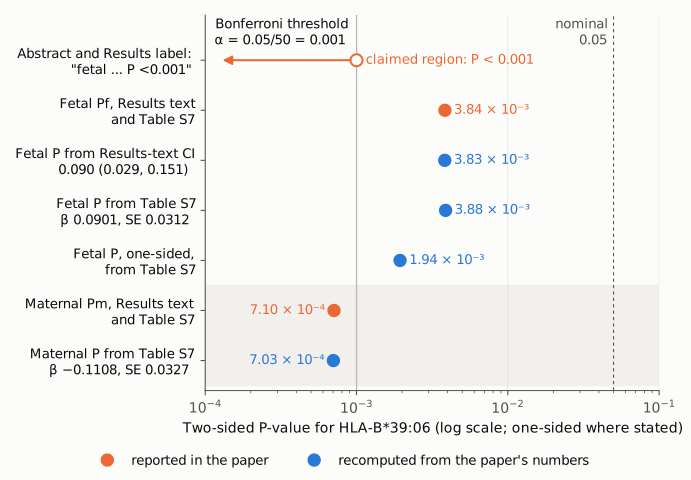
Figure 1. P-values for HLA-B*39:06 on a log scale; the solid vertical line is the paper's Bonferroni threshold, α = 0.05/50 = 0.001, and the dashed line is the nominal 0.05. Values left of the solid line pass the threshold. The top row (orange arrow) is the abstract and Results label "P < 0.001" for the fetal effect. The next row (orange) is the fetal P printed in the Results and in Table S7, 3.84 × 10⁻³. Blue rows are recomputed from the paper's own numbers: from the printed 95% CI (3.83 × 10⁻³), from the Table S7 estimate and SE (3.88 × 10⁻³), and as a one-sided test (1.94 × 10⁻³). All fetal values lie right of the threshold. The two shaded rows show, for comparison, the maternal P (reported 7.10 × 10⁻⁴, recomputed 7.03 × 10⁻⁴), which does pass it. All values are from the unconditional analysis. The log scale is used because P-values span orders of magnitude; the gap between 0.001 and 0.0038 is a factor of 3.8.
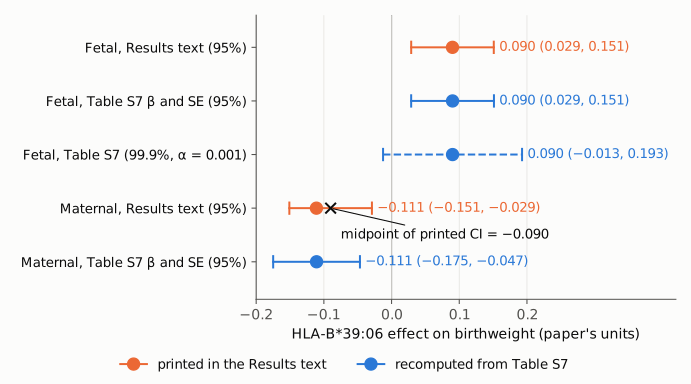
Figure 2. Estimates for HLA-B*39:06 with confidence intervals, on the effect scale used in the paper; zero is the reference line. Orange: as printed in the Results. Blue: computed from the Table S7 estimates and SEs. The printed fetal 95% CI matches the recomputed one exactly. The dashed blue interval is the fetal 99.9% CI, the interval that corresponds to a two-sided test at α = 0.001; it runs from −0.013 to 0.193 and includes zero, which shows the same failure to reach the threshold on the effect scale. The printed maternal interval (−0.151, −0.029) is centred on −0.090 (black cross), not on its estimate of −0.111; the interval implied by Table S7 is (−0.175, −0.047).
Why it matters
- An abstract-level finding is overstated. The abstract reports "strong evidence" for exactly one fetal allelic effect of a non-HLA-C allele, B*39:06 at P < 0.001. Under the paper's own multiple-testing criterion that effect does not qualify (Bonferroni-adjusted P = 0.19), and no other allele in Table S7 qualifies either. On the paper's own numbers, no non-HLA-C fetal effect reaches the stated threshold.
- The Results count changes in the same way. The Results report three Bonferroni-significant maternal effects and one fetal effect. On the tabulated values the count is three and none.
- The Discussion builds on it. The type 1 diabetes interpretation rests on "a positive fetal and a negative maternal effect of this allele on BW". The fetal estimate is still positive and nominally significant (its 95% CI excludes zero), so the reasoning is not voided, but its fetal half rests on weaker evidence than the abstract states.
- The rest of the paper is not affected. The SEM, the simulation and power results, the maternal associations at A03:01, B35:01 and B*39:06, and the replication at HLA-C do not depend on this label. The fetal point estimate and its direction are unchanged.
- The interval slip could mislead readers who reuse the CI. The maternal 95% CI printed for B*39:06 is shifted toward zero: its bounds are −0.151 and −0.029 instead of −0.175 and −0.047.
Explanations considered
- The printed Pf is a typo for a smaller value. Not supported. The supplement gives the same Pf (3.84E-03) in Tables S7 and S8, and both the printed CI and the Table S7 estimate and SE independently give P ≈ 0.0038.
- A one-sided test. Does not account for it. The one-sided fetal P is 1.94 × 10⁻³, still above 0.001, and the paper's other P-values reproduce as two-sided.
- The label refers to the conditional analysis. Table S8 also reports a model adjusted for rs9366778 and rs6911024, in which the B39:06 fetal P is 6.04 × 10⁻⁴, below 0.001. But the Results sentence that makes the claim, and the numbers quoted two sentences later, are the unconditional ones, and the text does not say that the fetal label comes from the conditional model. In that model the B39:06 maternal P is 1.67 × 10⁻², so it would not support the paired maternal claim in the same sentence. Neither model supports both labels at once.
- The label refers to the 2-df joint test. B*39:06 has P2df = 7.65 × 10⁻⁴ (Table S6; 7.56 × 10⁻⁴ in the Supplementary Note), below 0.001. That test asks whether the maternal and fetal effects are both zero, so it cannot attribute an effect to the fetal component. The abstract and the Results attach P < 0.001 to the fetal component specifically, and the Methods describe the 1-df tests as the ones that "evaluated the significance of the maternal and fetal components individually".
- The Figure 4 label shows that the fetal effect passes. No. The legend says "Alleles with P < 0.001 are explicitly labelled". Only three alleles are labelled in Figure 4 (A03:01, B35:01, B39:06), exactly the three maternal hits; A03:01 is a labelled triangle although its fetal P is 6.92 × 10⁻³, and DRB111:04, the allele with the smallest fetal P (1.34 × 10⁻³), is not labelled. A label therefore marks an allele with at least one test below 0.001, which for B39:06 is the maternal test; the triangle marks only that both tests are below 0.05.
- A different threshold applies. No. The only threshold the paper gives for these claims is α = 0.05/50 = 0.001, and the abstract's "P <0.001" matches it.
- A text-conversion artifact. Ruled out. The publisher's page, the Europe PMC full-text XML (with true superscript exponents) and the PubMed abstract carry the same wording and values.
- The maternal CI comes from another column. No reading of the tables reproduces the printed (−0.151, −0.029). It is exactly the fetal interval with its signs reversed, is centred on −0.090 rather than −0.111, and implies an SE (0.0311) that is the fetal SE rather than the maternal SE (0.0327). The reported Pm agrees with Table S7, so this slip is confined to the interval.
Status
- Version of record. The publisher's page (academic.oup.com, reached through doi.org) has the same abstract sentence and the same Results values, as do the Europe PMC full-text XML and the PubMed abstract (PMID 37831898). Crossref gives online publication on 13 October 2023, volume 53, issue 1. Every quotation above was checked verbatim against the PMC-archived text with
src/show.py. - Supplements. I read the single supplementary file,
dyad142_supplementary_data.docx(Supplementary Notes, Figures S1–S8, Tables S1–S10), downloaded from Europe PMC. Tables S7 and S8 (unconditional) give B*3906 fetal 0.0901, SE 0.0312, P 3.84E-03 and maternal −0.1108, SE 0.0327, P 7.10E-04. Table S8 (conditional), Table S6 (2-df) and the Supplementary Note give the values cited under Explanations. The supplement does not resolve the discrepancy. - Corrections and comments. As of 2026-10-24 I found no correction, erratum, expression of concern or retraction.
src/known.pyreturns no Crossref update relations, no PMC notices and no Europe PMC notices; the Crossref record has empty update-to and updated-by fields, and a Crossref bibliographic search for a correction with this title returned only the article and its bioRxiv preprint (doi:10.1101/2022.08.23.505053). PubPeer's search API refused automated access (human verification required), and a web search for the title together with "PubPeer" found no PubPeer thread, so the absence of PubPeer comments is not fully confirmed. - Sources. PMC article PMC10859143; Europe PMC full-text XML and supplementary files; https://doi.org/10.1093/ije/dyad142 (publisher page); PubMed 37831898; Crossref; PubPeer (search attempted).
Suggested correction
In the abstract, replace
revealed strong evidence for maternal (HLA-A03:01, B35:01, B39:06, P <0.001) and fetal allelic effects (HLA-B39:06, P <0.001) of non-HLA-C alleles on BW.
with wording such as
revealed strong evidence for maternal allelic effects (HLA-A03:01, B35:01, B39:06, P <0.001) and suggestive evidence for a fetal allelic effect (HLA-B39:06, P = 3.8 × 10⁻³) of non-HLA-C alleles on BW.
In the Results, replace "and the HLA- B39:06 allele exhibited a significant fetal effect at P <0.001 (labelled in Figure 4)" with a statement that no fetal effect reached the Bonferroni threshold and that the B39:06 fetal effect was nominally significant (Pf = 3.84 × 10⁻³). If the authors wish, they can add that it falls below 0.001 in the analysis conditioned on rs9366778 and rs6911024 (Pf = 6.04 × 10⁻⁴, Table S8), identified as such. In the same paragraph, change the maternal interval for B*39:06 from "(-0.151, -0.029)" to "(-0.175, -0.047)", the interval implied by Table S7 (−0.1108, SE 0.0327), or to whatever interval the authors' fitted model gives.