← Back to the plain-language case
Reported positive predictive value of 55% conflicts with the paper's own sensitivity, specificity and prevalence
Sci Adv (2023) · doi:10.1126/sciadv.adg7545 · PMC10732528
Summary
The paper reports that its serial panel of three bivariate miRNA ratios separates preeclampsia (PE) cases from controls with sensitivity 93%, specificity 79%, positive predictive value (PPV) 55% and negative predictive value (NPV) 89%. It states these figures in the Abstract, the Results and the Discussion, and the Results and Discussion add "given a 57.7% prevalence of PE in our study" (71 of 123 samples). At that prevalence, a sensitivity of 93% and a specificity of 79% give a PPV of 85.8%. The per-sample classifications in the paper's data file S5 give 66 true positives and 11 false positives, so PPV = 66/77 = 85.7%. The reported NPV and both likelihood ratios agree with the same inputs; only the PPV does not. The error understates the panel's performance in a headline figure, and it affects the paper's comparison with the sFlt1:PlGF ratio, whose main limitation the paper gives as a low PPV.
What the paper reports
Abstract:
Applying an iterative machine learning method identified three bivariate miRNA biomarkers (miR-522-3p/miR-4732-5p, miR-516a-5p/miR-144-3p, and miR-27b-3p/let-7b-5p) that, when applied serially, distinguished between PE cases of different severity and differentiated cases from controls with a sensitivity of 93%, specificity of 79%, positive predictive value (PPV) of 55%, and negative predictive value (NPV) of 89%.
Results, "Identification of a small panel of candidate bivariate biomarkers":
We then re-ran the algorithm an additional two times, correctly identifying all but five PE cases, three of which were diagnosed as superimposed PE and one mild PE (Fig. 7A).
This iterative panel of three bivariate biomarkers achieved a PPV of 55% at a sensitivity of 93%, specificity of 79%, a positive likelihood ratio (+LR) of 4.43, and a negative likelihood ratio (-LR) of 0.09, given a 57.7% prevalence of PE in our study.
Discussion:
Overall, this iterative process was able to identify over 90% of cases with a false-positive rate of less than 10% at each iteration and achieved a PPV of 55% at a sensitivity of 93% and specificity of 79% (+LR = 4.43, -LR = 0.09) given a prevalence of PE of 57.7% in our study.
Results, "Characteristics of the study population" (the cohort the panel was applied to):
Cases were defined as pregnancies with an adjudicated PE diagnosis (n = 71), and controls (n = 52) were from participants with either hypertension that did not meet the criteria for PE or normal (nonhypertensive) pregnancy outcomes. The pass-filter 71 cases and 52 controls were subjected to further analysis.
Materials and Methods, "Candidate bivariate marker selection" (the definition used):
PPV was calculated as PPV = True Positives/(True Positives + False Positives), and NPV was calculated as NPV = True Negatives/(True Negatives + False Negatives).
Introduction (the comparison the PPV feeds into):
The primary limitation of the sFlt1:PlGF ratio is its relatively low positive predictive value (PPV), which numerous studies have reported to be between 30 and 65% (9–12).
What the paper's own numbers show
Method. I recomputed the PPV in two independent ways. (1) From the paper's rounded rates, using Bayes' rule, PPV = Se·p / (Se·p + (1 − Sp)(1 − p)), with Se = 0.93, Sp = 0.79 and p = 0.577. The same formula is stated in the medRxiv preprint of this paper. (2) From counts. Data file S5 ("Refers to Figure 7") lists all 123 samples with the iteration (1, 2 or 3) at which each one was flagged as PE, or "Not Removed". Flagged cases are true positives, unflagged cases false negatives, flagged controls false positives and unflagged controls true negatives. I applied the Methods definitions to those counts. I also computed what a PPV of 55% would require, both in prevalence and in false positives. Every number below is printed by recompute.py.txt.
| Quantity | Location | Reported | Recomputed from the paper's numbers |
|---|---|---|---|
| Prevalence | Results; Discussion | 57.7% | 71/123 = 57.72% |
| Classification counts | Data file S5 | cases flagged at iterations 1/2/3: 40/15/11, not flagged 5; controls flagged 3/4/4, not flagged 41 | TP = 66, FN = 5, FP = 11, TN = 41 |
| Sensitivity | Abstract; Results; Discussion | 93% | 66/71 = 92.96% |
| Specificity | Abstract; Results; Discussion | 79% | 41/52 = 78.85% |
| PPV | Abstract; Results; Discussion | 55% | 85.8% from the rounded rates; 66/77 = 85.71% from the counts |
| NPV | Abstract | 89% | 89.2% from the rounded rates; 41/46 = 89.13% from the counts |
| +LR | Results; Discussion | 4.43 | 0.93/0.21 = 4.43; 4.39 from the counts |
| −LR | Results; Discussion | 0.09 | 0.07/0.79 = 0.089; 0.089 from the counts |
| PPV if specificity were anywhere from 38/52 to 44/52 (TP fixed at 66) | derived | — | 82.5% to 89.2% |
| Prevalence at which Se 93% and Sp 79% give PPV 55% | derived | — | 21.6%; the NPV there would be 97.6%, not 89% |
| False positives needed for PPV 55% with 66 true positives | derived | — | 66/0.55 − 66 = 54, more than the 52 controls |
| PPV of the miRNA panel alone in the 70-patient sFlt1:PlGF subset (42 TP, 6 FP) | Results | not stated | 42/48 = 87.5% |
| Combined miRNA then sFlt1:PlGF (42 TP, 2 FP, 21 TN, 5 FN) | Abstract; Results | Se 89.4%, Sp 91.3%, PPV 95.5%, NPV 80.8% | 89.36%, 91.3%, 95.5%, 80.8% (consistent) |
| Preprint inputs (prevalence 57.8%, Sp 78.8%) | medRxiv preprint, Methods | PPV 55% | 85.7% with the preprint's own formula |
Every other metric of the panel agrees with its inputs to the printed precision. The PPV is the only one that does not, and it is about 31 percentage points below the value the paper's own numbers give.
Figure
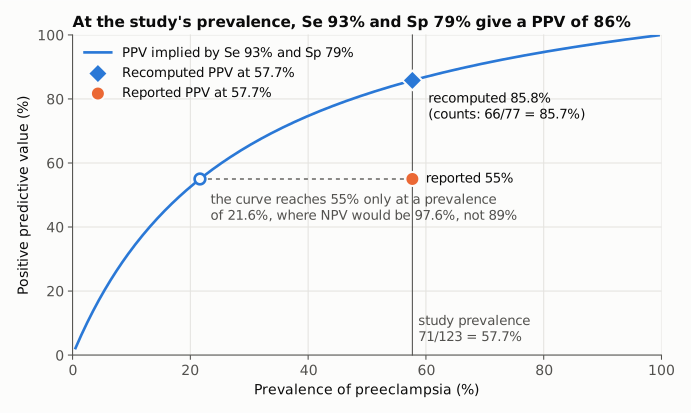
Figure 1. The blue curve is the PPV that a test with the paper's reported sensitivity (93%) and specificity (79%) has at each prevalence (Bayes' rule). The thin vertical line marks the study prevalence the paper states, 71/123 = 57.7%. At that prevalence the curve gives 85.8% (blue diamond), and the counts in data file S5 give 66/77 = 85.7%. The paper's reported 55% (orange circle) lies well below the curve. The curve reaches 55% only at a prevalence of 21.6% (open circle), and at that prevalence the NPV would be 97.6%, not the 89% the paper reports. All values come from the paper or from recompute.py.txt.
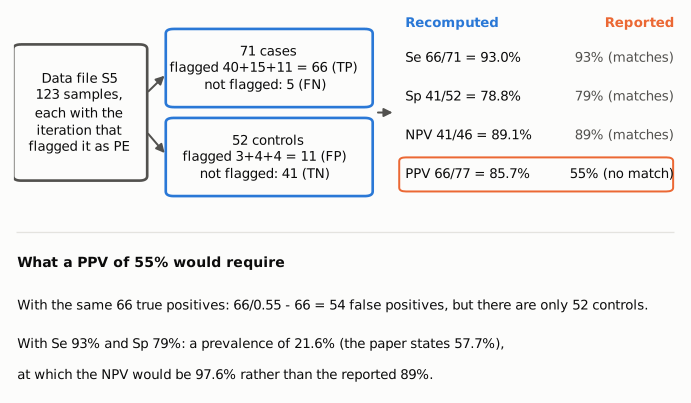
Figure 2. The count reconstruction from data file S5. Summing the cases and controls flagged at each of the three iterations gives TP 66, FN 5, FP 11 and TN 41. These counts reproduce the reported sensitivity, specificity and NPV, but give a PPV of 85.7% against the reported 55%. The lower panel shows that a 55% PPV would need 54 false positives, more than the 52 controls in the cohort.
Why it matters
- Headline figure. The PPV is one of four performance figures in the Abstract for the paper's main diagnostic result, and it is repeated in the Results and the Discussion. Readers who cite the panel's performance will cite 55%.
- Comparison with sFlt1:PlGF. The Introduction gives the sFlt1:PlGF ratio's "relatively low positive predictive value", 30 to 65%, as its main limitation. At 55% the miRNA panel appears no better on this measure. At about 86% it appears better, although PPVs from cohorts with different prevalence cannot be compared directly, and this cohort's prevalence (57.7%) is high for a triage population.
- Gain from combining assays. The paper reports that applying sFlt1:PlGF after the miRNA panel gives a PPV of 95.5%. Against a stated baseline of 55% this looks like a large gain. The actual baseline is about 86% in the full cohort and 87.5% in the 70-patient subset that has sFlt1:PlGF data, so the gain is about 8 to 10 percentage points.
- What is not affected. The reported sensitivity, specificity, NPV and likelihood ratios are consistent with the data. So are the combined-assay counts and metrics, the identities of the three biomarkers and the call for larger validation. The error makes the panel look worse than the paper's own data show, not better.
Explanations considered
- A different prevalence. A PPV is sometimes recalculated for an external, lower prevalence. This would explain 55% if the paper had used a prevalence of about 21.6%. But the paper explicitly attaches the 55% to "a 57.7% prevalence of PE in our study", which is 71/123, the full cohort the panel was applied to. At 21.6% the NPV would be 97.6%, not the reported 89%, so the reported NPV and PPV cannot both come from the same adjusted prevalence. This does not account for the numbers.
- A different definition of PPV. The Methods define PPV as TP/(TP + FP), the standard formula. I tried other ratios that could be mislabeled: TP/(TP + FP + FN) = 80.5%, accuracy = 87.0%, TN/(TN + FP + FN) = 71.9%, TP/N = 53.7%, 1 − PPV = 14.3% and the false-positive rate = 21.2%. None gives 55%. TP/N (53.7%) is the closest, but it rounds to 54% and is not a predictive value. This does not account for the numbers.
- Different integer counts. The sensitivity is pinned by the text ("all but five PE cases", so 66 of 71). Any specificity count from 38/52 to 44/52 gives a PPV between 82.5% and 89.2%. A PPV of 55% with 66 true positives would need 54 false positives, more than the 52 controls. Data file S5 gives the exact counts (FP = 11). This does not account for the numbers.
- A subset or a different stage of the iteration. In the 70-patient subset with sFlt1:PlGF data, the miRNA panel alone has 42 true and 6 false positives (PPV 87.5%). The three iterations in data file S5, taken one at a time, give PPVs of 40/43 = 93.0%, 15/19 = 78.9% and 11/15 = 73.3%. None of these is near 55%. This does not account for the numbers.
- A conversion or typesetting artifact. The 55% appears in running text in three places, in the PMC archive, the Europe PMC full-text XML and the medRxiv preprint. It is not in a table, so a misaligned column is ruled out, and it is not a lost minus sign or decimal. The preprint states the Bayes formula and its inputs (prevalence 57.8%, specificity 78.8%). Those inputs give 85.7% with that formula, so the 55% was already present in the preprint and was carried into the published version unchanged. This does not account for the numbers.
None of these explanations reconciles 55% with the paper's other figures. I have not found what calculation produced it.
A related observation (not part of the main claim). For the 18-patient independent validation cohort (11 cases, 7 controls), the Results report "a PPV of 85% at a sensitivity of 91% and specificity of 57%". A sensitivity of 91% with 11 cases is 10/11, which agrees with the Discussion's "we found all but one PE case". A specificity of 57% with 7 controls is 4/7, which leaves 3 false positives. That gives PPV = 10/13 = 76.9%. A PPV of 85% (11/13 = 84.6%) would require all 11 cases to be detected. Data file S6 gives only the cohort's demographics, not per-sample calls, so I could not check this from counts.
Status
As of 2026-10-23:
- Version of record. science.org returned HTTP 403 to automated requests, so I checked the publisher-deposited text instead. The PMC article page, the Europe PMC full-text XML and the local PMC archive all contain the three sentences quoted above word for word.
- Supplements. I checked the supplementary PDF (Figs. S1 to S3) and data files S1 to S11 (Excel). Data file S5 gives the per-sample classifications used above. It does not mention a PPV.
- Preprint. The medRxiv preprint (doi:10.1101/2023.01.26.23285072, posted 2023-01-29) also reports a PPV of 55% at sensitivity 93% and prevalence 57.7%. Its Methods give the Bayes formula, which yields about 86% with its stated inputs.
- Corrections and retractions. Crossref update metadata, PMC notices and Europe PMC notices list no correction, expression of concern or retraction.
- PubPeer. PubPeer's publication lookup for the DOI returned no comments. Its web search page refused automated access (HTTP 403). A general web search found no discussion of this error.
Sources: article (DOI); PMC10732528; medRxiv preprint; supplementary files via the Europe PMC supplementaryFiles service.
Suggested correction
In the Abstract, the Results ("Identification of a small panel of candidate bivariate biomarkers") and the Discussion, the PPV of the three-bivariate panel in the 123-sample cohort should read 86% (66/77 = 85.7% from data file S5; 85.8% from the rounded sensitivity, specificity and prevalence) instead of 55%. Sensitivity, specificity, NPV, +LR and −LR need no change. If the 55% was meant to describe a different population or prevalence, the text should say which one, and the NPV should then be recomputed for it. The authors may also wish to check the validation-cohort PPV of 85% in the Results. With the stated sensitivity (10/11) and specificity (4/7) it computes to 10/13 = 77%.