← Back to the plain-language case
Maternal 2-AG/1-AG rise: printed p = 0.005, yet its own t and CI imply p ≈ 0.07
Psychol Med (2023) · doi:10.1017/S0033291723001204 · PMC10719681
Summary
Table 3 and the Results text report that hair 2-AG/1-AG levels in mothers "significantly increased" from late pregnancy to one year postpartum, with t = 1.83 and p = 0.005. The same Table 3 row gives b = 10.52 and a 95% CI of −0.77 to 21.81. These three numbers agree with each other: the CI implies a standard error of 5.76 and z = 1.83. They imply a two-sided p of 0.067 to 0.068, and the interval includes zero. Under the paper's stated method (p values from z, two-tailed, α = 0.05), the Time effect is therefore not significant. This increase is the first finding in the abstract's Results and the basis of an argument in the Discussion. Other columns of Table 3 also do not fit together, so the table as printed cannot show which number is wrong. But the significance claim rests only on the p value of 0.005.
What the paper reports
Table 3, "Results of robust linear mixed effects models for endocannabinoid concentrations in mothers (Nt0 = 150; N t2 = 148)", 2-AG/1-AG block, Time row (columns: Predictor | b | 95% CI (b) | β | η2p (95% CI) | t | p):
Time | 10.52 | -0.77–21.81 | 0.26 | 0.01 (0.00–0.05) | 1.83 | 0.005**
Table 3 footer:
Note. * p < 0.050, ** p < 0.010, *** p < 0.001, two-tailed.
Results, "Alterations in eCB and NAE levels within the first year postpartum", Mothers paragraph:
2-AG/1-AG levels significantly increased in maternal hair over the first year postpartum (tTime = 1.83, p = 0.005, η2p = 0.01; Table 3), which did not depend on maternal CM load (tInteraction = -0.92, p = 0.357, η2p < 0.01).
Materials and methods, Statistical analyses:
P values of model predictors and post hoc tests were calculated based on z values.
All reported analyses were performed two-tailed with the significance level set at p < 0.05.
Abstract, Results:
Maternal hair levels of 2-AG/1-AG increased and SEA levels decreased from late pregnancy to one year postpartum.
Discussion, "eCB and NAE levels in maternal hair at the perinatal and postpartum", first and second paragraphs:
Independent of maternal CM, 2-AG/1-AG concentrations in maternal hair were lower in late pregnancy than one year postpartum, while SEA concentrations decreased from late pregnancy to one year postpartum.
Our study indicates lowered 2-AG/1-AG levels during late pregnancy which may contribute to reduced negative feedback in the HPA axis, and thus to an increase in tonic cortisol levels in the last pregnancy trimester. Increasing 2-AG/1-AG hair levels from pregnancy to one year postpartum might reflect the restoration of a tighter 2-AG-mediated HPA-axis regulation that returns glucocorticoid secretion back to pre-pregnancy levels.
Discussion, "Influence of maternal CM exposure on eCB and NAE levels", first paragraph:
While all women showed decreasing SEA and increasing 2-AG/1-AG levels from late pregnancy to one year later, women with a history of CM exhibited significantly lower SEA levels in late pregnancy as compared with women without CM.
What the paper's own numbers show
Method. The models are robust linear mixed models (robustlmm). The Methods state that p values were computed from z values, and the table footer says two-tailed. For a Wald-type 95% CI, SE = (upper − lower) / (2 × 1.96) and z = b / SE. I computed z from the printed b and CI, then computed the two-sided normal p from that z and from the printed t. As a check that does not depend on the normal reference, I also used a t distribution with 294 df (298 observations minus 4 fixed effects). For the effect size I used η²p = t² / (t² + df) with the same df. The paper does not state its η²p formula or df, but with df = 294 this formula reproduces the printed η²p of the intercept row (0.050 vs 0.05). I applied the same checks to every row of Table 3 and to the matching row of Supplementary Table S10, which repeats the model for the 63 mothers with data at both time points. recompute.py.txt prints every number below.
| Quantity | Location | Reported | Recomputed from the paper's own numbers |
|---|---|---|---|
| Midpoint of the 95% CI | Table 3, 2-AG/1-AG Time | b = 10.52 | (−0.77 + 21.81) / 2 = 10.520 |
| SE implied by the CI | Table 3 | not printed | 22.58 / 3.92 = 5.760 |
| Test statistic | Table 3; Results | t = 1.83 | z = 10.52 / 5.760 = 1.83 (1.826) |
| Two-sided p | Table 3; Results | 0.005** | 0.067 from t = 1.83 as z (Methods); 0.068 from b and CI; 0.068 with t(294) |
| p for any t that rounds to 1.83 (1.825 to 1.835) | — | — | 0.0665 to 0.0680 |
| One-sided p | footer says two-tailed | — | 0.034 |
| |z| needed for two-sided p = 0.005 | — | — | 2.81, which is 1.53 times the printed t |
| 95% CI that p = 0.005 would need around b = 10.52 | — | −0.77 to 21.81 | 3.17 to 17.87 (SE 3.75) |
| Does the 95% CI include 0? | Table 3 | −0.77 to 21.81 | yes, so p > 0.05 |
| η²p | Table 3; Results | 0.01 | 0.011 from t = 1.83 (df 294); |t| = 2.81 would give 0.026 |
| Same effect, complete cases (N = 63) | Suppl. Table S10 | b = 11.50, CI −5.87 to 28.88, t = 1.30, p = .004** | SE 8.865, z = 1.30, p = 0.19 (0.195 from CI); η²p 0.014 (df 122), consistent with the printed 0.01 |
| 2-AG/1-AG Intercept, CM, Time × CM (same block) | Table 3 | t 3.94, 1.58, −0.92; p < 0.001, 0.113, 0.357 | p from t: 0.0001, 0.114, 0.358 (consistent) |
The b, CI, t and η²p of the Time row all agree with one another, and the p value does not agree with any of them. The other three rows of the 2-AG/1-AG block give p values consistent with their t. A two-sided p of 0.005 would need a statistic about 1.5 times larger, or a CI about two-thirds as wide that excludes zero. Supplementary Table S10 shows the same pattern for the subsample: t = 1.30 is printed next to p = .004, while the t implies p = 0.19.
The rest of Table 3. The same table has further defects, listed here because they bear on which cell is wrong (see Explanations considered):
| Rows | What is printed | What the printed b and CI imply |
|---|---|---|
| SEA: Intercept, Time, CM, Time × CM | t = 5.18, 0.14, −0.47, −0.77 (the same four values as the OEA block) | z = 9.98, −3.81, −3.46, 1.52 |
| PEA: Intercept, Time, CM, Time × CM | t = 9.98, −3.81, −3.46, 1.50 (nearly the SEA rows' CI-implied z) | z = 5.84, 0.09, −0.96, −0.51 |
| SEA and PEA η²p | 0.25, 0.05, 0.04, 0.00 and 0.10, 0.00, 0.00, 0.00 | 0.253, 0.047, 0.039, 0.008 and 0.104, 0.000, 0.003, 0.001 from the CI-implied z (consistent) |
| p of OEA, SEA and PEA Intercept | 0.008, 0.054, 0.002 | all below 10-6 |
| p of OEA and PEA Time | 0.080, 0.250 | 0.89, 0.93 |
| p of SEA Time × CM ("marginally significant" in Results) | 0.054 | 0.13 |
| p of SEA Time and SEA CM | < 0.001, 0.001 | 0.0001, 0.0005 (consistent) |
So in Table 3 the b, CI and η²p columns agree with one another, the t column is misplaced in the SEA and PEA blocks, and seven of the sixteen p values do not match the b and CI printed in their own rows. For the 2-AG/1-AG Time row, the t value agrees with the b, the CI and η²p, so the error lies in the p value.
Figure
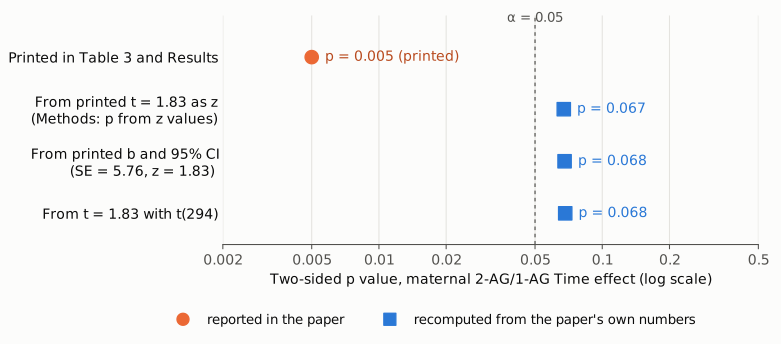
Figure 1. Two-sided p values for the maternal 2-AG/1-AG Time effect on a log scale. The orange circle is the p printed in Table 3 and the Results (0.005). The blue squares are recomputed from the same row: from the printed t = 1.83 used as z, as the Methods specify (0.067); from the printed b and 95% CI, SE = 5.76 (0.068); and from t = 1.83 with a t(294) reference (0.068). The dashed line is the paper's significance level, α = 0.05. All three recomputations agree, and all fall on the non-significant side of the line. The printed value is 13 times smaller. A log scale is used because p values span orders of magnitude.
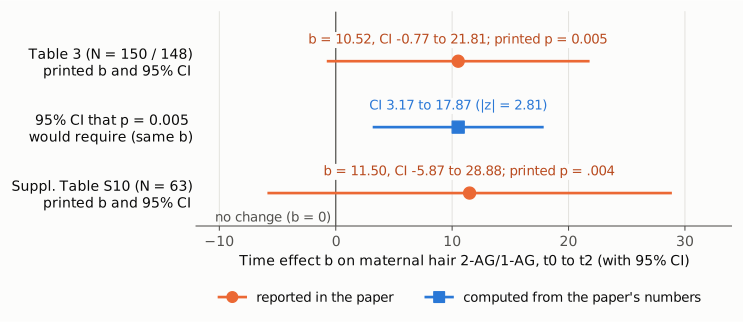
Figure 2. The maternal 2-AG/1-AG Time coefficient b with its 95% CI, on a linear axis with the null value b = 0 as a vertical line. Orange: the values printed in Table 3 (b = 10.52, −0.77 to 21.81) and in Supplementary Table S10 for the 63 complete cases (b = 11.50, −5.87 to 28.88). Each is printed with a p below 0.01, yet each interval crosses zero. Blue: for comparison, the 95% CI that the same b = 10.52 would need for a two-sided p of 0.005 (3.17 to 17.87, |z| = 2.81). The interval printed in the paper is about 1.5 times that width.
Why it matters
- A result in the abstract is not supported by its own statistics. "Maternal hair levels of 2-AG/1-AG increased" is the first sentence of the abstract's Results. The coefficient, interval and test statistic behind it give p ≈ 0.07 under the paper's own α = 0.05 and two-tailed z test. The estimate is positive, but the paper does not show that the increase is statistically significant. The complete-case analysis that the footer cites as support ("Considering only these cases did not change the pattern of results") gives p ≈ 0.19 from its own t.
- A Discussion argument is built on it. The Discussion treats lower late-pregnancy 2-AG/1-AG as an established result. It proposes that this "may contribute to reduced negative feedback in the HPA axis" and that the rise to one year postpartum "might reflect the restoration of a tighter 2-AG-mediated HPA-axis regulation". The second Discussion section states that "all women showed ... increasing 2-AG/1-AG levels".
- The broader conclusion stands. The Conclusion says that "Mothers and children showed alterations in the eCB system from the last trimester of pregnancy to one year postpartum". It does not depend on this row. The maternal SEA decrease is consistent with its own CI (b = −926.03, −1402.21 to −449.84, z = −3.81, p = 0.0001). The infant 2-AG/1-AG Time effect in Table 4 stays significant on recomputation (z = −3.02, p = 0.0025, printed < 0.001).
- Table 3 cannot be relied on as printed. Seven of the sixteen p values and nine of the t values (the eight in the SEA and PEA blocks, plus 2-AG/1-AG Time × CM) do not match the b and CI in their rows. One example is the SEA Time × CM interaction, which the Results call "marginally significant" (p = 0.054). From its CI it has p = 0.13, which falls outside the paper's own trend band (p < .100).
Explanations considered
- The p value refers to a different test, such as a post hoc contrast or a likelihood-ratio test. Not supported. The Results cite "tTime = 1.83, p = 0.005" as one test of the Time predictor. The Methods say predictor p values were computed from z. Post hoc tests are listed separately in Table 3 and were run only for significant interactions, and the 2-AG/1-AG block has none.
- A t distribution with few degrees of freedom. Cannot explain it. Any t reference gives a larger p than the normal reference, not a smaller one: 0.068 with 294 df. No choice of df turns t = 1.83 into p = 0.005.
- One-sided testing. Cannot explain it. The footer and Methods say two-tailed, and a one-sided p would be 0.034, not 0.005.
- The t value or the CI is the wrong cell and p = 0.005 is correct. Not supported for this row. Three independent columns agree with t = 1.83: the CI-derived z (1.826), the CI midpoint (equal to b), and η²p (0.011 from t = 1.83, against 0.026 if |t| were 2.81). Elsewhere in Table 3, the t column is misplaced only in the SEA and PEA blocks. In the 2-AG/1-AG block, t matches the CI for the Intercept, Time and CM rows.
- Robust or non-Wald confidence intervals. Not able to explain it. A CI that is not a symmetric Wald interval could make the SE estimate inexact, but this interval is centred exactly on b. When the CI and the p value come from the same Wald z test, as the Methods describe, a 95% CI that includes zero cannot go with p < 0.05.
- A conversion or typesetting artifact. Ruled out. The publisher's PDF (Cambridge Core), the Cambridge HTML Results text, the Europe PMC JATS XML and the PMC HTML all carry the same values in the same columns. The Results sentence repeats the table's t and p. The supplement shows the same pattern (Table S10, t = 1.30 with p = .004).
- A simple typo in the p value, for example 0.065 written as 0.005. Possible, but the table cannot confirm it, and a typo would not rescue the claim. Any p consistent with the row is about 0.067 and is not significant. Whatever the cause, the significance statement in the text and abstract does not follow from the printed b, CI and t.
Side observations (not part of the main finding). In the 2-AG/1-AG Time × CM row, the CI (−0.45 to 0.16) is centred at −0.145, not at b = −0.09, and it implies z = −0.58 rather than the printed t = −0.92. Neither value approaches significance. For the children, the abstract says "In the children's hair, levels of 2-AG/1-AG increased while levels of SEA, OEA, and PEA decreased from late pregnancy to one year later". The Results say "Infants exhibited an inversed pattern of change as compared to their mothers", with 2-AG/1-AG decreasing and OEA, PEA and SEA increasing. Table 4 matches the Results: b = −47.02 for 2-AG/1-AG and +511.49 and +417.36 for OEA and PEA. The abstract therefore states the opposite direction from the Results and Table 4. The Results also call the infant SEA increase significant, but Table 4 gives SEA Time p = 0.058, and its CI (−189.20 to 257.33) implies p = 0.76.
Status
- Version of record. I checked the publisher's PDF from Cambridge Core, reached through the doi.org redirect. Its Results sentence and its Table 3 2-AG/1-AG Time row ("Time 10.52 −0.77–21.81 0.26 0.01 (0.00–0.05) 1.83 0.005**") match the PMC text quoted above. So do the Cambridge HTML Results text, the Europe PMC full-text XML (table-wrap 3) and the PMC HTML page. The misplaced SEA/PEA t values and the other p mismatches are also the same in every copy. Every quotation above was checked verbatim against the PMC-archived text with
src/show.py. - Supplements. There is one supplementary file,
S0033291723001204sup001.pdf, from static.cambridge.org (md5 609e36b272137d97bf8ac33543d29a77, identical to the file referenced in the PMC record). I read Supplementary Table S10, the complete-case model for N = 63 mothers. Its 2-AG/1-AG Time row is quoted above and shows the same kind of inconsistency. S10 also prints the same t and η²p columns (t = 2.94, 1.30, 0.41, −0.26) in the 2-AG/1-AG, OEA and PEA blocks. The supplement holds no raw data or model output that could recover the correct p. - Corrections and comments. As of 2026-10-24 I found no correction, erratum, retraction or expression of concern.
src/known.pyreturns no Crossref updates, no PMC notices and no Europe PMC notices. The Crossref record has no update-to or updated-by relations. The Cambridge Core article metadata lists no corrections, retractions or addenda. The PMC page carries no erratum notice. The Europe PMC REST search returned "Search service is temporarily unavailable" on repeated attempts. The PubPeer API returned no record (HTTP 404) for the DOI, the PubPeer search page could not be queried automatically, and a web search for the title together with "correction", "erratum" or "PubPeer" found no notice or thread. - Sources. PMC article PMC10719681; Europe PMC full-text XML for PMC10719681; the Cambridge Core article page and PDF at https://doi.org/10.1017/S0033291723001204; supplementary file S0033291723001204sup001.pdf; Crossref; PubPeer; web search.
Suggested correction
The correct p value can only come from the authors' model output. Based on the printed b, CI and t, the 2-AG/1-AG Time row of Table 3 would read
Time | 10.52 | -0.77–21.81 | 0.26 | 0.01 (0.00–0.05) | 1.83 | 0.067
and the Results sentence would become, for example,
2-AG/1-AG levels in maternal hair did not change significantly over the first year postpartum (tTime = 1.83, p = 0.067, η2p = 0.01; Table 3)
with matching changes to the abstract ("Maternal hair levels of SEA decreased from late pregnancy to one year postpartum") and to the two Discussion passages that treat the 2-AG/1-AG increase as established. Supplementary Table S10 (Time, p = .004 alongside t = 1.30) needs the same check.
If the authors' output instead shows that p = 0.005 is correct, then b, the CI, t and η²p in this row are all wrong and should be replaced together. In either case, the authors may wish to re-issue Table 3 from the model output. The t column of the SEA and PEA blocks and seven p values (OEA, SEA and PEA Intercept; 2-AG/1-AG, OEA and PEA Time; SEA Time × CM) do not match the b and CI in their rows. The "marginally significant" SEA Time × CM interaction in the Results should be rechecked as well. Separately, the abstract sentence on the direction of change in children's hair should be reconciled with the Results and Table 4.