← Back to the plain-language case
Abstract's verified-vaccination percentages and effect do not match its own counts or the Results
Nat Med (2023) · doi:10.1038/s41591-023-02670-4 · PMC10719106
Summary
The abstract of this cluster-randomized trial in rural Ghana reports that 36.6% (355 of 1,058) of verified participants in the cash-incentive arms had at least one COVID-19 vaccine dose, compared with 30.3% (439 of 1,544) in the placebo arm, a difference of 6.3% (95% CI 2.4, 10.2; P = 0.001). The counts printed in that sentence give 33.6% and 28.4%. Those are the rates the Results text and Table 2 report for the same verified sample, where the difference is 5.2% (95% CI 1.5, 8.7; P = 0.005). The abstract's 36.6%, 6.3% and 2.4–10.2 match, figure for figure, a spillover estimate that the Results give for a different subgroup. Verified vaccination is the trial's only registry-confirmed outcome, so the abstract overstates the size and precision of its headline objective result, though the effect's direction and statistical significance are unchanged.
What the paper reports
Abstract:
We also verified vaccination status of participants: in the cash treatment arm, 36.6% (355 of 1,058) of verified participants had at least one dose of the COVID-19 vaccine compared to 30.3% (439 of 1,544) for those in the placebo—a difference of 6.3% (95% CI: 2.4, 10.2; P = 0.001).
Results, "Combined low and high cash treatment effect", third paragraph:
In the cash treatment arm (both low and high cash), we verified that 33.6% of individuals had at least one dose of the COVID-19 vaccine as of April 2023 compared to 28.4% of those in the placebo arm (difference from placebo: 5.2%; 95% CI: 1.5, 8.7; P = 0.005).
In relative terms, this represents about an 18% increase over the non-treated placebo vaccination rates.
Results, "Verified vaccination status":
For our six-district sample, we verified that 29.1% of the 3,075 participants received a COVID-19 vaccination
We verified that 28.4% of individuals in the placebo arm were vaccinated (at least one dose)
Table 2, phase IV panel ("Phase IV: verified vaccination status of treated participants (30 April 2022)"; columns: total sample | placebo | health message | low cash | high cash):
Number of participants | 3075 | 1544 | 473 | 548 | 510
Actual vaccination (%) | 29.1 (45.4) | 28.4 (45.1) | 21.6 (41.2) | 40.7 (49.2) | 25.9 (43.8)
Results, "Spillover", second paragraph, which describes Extended Data Table 5 (participants who saw the placebo video, grouped by the treatment assigned to their village):
Participants in placebo-treated village clusters had an average vaccination rate of 26.8%.
Individuals receiving the placebo video in low cash treatment villages had a verified vaccination rate of 38.3% (difference from placebo: 11.5%; 95% CI: 5.2, 17.8; P < 0.001).
Placebo participants in the combined cash treatment also had a verified vaccination rate, 36.6%, that is significantly larger than the placebo treatment village participants (difference from placebo: 6.3%; 95% CI: 2.4, 10.2; P = 0.002).
What the paper's own numbers show
Method. I divided the abstract's numerators by its denominators. I then rebuilt each arm's vaccinated count from the phase IV panel of Table 2 (n × printed %) and checked that the cash-arm count and size equal the abstract's 355 and 1,058. I computed the cash-minus-placebo difference with a naive two-proportion Wald 95% interval and normal-approximation P value. This interval ignores village clustering and serves only to check the printed arithmetic. Finally I set the abstract's figures beside the spillover paragraph's figures. Every number below is printed by recompute.py.txt.
| Quantity | Location | Reported | Recomputed from the paper's numbers |
|---|---|---|---|
| Cash-arm size | Abstract; Table 2 phase IV | 1,058; low cash 548, high cash 510 | 548 + 510 = 1,058, the same sample |
| Cash-arm vaccinated | Abstract; Table 2 phase IV | 355; 40.7% of 548, 25.9% of 510 | 223.0 + 132.1 → 223 + 132 = 355, the same count |
| Placebo size and vaccinated | Abstract; Table 2 phase IV | 439 of 1,544; 28.4% of 1,544 | 1,544 × 28.4% = 438.5 (438 or 439 after rounding), consistent |
| Total verified sample | Table 2 phase IV | 3,075; 29.1% | 895/3,075 = 29.1% from the rebuilt counts, consistent |
| Cash-arm rate | Abstract | 36.6% (355 of 1,058) | 355/1,058 = 33.55% → 33.6% |
| Cash-arm rate | Results, combined cash effect | 33.6% | 33.6%, agrees |
| Placebo rate | Abstract | 30.3% (439 of 1,544) | 439/1,544 = 28.43% → 28.4% |
| Placebo rate | Results; Table 2 | 28.4% | 28.4%, agrees |
| Counts the abstract's percentages would need | Abstract | 36.6% of 1,058; 30.3% of 1,544 | 387 (not 355); 468 (not 439) |
| Cash minus placebo | Abstract | 6.3% (95% CI 2.4, 10.2; P = 0.001) | 5.12 pp, naive 95% CI (1.5, 8.7), P = 0.0057 |
| Cash minus placebo | Results, combined cash effect | 5.2% (95% CI 1.5, 8.7; P = 0.005) | 5.12 pp (33.6 − 28.4 = 5.2 from the rounded rates); same interval |
| Relative increase | Results | "about 18%" | 5.12/28.43 = 18.0%; the abstract's figures imply 6.3/30.3 = 20.8% |
| Placebo-video participants in cash villages | Results, Spillover | 36.6%; difference 6.3 (95% CI 2.4, 10.2; P = 0.002) | Identical to the abstract's 36.6%, 6.3 and 2.4–10.2; the P values differ (0.002 vs 0.001) |
| Spillover reference rate | Results, Spillover | placebo villages 26.8% | 38.3 − 11.5 = 26.8 agrees for the low-cash line; 36.6 − 6.3 = 30.3, not 26.8 (36.6 − 26.8 = 9.8) |
The abstract's counts and denominators agree with every other part of the paper. Its percentages, difference, interval and P value do not agree with those counts. The abstract's placebo rate, 30.3%, is exactly 36.6 − 6.3, the spillover paragraph's rate minus its difference.
Figure
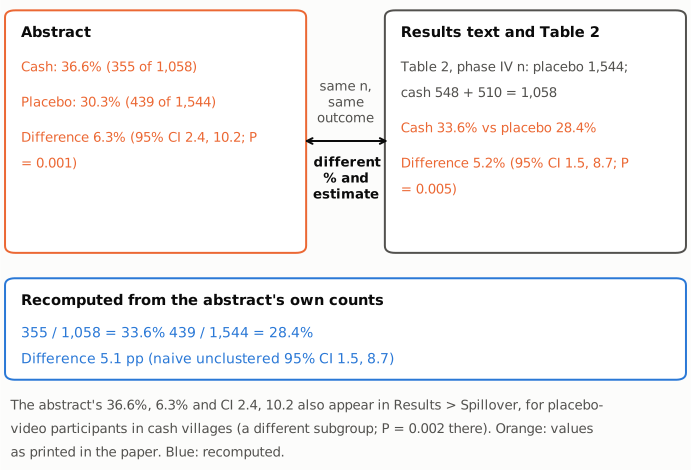
Figure 1. The left panel gives the abstract's verified-vaccination figures and the right panel the Results text and Table 2 (phase IV) figures, both as printed (orange). Both panels describe the same 1,058 cash-arm and 1,544 placebo participants. The blue strip shows the rates and difference recomputed from the abstract's own counts, 355/1,058 and 439/1,544. These agree with the Results and Table 2, not with the abstract. The note under the strip records where the abstract's 36.6%, 6.3% and 2.4–10.2 appear in the paper: in the spillover paragraph, for a different subgroup.
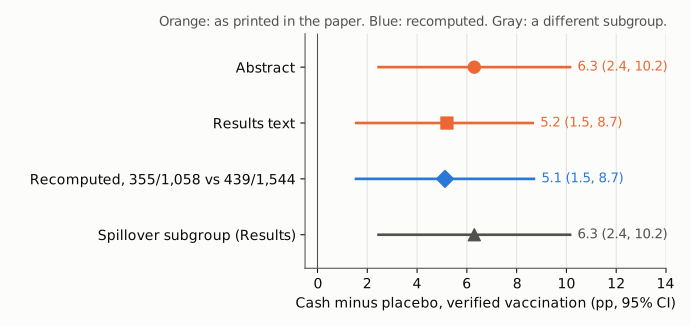
Figure 2. Cash-minus-placebo difference in verified vaccination (percentage points, 95% CI) on one axis, with zero as a thin reference line. Orange marks the values printed in the abstract and in the Results. Blue marks the value recomputed from the abstract's counts with a naive, unclustered two-proportion interval. Gray marks the spillover-subgroup estimate printed in the Results. The recomputed value and interval match the Results. The abstract's estimate and interval are the same as the spillover subgroup's.
Why it matters
- This is the headline objective outcome. Intentions and reported vaccinations are self-reports. Verified vaccination comes from District Health Office records and is the only registry-confirmed measure. The abstract presents it as the confirming result.
- Size of the effect. The abstract gives 6.3 percentage points. The paper's own counts give 5.1 (5.2 in the Results), so the abstract overstates the absolute effect by about 1.1 pp and implies a relative increase of about 21% rather than the 18% the Results report. It also gives a placebo baseline of 30.3% instead of 28.4%.
- Precision and significance. The abstract gives a lower confidence bound of 2.4 pp and P = 0.001. The analysis of the same sample gives 1.5 pp and P = 0.005. The effect remains positive and its interval still excludes zero, so the qualitative conclusion that cash incentives increased verified uptake does not change.
- Comparison with self-report. The Results give a 3.7-point cash effect on reported vaccination (the abstract gives 3.5). Against that, the abstract's verified effect looks 1.70 times as large (6.3/3.7). With the Results figure the ratio is 1.41 (5.2/3.7).
- Downstream use. Abstracts are what evidence summaries, policy briefs and meta-analyses usually extract. A reader who takes the abstract's percentages together with its counts gets an inconsistent 2×2 table.
A side note for a statistician: the Results interval (1.5, 8.7) is the same as a naive interval that ignores clustering, although the Results report an intracluster correlation of 0.64 for verified vaccination. This write-up compares like with like and makes no claim about which interval is appropriate. The inconsistency described here does not depend on that question.
Explanations considered
- A different population or subsample. Ruled out for the counts. 1,058 = 548 + 510, the two cash arms in Table 2 phase IV; 1,544 is the placebo arm there; and 223 + 132 = 355 rebuilds the cash count from Table 2's percentages. The numerators and denominators therefore belong to the main verified treated sample. No subsample is described that has those sizes and the abstract's percentages.
- Adjusted rather than crude estimates. Unlikely. The abstract gives the percentages with raw counts in parentheses ("36.6% (355 of 1,058)"), the form of a crude proportion. No adjustment turns 355/1,058 into 36.6%. The Results report the crude comparison for this sample as 33.6% vs 28.4%, and the model-based results (Table 3) are reported as odds ratios, not as percentages.
- A different time point or outcome definition. Not supported. Table 2 dates phase IV to 30 April 2022, and the Results "Verified vaccination status" section uses the end of April 2022. The combined-cash sentence says "as of April 2023", which does not match the 30 April 2022 cut-off in Table 2. Its figures, however, are the Table 2 figures. No other cut-off is given for the abstract.
- Rounding. Ruled out. 355/1,058 = 33.55% and 439/1,544 = 28.43%. Reaching 36.6% would take 387 vaccinated cash participants, and reaching 30.3% would take 468 vaccinated placebo participants.
- The abstract quoting the spillover analysis. This matches the abstract's percentage, difference and interval exactly (36.6%, 6.3, 2.4–10.2), but the P value differs (0.001 vs 0.002), and the spillover analysis concerns placebo-video participants in cash villages, not the cash arm. The spillover paragraph is itself not internally consistent: 36.6 − 6.3 = 30.3, not its stated reference rate of 26.8%. So the paper does not settle where the abstract's figures came from. Whatever their source, they do not describe the 355/1,058 vs 439/1,544 comparison they are attached to.
- A conversion or archiving artifact. Ruled out. The publisher's HTML version of record, the PMC web page, the Europe PMC full-text XML and the PMC archive all carry the same numbers.
- Already corrected. No. The only correction notice, an Author Correction (doi:10.1038/s41591-023-02772-z, 22 December 2023), replaces a wrong link to the protocol in the Methods and does not touch these figures.
Status
As of 2026-10-23:
- Version of record. The publisher's page (nature.com/articles/s41591-023-02670-4, marked "This article has been updated") has the same abstract, Results and spillover text quoted above. The PMC and Europe PMC full texts agree with it word for word.
- Corrections and notices. Crossref and Europe PMC list one Author Correction (doi:10.1038/s41591-023-02772-z; PMC10957464), dated 22 December 2023. Its full text concerns only the protocol link. No retraction or expression of concern is listed.
- Supplementary material. The Supplementary Information (98 pages: Supplementary Tables S1–S5 and questionnaires) gives no verified-vaccination figures of 30.3%, 36.6%, 33.6%, 1,544 or 1,058. Extended Data Table 5 is an image in the archived text and was not read from the image. Its contents are taken here from the Results paragraph that describes it.
- Replication data. A separate check tabulated the replication file the paper deposits on Harvard Dataverse (doi:10.7910/DVN/X5MBHP; the 3,075 rows with a non-missing verified-vaccination status, grouped by individual treatment). It found placebo 439/1,544 = 28.43%, low cash 223/548 = 40.69%, high cash 132/510 = 25.88% and cash combined 355/1,058 = 33.55%, which agrees with the Results and Table 2. No grouping tried gave 30.3% with n = 1,544 or 36.6% with n = 1,058. In the same file, placebo-video participants in cash villages were 196/599 = 32.7% vaccinated and those in placebo villages 184/686 = 26.8%. The first of these differs from the 36.6% in the spillover paragraph.
- PubPeer. The PubPeer search API and site returned a human-verification challenge to automated requests, so a direct search could not be completed. A web search for the article title on PubPeer returned no PubPeer thread.
- Sources. The article as archived in PMC (PMC10719106); the publisher's HTML; Crossref and Europe PMC notice records; the Author Correction (PMC10957464); the Supplementary Information; Harvard Dataverse doi:10.7910/DVN/X5MBHP.
Suggested correction
In the abstract, change the verified-vaccination sentence so that it matches its counts and the Results, for example: "in the cash treatment arm, 33.6% (355 of 1,058) of verified participants had at least one dose of the COVID-19 vaccine compared to 28.4% (439 of 1,544) for those in the placebo—a difference of 5.2% (95% CI: 1.5, 8.7; P = 0.005)." The authors may also wish to:
- Check the spillover paragraph's combined-cash figures (36.6%; difference 6.3%; 95% CI 2.4, 10.2; P = 0.002) against Extended Data Table 5 and the replication data, since 36.6 − 6.3 does not equal the stated reference rate of 26.8%.
- Change "as of April 2023" in the combined-cash sentence to the 30 April 2022 cut-off used in Table 2, if that is the intended date.