← Back to the plain-language case
Correlations printed as significant in this insulin-clearance study are too small to reach P < 0.05
Diabetes Care (2023) · doi:10.2337/dc23-1267 · PMC10698223
Summary
The paper reports that insulin clearance correlates negatively with liver lipid content (HCL) in type 2 diabetes (T2D) and with HbA1c, each at "P < 0.05", but prints coefficients such as r = −0.004, −0.005 and −0.037 in a T2D group of at most 489 people and r = −0.058 and −0.127 in a control group of at most 167. At those sizes |r| must be at least 0.089 (T2D) or 0.152 (controls) to reach two-sided P < 0.05; the recomputed P values for nine correlations described as significant run from 0.10 to 0.99, and seven of them underlie statements in the abstract. These correlations are the only correlational evidence for the abstract's conclusion that clearance "correlates negatively with liver lipid content rather in T2D". The regression lines drawn in Fig. 3 are far steeper than the printed coefficients allow; the paper does not show whether the coefficients, their labels or the significance statements are wrong.
What the paper reports
Abstract, Results:
HCL negatively associated with ICIVGTT and ICMMT in T2D (r = -0.005 and r = -0.037) and CON (r = -0.127 and r = -0.058, all P < 0.05).
In T1D, ICCLAMP, ICIVGTT, and ICMMT correlated negatively with HbA1c (all P < 0.05).
Abstract, Conclusions:
Insulin clearance is reduced in both T1D and T2D within the first year after diagnosis but correlates negatively with liver lipid content rather in T2D.
Results, Correlation Analyses (T2D):
In T2D, ICCLAMP correlated negatively with HbA1c (r = -0.004; P < 0.05) (Fig. 3B) but not with HCL or M value (Supplementary Fig. 3A and C).
On the other hand, ICIVGTT correlated positively with M value (r = -0.178; P < 0.05) (Supplementary Fig. 3F) and negatively with HCL (r = -0.005; P < 0.05) (Fig. 3D). ICMMT correlated negatively with HCL (r = -0.037; P < 0.05) (Fig. 3E).
Results, Correlation Analyses (controls, CON):
Similarly, ICMMT correlated positively with whole-body insulin sensitivity (r = 0.047; P < 0.05) (Supplementary Fig. 3I) and negatively with HCL (r = -0.058; P < 0.05) (Supplementary Fig. 3G) in CON.
Research Design and Methods, Statistics:
Pearson or Spearman correlations were used for numerical variables.
A two-tailed P value <0.05 was considered to indicate a statistically significant difference or correlation.
Figure 3 legend (Supplementary Fig. 3 uses similar wording):
Statistically significant correlations are depicted with linear regression lines and the respective coefficients (r).
Conclusions section (the article's discussion), final paragraph:
3) correlates with liver lipid content rather in T2D and with impaired glycemic control rather in T1D
The group sizes are CON 167, T1D 306 and T2D 489 (Abstract; Table 1). The Supplementary Fig. 3 legends (figshare 10.2337/figshare.24156732) print the same coefficients next to each regression line. They also give the three T1D coefficients behind the abstract's "In T1D ... all P < 0.05": r = −0.001 (ICCLAMP), −0.002 (ICIVGTT) and −0.012 (ICMMT), each against HbA1c.
What the paper's own numbers show
Method. The usual test of a correlation coefficient is t = r·√((n − 2)/(1 − r²)) with n − 2 degrees of freedom. I computed the two-sided P for each printed r at the full group size, which is the largest n any analysis could have had and so gives the smallest possible P. A smaller analysis sample only makes P larger. For the HCL correlations I also used the smaller number of participants with an HCL measurement, taken from the per-bar n printed under Fig. 2 (participants with plus without steatosis). Fisher's z, the usual large-sample test for Spearman's ρ, gives P values that differ from these by at most 0.001. I also inverted the test to find the critical |r| at each n.
| Quantity | Location | Reported | Recomputed |
|---|---|---|---|
| Critical |r| for two-sided P < 0.05 | Statistics ("two-tailed") | — | T2D (n = 489): 0.089; T1D (n = 306): 0.112; CON (n = 167): 0.152; T2D with HCL (n = 129–143): 0.164–0.173 |
| T2D ICIVGTT vs HCL | Abstract; Results; Fig. 3C; Supp. Fig. 3D | r = −0.005, P < 0.05 | P = 0.91 (n = 489); 0.95 (n = 129) |
| T2D ICMMT vs HCL | Abstract; Results; Fig. 3E; Supp. Fig. 3G | r = −0.037, P < 0.05 | P = 0.41 (n = 489); 0.66 (n = 143) |
| CON ICIVGTT vs HCL | Abstract; Results; Supp. Fig. 3D | r = −0.127, P < 0.05 | P = 0.10 (n = 167); 0.20 (n = 105) |
| CON ICMMT vs HCL | Abstract; Results; Supp. Fig. 3G | r = −0.058, P < 0.05 | P = 0.46 (n = 167); 0.53 (n = 120) |
| T2D ICCLAMP vs HbA1c | Results; Fig. 3B; Supp. Fig. 3B | r = −0.004, P < 0.05 | P = 0.93 (n = 489) |
| T1D ICCLAMP vs HbA1c | Abstract and Results ("all P < 0.05"); Fig. 3B; Supp. Fig. 3B | r = −0.001 | P = 0.99 (n = 306) |
| T1D ICIVGTT vs HbA1c | Abstract and Results ("all P < 0.05"); Fig. 3D; Supp. Fig. 3E | r = −0.002 | P = 0.97 (n = 306) |
| T1D ICMMT vs HbA1c | Abstract and Results ("all P < 0.05"); Fig. 3F (line drawn, no label); Supp. Fig. 3H | r = −0.012 | P = 0.83 (n = 306) |
| CON ICMMT vs M value | Results; Supp. Fig. 3I | r = 0.047, P < 0.05 | P = 0.55 (n = 167) |
| n needed for P < 0.05 | — | — | |r| = 0.004: 240,092; 0.005: 153,659; 0.037: 2,807; 0.058: 1,143; 0.127: 239 |
| For comparison: CON ICIVGTT vs M value | Abstract; Results; Supp. Fig. 3F | r = 0.199, P < 0.05 | P = 0.0099 (consistent) |
| For comparison: T2D ICIVGTT vs M value | Abstract (r = 0.178); Results (r = −0.178, called "positively") | P < 0.05 | P = 7.6 × 10⁻⁵ (consistent; the sign differs between Abstract and Results) |
| For comparison: CON ICMMT vs M value | Abstract (r = 0.176); Results and Supp. Fig. 3I (r = 0.047) | P < 0.05 | P = 0.023 for 0.176; 0.55 for 0.047 |
| For comparison: all groups ICIVGTT vs HbA1c | Results ("negatively associated") | r = 0.092, P < 0.05 | P = 0.0043 (significance consistent; the positive sign contradicts "negatively") |
The coefficients that do reach significance (r = 0.199, 0.178, 0.176, 0.092) show that the test applied here does not reject every correlation in the paper. Only the near-zero coefficients fail.
The plotted lines. Figure 3 draws the "significant" correlations as fitted lines. I measured those lines on the published image and converted the slope b to the coefficient it implies, r = b·SD(x)/SD(y), using the group SDs printed in Table 1 and the Abstract (details in recompute.py.txt). The lines are much steeper than the printed coefficients allow. For T2D ICCLAMP vs HbA1c the line implies r ≈ −0.27, against a printed −0.004. For T1D ICCLAMP vs HbA1c it implies ≈ −0.32 (printed −0.001), for T2D ICMMT vs HCL ≈ −0.18 (printed −0.037), and for T1D ICMMT vs HbA1c ≈ −0.26 (printed −0.012). These estimates are approximate: besides the pixel measurement, the conversion assumes an untransformed least-squares (Pearson) line, whereas the Methods also mention log transforms and Spearman correlations, and it uses whole-group SDs as stand-ins for the SDs of the unreported analysis samples. They suggest that the plotted data carry associations of moderate size, and that the printed numbers are not the correlation coefficients of those data.
Figure
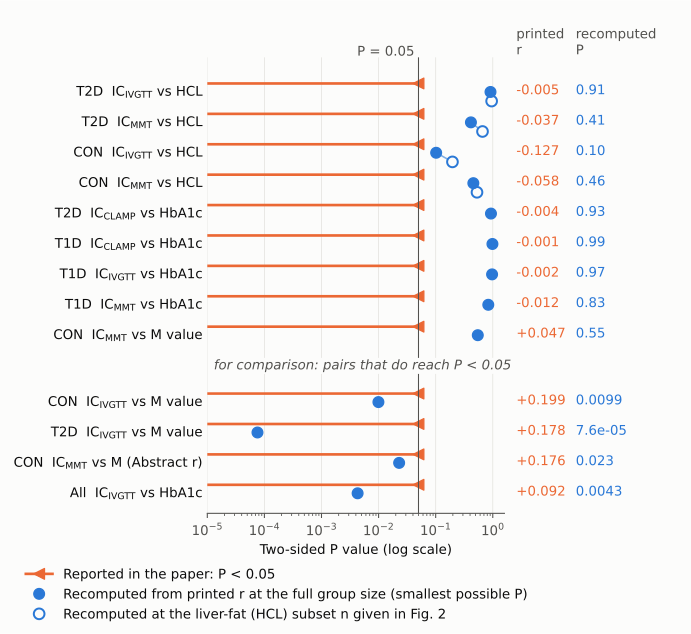
Each row is one correlation that the paper describes as significant. The orange line and arrowhead show the paper's claim, P < 0.05. The filled blue dot is the two-sided P recomputed from the printed r at the full group size, which is the smallest P that coefficient could have. The open blue dot, for the liver-fat rows, is the same calculation at the number of participants with an HCL measurement (Fig. 2). The thin vertical line marks P = 0.05. The nine upper rows all fall to the right of it, between P = 0.10 and 0.99. The four lower rows are correlations from the same paper whose printed r does reach P < 0.05, shown for comparison.
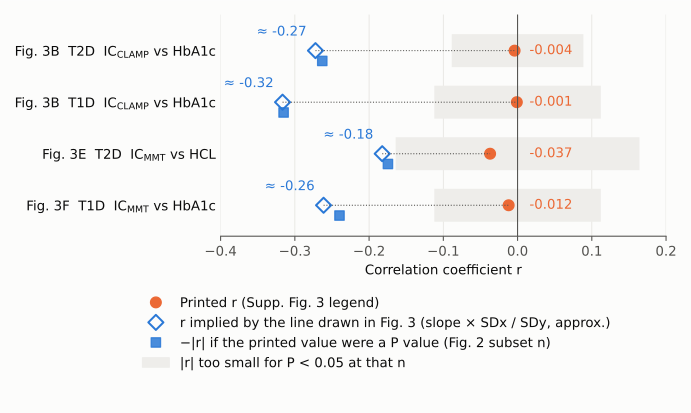
For the four lines that could be converted (an SD is reported for both variables), the orange dot is the printed r and the open blue diamond is the r implied by the slope of the line drawn in Fig. 3 (slope × SDx/SDy, measured from the image, approximate). The gray band marks |r| values too small for P < 0.05: at the full group size for the HbA1c rows and at the HCL subset size for the HCL row. Every printed value lies inside the band, and every line lies outside it. The small blue squares test one possible explanation, discussed below: they show the |r| that each printed value would imply if it were a P value rather than r, at the Fig. 2 subset size.
Why it matters
- Abstract and title. The abstract's only correlational evidence for a liver-lipid link in T2D is "r = −0.005 and r = −0.037 ... P < 0.05". Its contrast with CON rests on r = −0.127 and −0.058, and these also fail (P ≥ 0.10 and P ≥ 0.46 even at the full group size). The abstract's statement that all three clearance measures correlate with HbA1c in T1D rests on r = −0.001, −0.002 and −0.012 (P = 0.83–0.99). The abstract conclusion ("correlates negatively with liver lipid content rather in T2D"), the final conclusion point 3, and the title's pairing of liver lipids with T2D and glycemic control with T1D all draw on these correlations.
- Results and Conclusions section. The Conclusions section (the article's discussion) repeats that "ICCLAMP negatively correlated with HbA1c also in T2D", which rests on r = −0.004.
- What is not affected. The main finding, lower clearance in recent-onset T1D and T2D than in CON, comes from group comparisons (Abstract; Fig. 1) and does not depend on these correlations. The steatosis comparison, lower ICMMT with steatosis in T2D and CON (Fig. 2D), also stands and independently points toward a liver-fat link.
- Assessment. The plotted lines suggest that real negative associations of moderate size may exist. The liver-lipid and HbA1c correlation findings are therefore unsupported as printed, not shown to be false. A reader cannot tell from the paper which associations are significant, how strong they are, or whether the T2D-versus-T1D contrast in the title holds.
Explanations considered
- Text-conversion artifact (lost digits, minus signs or superscripts). Ruled out. The same values appear in the Europe PMC JATS XML, on the live PMC page, in the PubMed abstract, and as text printed inside the published Fig. 3 and Supplementary Fig. 3 images.
- Smaller analysis samples (missing MRS, MMT or clamp data). Ruled out. A smaller n only raises P. The calculation already uses the largest possible n.
- Spearman instead of Pearson. Ruled out. The Methods allow either, but Fisher's z (the large-sample test for ρ) gives P values that differ by at most 0.001.
- One-tailed tests. Ruled out, and the Methods specify two-tailed tests. The one-tailed critical |r| is still 0.074 (T2D), 0.094 (T1D) and 0.128 (CON), above every failing coefficient.
- Adjusted (partial) correlations from regression models. Ruled out. A partial correlation is tested with fewer degrees of freedom, so its critical |r| is higher still. A coefficient of 0.005 cannot reach P < 0.05 at any n in this study, whatever the adjustment.
- The printed value is R² rather than r. Does not account for the numbers. √0.005 = 0.071 and √0.004 = 0.063 still give P = 0.12 and 0.16 at n = 489, and √0.001 to √0.012 give P = 0.06–0.58 in T1D. This reading also does not match the line slopes (≈ −0.27 against √0.004 = 0.063).
- The printed value is a regression slope rather than r. Accounts for one panel at most. The slope of the Fig. 3C line, about −0.0052 a.u. per % HCL, matches its label 0.005. The other lines do not match: −0.018 and −0.020 for labels 0.004 and 0.001 in Fig. 3B, −0.029 for 0.002 in Fig. 3D, and −0.0072 for 0.037 in Fig. 3E.
- The printed value is a P value rather than r. Consistent with the four measurable lines, but not confirmed. Read as P values at the Fig. 2 subset sizes, 0.004, 0.001, 0.037 and 0.012 imply |r| = 0.263, 0.315, 0.175 and 0.240, close to the line-implied 0.27, 0.32, 0.18 and 0.26. This fits only if each analysis used the participants with HCL data, and the paper does not report the n of any correlation. The reading also leaves the CON HCL values unexplained: read as P values, 0.127 and 0.058 would be non-significant, which contradicts "all P < 0.05". The minus signs printed in the text also do not fit P values.
None of these readings accounts for every printed number. Only the authors' analysis output can settle what each number is.
Status
As of 2026-10-24.
- Version of record. The publisher page (diabetesjournals.org, reached by DOI redirect) returned HTTP 403 to automated access, so its HTML and PDF were not read directly. Three other copies of the published article carry identical numbers in the Abstract and Results, with true minus signs (U+2212): the Europe PMC full-text XML, the PMC article page, and the PubMed abstract (PMID 37874983). The published Fig. 3 image (PMC dc231267f3.jpg) prints the labels "r=0.001", "r=0.004", "r=0.005", "r=0.002" and "r=0.037" next to downward-sloping fitted lines.
- Supplement. The figshare item 10.2337/figshare.24156732 (Supplementary Table 1 and Supplementary Figs. 1–3) was downloaded and checked. The Supplementary Fig. 3 legends print the same coefficients: −0.001 and −0.004 (B), −0.127 and −0.005 (D), −0.002 (E), 0.199 and 0.178 (F), −0.058 and −0.037 (G), −0.012 (H) and 0.047 (I). The supplement does not report an n or a P value for any correlation.
- Corrections and retractions. None found. I checked Crossref update records, PMC and Europe PMC correction/retraction notices, and the Europe PMC comment-correction list.
- PubPeer. No thread found. Direct queries to the PubPeer API and search page were refused (human verification required). A web search restricted to pubpeer.com found no entry for this DOI or title.
- Sources. doi:10.2337/dc23-1267; PMC10698223; PubMed 37874983; supplement on figshare.
Other inconsistencies in the same section, not needed for the main finding:
- The Abstract gives r = 0.178 for T2D ICIVGTT vs M value. The Results give r = −0.178 and call the correlation positive.
- The Abstract gives r = 0.176 for CON ICMMT vs M value. The Results and Supplementary Fig. 3I give r = 0.047.
- The Results say ICIVGTT was "negatively associated" with HbA1c across all groups, but print r = 0.092.
- The Results cite "Fig. 3D" for T2D ICIVGTT vs HCL. Per the Fig. 3 legend, that correlation is in panel C.
Suggested correction
- Report each correlation in full. For every correlation in the Abstract, Results, Fig. 3 and Supplementary Fig. 3, the authors could give the coefficient type (Pearson or Spearman, unadjusted or adjusted, and the covariates), the number of participants analyzed, the coefficient and the exact two-sided P value. A supplementary table would hold this best.
- Replace the figure labels. The labels in Fig. 3 and Supplementary Fig. 3 should be replaced with the actual coefficients.
- Remove failing claims. Any correlation that is not significant once recomputed should no longer be described as significant. In that case, the abstract's liver-lipid and T1D-HbA1c statements, the final conclusion point 3 and the title should be revised to rest on the group and steatosis comparisons.
- Fix the smaller inconsistencies. These are the sign of the T2D ICIVGTT–M value coefficient, the CON ICMMT–M value coefficient (0.176 vs 0.047), the word "negatively" with r = 0.092, and the Fig. 3 panel citation.