← Back to the plain-language case
Abstract places the statistical-regularity bias reduction at the low-probability location; Results show the opposite
Hum Brain Mapp (2023) · doi:10.1002/hbm.26520 · PMC10681649
Summary
The abstract states that statistical regularities "reduced this attention bias when the target was presented at a low probability location". The Results report the opposite direction. In BA17 and BA19 the spatial bias vector lies further from the target for the high-probability target location (HTPL > LTPL in distance, t(68) = 4.93 and 2.85). The Methods define a larger distance as less bias towards the target, and target-quadrant (ROI_IN) activity is lower for HTPL (LTPL > HTPL, t(206) = 3.04). Every reported effect size recomputes from its t statistic (d = t/√n), and the Discussion and Conclusions describe the direction as the Results do, so this is an error in the abstract's wording, not in the analysis. It still matters because the direction is what separates the paper's two competing hypotheses: the abstract, read on its own, points to the account the paper's data argue against.
What the paper reports
Abstract:
Salience acted primarily by reducing the attention bias towards the target location when associated with irrelevant distractors, while statistical regularities reduced this attention bias when the target was presented at a low probability location, particularly at the lower levels of the visual hierarchy.
Introduction, last paragraph (the two hypotheses):
In the priority maps framework, we expected increased activation for targets presented in high versus low probability location (HTPL > LTPL), with sensory salience that should further boost these spatially specific responses when the target is also the salient item (Awh et al., 2012; Zhang et al., 2021). As an alternative hypothesis, if mechanisms of “expectation suppression” apply also to recurring targets (see Zhang et al., 2021, for the case of recurring distractors), one may predict a reduction of the spatial bias towards the representation of the target location, for targets presented at the high versus low probability locations (HTPL < LTPL).
Materials and Methods, "Group-level analyses of spatially specific occipital responses" (definition of the outcome):
Any increase of distance between this point and the subject-specific vector expresses a modification of the spatial bias away from the target location (i.e., a decrease of the vector's magnitude and/or a deviation of the vector's sense away from the target location, see Figure 5).
Results, "Attention priority signals modulate activity in the occipital cortex" (ROI analysis):
Specifically, the ROI_IN activity was larger in LTPL compared with HTPL (“LTPL > HTPL”, t(206) = 3.04, p < 0.005, Cohen's d = 0.21), while target-probability did not affect activity in ROI_DIAG (“LTPL > HTPL”, p > 0.9).
This revealed a significant effect of target-probability location in BA17 (“LTPL > HTPL”, t(68) = 3.42, p < 0.003, Cohen's d = 0.41), while this effect did not reach significance in BA18 (p > 0.9) and BA19 (p > 0.2).
Same section (bias-vector analysis):
The comparisons between HTPL and LTPL, separately for the three BAs, revealed a significant effect of statistical regularities in BA17 (HTPL > LTPL, t(68) = 4.93, p < 0.001, Cohen's d = 0.59) and BA19 (HTPL > LTPL, t(68) = 2.85, p = 0.017, Cohen's d = 0.34), but not in BA18 (p > 0.9). In BA17 and BA19, the spatial bias vector was more distant from the target location in HTPL than in LTPL, which explains the target-probability location × BA interaction.
Same section, summary paragraph:
In sum, we found evidence that statistical regularities modulate the spatial bias in area BA17 and BA19, with a loss of the spatial specificity towards the target location in the HTPL condition.
Discussion, "Occipital spatial representations are modulated according to statistical regularities and salience":
In both regions, these analyses showed a loss of the attentional bias for targets presented at the high- compared to the low target-probability location (Figure 5).
The finding of a reduced bias towards the target location in the high-target probability condition is consistent with the “expectation suppression” account.
Conclusions:
Statistical regularities decreased the spatial bias towards the target representation primarily in BA17, and this was independent of parietal-occipital interactions.
What the paper's own numbers show
Method. I took each reported test of target-probability location (HTPL vs LTPL) and fixed its direction from the printed contrast and the Methods definition. For the bias-vector distance, "HTPL > LTPL" means the HTPL vector is further from the target point (−11, 11), that is, less bias towards the target at HTPL. For ROI_IN activity, "LTPL > HTPL" means a weaker response in the target quadrant at HTPL. To check that the printed statistics are internally consistent (so that the direction is not a typo in the test itself), I recomputed Cohen's d for a paired test as d = t/√n. Here n = df + 1. The degrees of freedom correspond to 23 participants × 3 salience conditions (n = 69, df 68) and 23 × 3 salience conditions × 3 Brodmann areas (n = 207, df 206). I also recomputed two-sided p values from t and df. recompute.py.txt prints every number below.
| Quantity | Location | Reported | Recomputed from the paper's t and df |
|---|---|---|---|
| Bias-vector distance, BA17 | Results, bias-vector analysis | HTPL > LTPL, t(68) = 4.93, p < 0.001, d = 0.59 | d = 4.93/√69 = 0.594; two-sided p = 5.6 × 10⁻⁶. Less bias at HTPL |
| Bias-vector distance, BA19 | Results, bias-vector analysis | HTPL > LTPL, t(68) = 2.85, p = 0.017, d = 0.34 | d = 0.343; two-sided p = 0.0058 (× 3 = 0.0173, matching the reported 0.017 if adjusted for three BAs; the paper does not name the correction). Less bias at HTPL |
| Bias-vector distance, BA18 | Results, bias-vector analysis | p > 0.9 | No effect in either direction |
| ROI_IN activity, BA17 | Results, ROI analysis | LTPL > HTPL, t(68) = 3.42, p < 0.003, d = 0.41 | d = 0.412; two-sided p = 0.0011. Weaker target response at HTPL |
| ROI_IN activity, all BAs | Results, ROI analysis | LTPL > HTPL, t(206) = 3.04, p < 0.005, d = 0.21 | d = 3.04/√207 = 0.211; two-sided p = 0.0027. Weaker target response at HTPL |
| Consistency check: ROI_IN > ROI_DIAG, BA17 / BA18 / BA19 | Results, ROI analysis | t(137) = 5.46 / 13.48 / 15.79; d = 0.46 / 1.15 / 1.34 | d = 0.465 / 1.147 / 1.344 (n = 138) |
| Consistency check: SDD > STD in ROI_DIAG | Results, ROI analysis | t(137) = 6.69, d = 0.57 | d = 0.569 |
| Direction of the statistical-regularity effect | Abstract | Bias reduced at the low-probability location | All four significant tests: reduced at the high-probability location; none at the low-probability location |
All reported effect sizes agree with their t statistics to the printed precision, so the signs and contrasts are internally consistent. Every significant test of target-probability location points one way: towards a smaller target bias at HTPL. The abstract assigns the reduction to the other location.
Figure
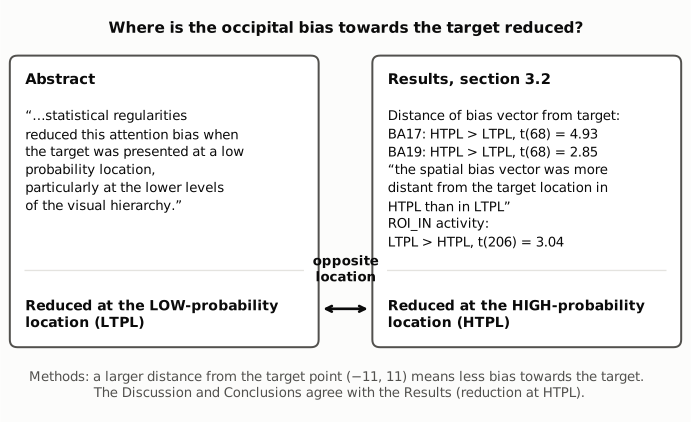
Figure 1. The left panel quotes the abstract sentence on statistical regularities. The right panel gives the bias-vector and ROI_IN contrasts and a Results sentence, quoted from section 3.2 of the paper. The abstract puts the reduced bias towards the target at the low-probability location (LTPL). The Results put it at the high-probability location (HTPL). The footer notes the Methods definition that links a larger bias-vector distance to less bias, and that the Discussion and Conclusions follow the Results.
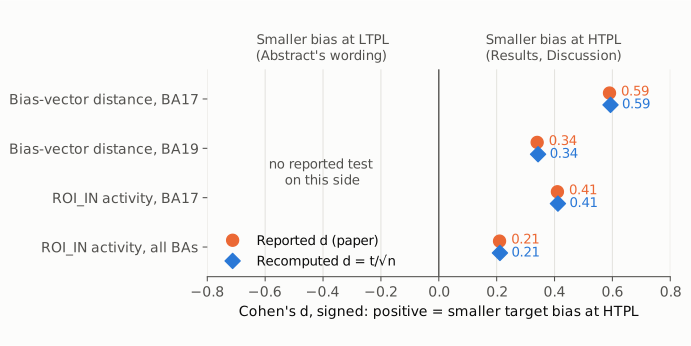
Figure 2. Each significant test of target-probability location in the Results, shown as a signed Cohen's d (positive = smaller bias towards the target at HTPL). Orange circles show the d printed in the paper; blue diamonds show d = t/√n recomputed from the paper's t and df. The two agree for every test, and every test lies on the HTPL side of zero. The abstract's wording corresponds to the left side, where no reported test lies. The BA18 bias-vector and ROI_IN tests (p > 0.9) and the BA19 ROI_IN test (p > 0.2) are not drawn, because no t or d is given for them.
Why it matters
- It is one of the abstract's two headline occipital findings. The sentence contrasts the effect of salience with the effect of statistical regularities. With the location reversed, a reader of the abstract alone (or of the PubMed record) takes away the opposite of the paper's result.
- The direction decides between the paper's hypotheses. The Introduction sets out two predictions. The priority-map account predicts a stronger target response at the high-probability location (HTPL > LTPL); the expectation-suppression account predicts a reduced target bias there (HTPL < LTPL). The Results and Discussion support expectation suppression ("The finding of a reduced bias towards the target location in the high-target probability condition is consistent with the 'expectation suppression' account"). The abstract's wording, a reduction at the low-probability location, implies a relatively stronger bias at the high-probability location, which is the pattern the priority-map account predicts.
- The data and statistics are not affected. The size and significance of the effects are as reported (BA17 d = 0.59; BA19 d = 0.34, unadjusted two-sided p ≈ 0.006; no effect in BA18). Only the abstract's statement of the direction needs correcting.
Explanations considered
- Is the distance measure inverted, so that "more distant" means more bias? No. The Methods say an increase in distance "expresses a modification of the spatial bias away from the target location", and the Results add that "the spatial bias vector was more distant from the target location in HTPL than in LTPL". The bias is therefore smaller at HTPL.
- Could the abstract be summarising a different analysis? No. The ROI_IN/ROI_DIAG analysis points the same way as the bias vectors: ROI_IN activity is larger for LTPL than HTPL overall (t(206) = 3.04) and in BA17 (t(68) = 3.42). The retinotopic-atlas replication in Supplementary Figure S2 (Panel C legend) also states "HTPL reduced the bias towards the target position". No analysis in the paper or its supplement reports a reduced target bias at LTPL.
- Could "this attention bias" refer to some other bias, for example towards distractors? No. In the abstract, "this attention bias" points back to "the attention bias towards the target location" in the same sentence. The Results and Discussion describe the statistical-regularity effect as acting on the target representation, at HTPL.
- Could "low probability location" be read as the location the target was not expected at, describing the same contrast from the other side? Only if the sentence said the bias was stronger at the low-probability location. As written, it says the bias was reduced when the target was at the low-probability location, which is the reverse of HTPL < LTPL.
- Could the reversed contrast be a typo in the statistics rather than in the abstract? No. The printed d values match t/√n for every test, the Results prose and Figure 5 description ("the dark-colored vectors (HTPL) that are further away from the 45° dotted-line") agree with the contrasts, and the Discussion and Conclusions describe the same direction.
- Conversion or archiving artifact? No. The PMC text, the Europe PMC XML, the PubMed abstract and the publisher's typeset PDF all carry the same abstract wording. The bioRxiv preprint (10.1101/2023.09.25.557901 v1) has it too.
A separate observation, which does not bear on the direction: the degrees of freedom show that the paired tests pool the three salience conditions (df 68 = 23 × 3 − 1) or the salience conditions and BAs (df 206 = 23 × 9 − 1) as if they were independent observations, so the p values may be smaller than a test on 23 participant-level means would give. This does not change which location shows the reduced bias.
Status
As of 2026-10-24:
- Version of record. The Wiley page returned HTTP 403, so I checked the publisher's typeset Early View PDF (20 pages, with the Wiley footer and "Downloaded from onlinelibrary.wiley.com/doi/10.1002/hbm.26520" on each page) in a copy deposited in an institutional repository. Its abstract has the same "low probability location" sentence, and its Results section 3.2.2 has the same contrasts and numbers. The PMC web text, the Europe PMC full-text XML and the PubMed abstract (PMID 37877138) match. Every quote from the article above was confirmed verbatim against the PMC-archived text; the Figure S2 legend wording comes from the supplement (Data S1).
- Supplements. The only supplement is Data S1 (HBM-44-6439-s001.docx), retrieved from the Europe PMC supplementary-files bundle. Figure S1 explains the bias-vector computation. Figure S2 repeats the bias-vector analysis with a probabilistic retinotopic atlas, and its legend states that HTPL reduced the bias towards the target position (significant in ROI_V2, F(2,110) = 5.6, and ROI_V3, F(2,110) = 4.9). The supplement therefore agrees with the Results, not the abstract. The data are available from the corresponding author on request; no source data are posted.
- Corrections. I found no correction, erratum, expression of concern or retraction. Crossref lists no update-to or updated-by relations (only has-preprint 10.1101/2023.09.25.557901), and a Crossref search for updates to this DOI returned none. PMC shows no notice, and the PubMed record has no CommentsCorrections entries. Web searches found no erratum, no Retraction Watch entry and no PubPeer thread.
- Searches that could not be completed. The Europe PMC search API returned 503 on every attempt, and PubPeer returned 403 to both the page and the API, so neither could be checked directly.
Suggested correction
In the Abstract, replace
statistical regularities reduced this attention bias when the target was presented at a low probability location
with
statistical regularities reduced this attention bias when the target was presented at a high probability location
This leaves the rest of the sentence ("particularly at the lower levels of the visual hierarchy") unchanged. It agrees with the bias-vector results in BA17 and BA19, the ROI_IN results, Supplementary Figure S2, the Discussion and the Conclusions. If the PubMed and indexing records are generated from the article, they should be updated as well.