← Back to the plain-language case
Abstract reports all pocket-depth measures significant for CVD mortality; Table 2 shows none are
BMC Med (2023) · doi:10.1186/s12916-023-03139-4 · PMC10642059
Summary
This cohort study (SHIP-START, n = 3047, 125 CVD deaths) relates periodontal and inflammatory markers to mortality. Its abstract states that "For CVD mortality, all PPD related variables showed significant associations". The paper's own Table 2 shows the opposite: for CVD mortality, none of the three pocket probing depth (PPD) measures is significant. All six confidence intervals (per unit and per SD) include 1, the printed P values are 0.275, 0.302 and 0.337, and the paper's Results text says the same thing. The numbers in the table are internally consistent: Wald P values recomputed from the printed intervals are 0.274, 0.303 and 0.336. The abstract sentence is the only single-exposure CVD result it reports. Read alone, it reverses the finding for the periodontal marker that the paper describes as best reflecting current periodontal inflammation. The only published correction (January 2025) concerns funding and leaves the sentence unchanged.
What the paper reports
Abstract, Results:
For CVD mortality, all PPD related variables showed significant associations.
Results, "Inflammation and periodontitis as risk factors for mortality":
However, compared with the results for CAL and missing teeth, the PPD measures showed only weak associations with mortality, as indicated by smaller effect sizes. For CVD mortality, neither mean PPD nor extent PPD ≥ 3 mm/4 mm showed a relevant association (Table 2). Classical Cox proportional hazards models with fixed baseline exposures and covariates (Additional file 1: Table S4) confirmed these results.
Table 2, PPD rows, CVD-mortality columns. The columns are HR (95% CI) per 1-unit increase | HR (95% CI) per SD increase | P-value:
Mean PPD, mm | 1.111 (0.920; 1.341) | 1.078 (0.942; 1.233) | 0.275
Sites with PPD ≥ 3 mm, % | 1.004 (0.997; 1.011) | 1.096 (0.921; 1.305) | 0.302
Sites with PPD ≥ 4 mm, % | 1.004 (0.996; 1.012) | 1.070 (0.932; 1.228) | 0.337
Methods, "Statistical analyses", on the significance threshold:
Regarding the interaction terms, two-sided P values < 0.10 were considered statistically significant. Otherwise, 0.05 was set as the cut-off for significance.
A related sentence in the Abstract, Results, which comes just before the CVD sentence:
All markers of periodontitis and inflammation showed apparent associations with all-cause mortality (HRs per SD-increase: mean PPD: 1.068 (95% confidence interval (CI): 0.988–1.155) […]
The Abstract, Conclusions, and the main-text Conclusions:
Both periodontitis and inflammation were significantly associated with all-cause mortality and CVD mortality.
Periodontitis and systemic inflammation were both significantly associated with all considered types of mortality.
Discussion, on how PPD is interpreted:
measures of PPD, which best reflects current periodontal inflammation
What the paper's own numbers show
Method. Table 2 prints, for each exposure and outcome, an HR and 95% CI per unit, an HR and 95% CI per SD, and a single P value. I assumed each interval is a Wald interval, symmetric on the log-HR scale, as Cox model output is. On that basis I recomputed P from each printed interval: SE = (ln U − ln L)/(2 × 1.96), z = ln HR / SE, P = 2[1 − Φ(|z|)]. I also worked the other way and rebuilt each per-SD interval from the HR and the printed P. To confirm that the table's rows and columns are aligned, I ran the same check on the other CVD rows and on the PPD rows for the other two outcomes. I repeated it for Table S4 in Additional file 1, the time-invariant sensitivity models. recompute.py.txt prints every number below.
| Quantity | Location | Reported | Recomputed from the paper's numbers |
|---|---|---|---|
| Mean PPD, CVD mortality, per SD | Table 2 | 1.078 (0.942; 1.233), P = 0.275 | CI includes 1; P = 0.274; CI rebuilt from P: 0.942–1.234 |
| Mean PPD, CVD mortality, per 1 mm | Table 2 | 1.111 (0.920; 1.341) | CI includes 1; P = 0.273 |
| Sites PPD ≥ 3 mm, CVD mortality, per SD | Table 2 | 1.096 (0.921; 1.305), P = 0.302 | CI includes 1; P = 0.303; CI rebuilt from P: 0.921–1.304 |
| Sites PPD ≥ 3 mm, CVD mortality, per 1 % | Table 2 | 1.004 (0.997; 1.011) | CI includes 1; P = 0.262 (anywhere from 0.174 to 0.359 within 3-decimal rounding of the HR and limits) |
| Sites PPD ≥ 4 mm, CVD mortality, per SD | Table 2 | 1.070 (0.932; 1.228), P = 0.337 | CI includes 1; P = 0.336; CI rebuilt from P: 0.932–1.228 |
| Sites PPD ≥ 4 mm, CVD mortality, per 1 % | Table 2 | 1.004 (0.996; 1.012) | CI includes 1; P = 0.326 (0.239–0.419 within rounding) |
| PPD measures significant for CVD mortality (P < 0.05) | Abstract vs Table 2 | Abstract: "all" (3 of 3) | 0 of 3 printed P; 0 of 6 recomputed P (both scalings); 0 of 6 CIs exclude 1 |
| One-sided P (printed P halved), the three PPD measures | derived | — | 0.138, 0.151, 0.169, all still > 0.05 |
| Control: mean CAL, CVD, per SD | Table 2 | 1.225 (1.042; 1.439), P = 0.014 | P = 0.014 |
| Control: missing teeth, CVD, per SD | Table 2 | 1.226 (1.025; 1.466), P = 0.026 | P = 0.026 |
| Control: periodontitis score, CVD, per SD | Table 2 | 1.399 (1.076; 1.820), P = 0.012 | P = 0.012 |
| Control: fibrinogen, CVD, per SD | Table 2 | 1.128 (0.981; 1.297), P = 0.090 | P = 0.091 |
| Control: sites CAL ≥ 3 mm, CVD, per SD | Table 2 | 1.288 (0.976; 1.702), P = 0.074 | P = 0.074 |
| Control: sites CAL ≥ 4 mm, CVD, per SD | Table 2 | 1.217 (1.002; 1.479), P = 0.047 | P = 0.048 |
| PPD measures, time-invariant models, CVD, per SD | Table S4 | 1.080 (0.927; 1.259) P = 0.321; 1.057 (0.883; 1.264) P = 0.547; 1.057 (0.917; 1.219) P = 0.444 | P = 0.324, 0.545, 0.445; 0 of 3 significant |
| PPD measures significant, other outcomes | Table 2 | all-cause P = 0.098, 0.025, 0.030; non-CVD P = 0.166, 0.030, 0.037 | 2 of 3 for each outcome; mean PPD not significant for either |
| PPD measures significant, other outcomes | Table S4 | all-cause P = 0.020, 0.031, 0.042; non-CVD P = 0.023, 0.018, 0.035 | 3 of 3 for each outcome |
| Mean PPD, all-cause mortality, per SD (abstract: "apparent association") | Abstract; Table 2 | 1.068 (0.988–1.155), P = 0.098 | CI includes 1; P = 0.099 |
Every recomputed P agrees with the printed P to within rounding, both for the PPD rows and for the control rows. The only exceptions are the per-unit rows for extent PPD, and those have little precision because the HR and its limits are printed to three decimals close to 1. The table is therefore internally consistent. What disagrees with it is the abstract sentence.
Figure
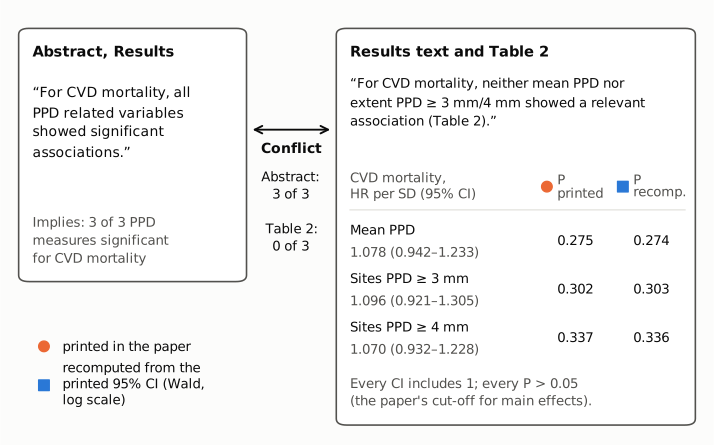
Figure 1. The left panel shows the abstract sentence on CVD mortality. The right panel shows the Results sentence and the three Table 2 rows it summarises, with the per-SD hazard ratio (95% CI), the P value printed in the paper (orange circle) and the P value recomputed from the printed interval (blue square). The connector names the conflict. The abstract implies 3 of 3 PPD measures are significant; the table has 0 of 3. All numbers are printed in the paper or by recompute.py.txt. The paper's own figures are not reproduced.
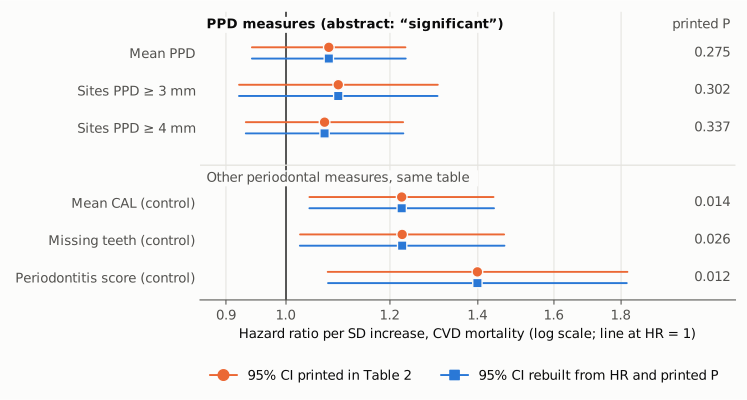
Figure 2. Hazard ratios per SD increase for CVD mortality from Table 2, on a log axis with a reference line at HR = 1. For each row, the orange interval is the 95% CI printed in the paper and the blue interval is the 95% CI rebuilt from the HR and the printed P. The printed P values are listed on the right. The two intervals coincide for every row, so the HR, CI and P columns are mutually consistent. All three PPD intervals cross 1. The three control rows from the same table (mean CAL, missing teeth, periodontitis score) do not, which shows that significant CVD associations in this table are reported as such.
Why it matters
Most readers see only the abstract, and in it this sentence is the only result given for a single exposure and CVD mortality. It tells them that every pocket-depth measure is significantly associated with cardiovascular death, but the paper's analysis finds no PPD measure significantly associated with CVD mortality as a main effect, in either the main models (Table 2) or the sensitivity models (Table S4). The difference matters for interpretation. The paper describes PPD as the measure that "best reflects current periodontal inflammation". In this paper, the CVD association is carried by markers of cumulative periodontal damage instead: mean CAL, extent CAL ≥ 4 mm, missing teeth and the periodontitis score. Someone relying on the abstract might cite this study as evidence that current periodontal inflammation, measured as pocket depth, predicts cardiovascular death, but the paper's main-effect analyses do not support that.
The error does not overturn the paper's other main results. The periodontitis score, mean CAL, missing teeth, leukocytes, CRP and the inflammation score are all significant for CVD mortality in Table 2. The additive-interaction (RERI) results are separate analyses and are not affected. Two related statements are broader than the table supports, though. First, the abstract lists mean PPD (P = 0.098) among markers with "apparent associations" with all-cause mortality. Second, both Conclusions say periodontitis and inflammation were significantly associated with CVD mortality, and that is not true for any PPD measure, for extent CAL ≥ 3 mm (P = 0.074) or for fibrinogen (P = 0.090).
Explanations considered
- Table 2 is wrong and the abstract is right. This does not fit. For every PPD row and every control row, the P values recomputed from the printed intervals match the printed P values. The Results text describes the same null result in words, and Table S4 shows it again in separately fitted time-invariant models on the same cohort. Three parts of the paper agree with one another and disagree with the abstract.
- Per-unit versus per-SD scaling. This is not the explanation. All six CVD intervals include 1, under both scalings.
- A different model (time-invariant exposures, competing risks). This is not the explanation. The Results say Table S4 "confirmed these results", and in Table S4 the CVD P values are 0.321, 0.547 and 0.444. The Methods mention competing-risk models (subdistribution hazards) for CVD mortality, but neither the paper nor Additional file 1 reports their results. No reported model makes PPD significant for CVD mortality as a main effect.
- One-sided testing or the 0.10 threshold. This is not the explanation. The Methods set 0.05 as the cut-off for main effects (and describe P values as two-sided for interaction terms). If the printed main-effect P values are two-sided, halving them for a one-sided test gives 0.138–0.169, still above 0.05. The 0.10 threshold applies only to interaction terms, and the main-effect P values (0.275–0.337) are above it anyway.
- The sentence refers to interaction terms. Under this reading the sentence could be defended. Table S5 in Additional file 1 flags, by symbol, multiplicative interactions significant at P < 0.10 for CVD mortality (the paper's threshold for interaction terms). At least one is flagged for every PPD measure: mean PPD with fibrinogen, CRP and the inflammation score; sites PPD ≥ 3 mm with fibrinogen; and sites PPD ≥ 4 mm with fibrinogen, CRP and the inflammation score. The placement and wording point to a main-effect reading, though. The sentence follows directly after the list of main-effect HRs per SD increase for all-cause mortality. It speaks of "PPD related variables" having "associations" and names no interaction or inflammation marker. The next sentence, "Interaction modelling revealed some variation with respect to mortality type and exposure combinations", is where the abstract turns to interactions. As printed, the sentence reads as a main-effect claim, which Table 2 and Table S4 contradict. At best it is ambiguous. The suggested correction below removes the ambiguity under either reading.
- The sentence describes another outcome column. I checked this. In Table 2, two of the three PPD measures are significant for all-cause mortality and two of three for non-CVD mortality (mean PPD is not, P = 0.098 and 0.166). In Table S4, all three are significant for all-cause and for non-CVD mortality. So "all PPD related variables showed significant associations" matches the non-CVD and all-cause columns of Table S4, not any column of the main Table 2. The paper does not say which outcome or model the sentence was meant to describe. As printed, it names CVD mortality, and for CVD mortality it is contradicted by both tables.
- Conversion or typesetting artefact. This is ruled out. The publisher's HTML abstract and Table 2 page, the PMC text and the Europe PMC full-text XML all carry the same sentence and the same cell values.
Status
As of 2026-10-23:
- Version of record. The publisher's article page (link.springer.com, which doi.org and bmcmedicine.biomedcentral.com both redirect to) sits behind a JavaScript challenge, so it was loaded in headless Chromium. It shows the same abstract sentence and the same Results sentence. Its Table 2 page has CVD-mortality cells identical to the PMC copy. The Europe PMC full-text XML and the PMC web page agree. The publisher PDF could not be retrieved (both the Springer and the Europe PMC PDF links returned a challenge page). Every quotation above was checked verbatim against the PMC-archived text.
- Supplement. The single supplementary file, Additional file 1 (12916_2023_3139_MOESM1_ESM.docx), was downloaded from the publisher's static-content server and its Table S4 read. Table S4 agrees with Table 2 that no PPD measure is significant for CVD mortality as a main effect (values in the table above), so it does not resolve the discrepancy. Its Table S5 was also read. It prints RERI values for CVD mortality and uses symbols to flag PPD × inflammation multiplicative interactions for CVD mortality as significant at P < 0.10, for each of the three PPD measures with at least one inflammation marker (see "Explanations considered"). The main text, Results, "Interaction between periodontitis and systemic inflammation", gives two such interactions for CVD mortality, "extent PPD and fibrinogen: HR = 1.147, P = 0.006; extent PPD and inflammation score: HR = 1.134, P = 0.042", and says that these HRs "ranged from 1.12 to 1.18". It does not say whether "extent PPD" there means ≥ 3 mm or ≥ 4 mm. These interaction results are the only PPD-related CVD results that the paper reports as significant.
- Corrections. One correction exists: doi:10.1186/s12916-025-03862-0 (BMC Med 2025, PMC11734466, dated 15 January 2025), found through Crossref update metadata and Europe PMC notices. Its full text adds a funding source that was "mistakenly omitted" and says nothing about the abstract or Table 2. The publisher's page still carries the abstract sentence, and the correction notice is shown on it. No retraction or expression of concern was found.
- PubPeer. The PubPeer search page and API refused automated access (a Cloudflare challenge, HTTP 403), including from headless Chromium. A web search for the title together with "PubPeer" turned up no PubPeer thread, only the article, the correction and repository copies. That there is no PubPeer thread is likely but not confirmed.
- Sources. PMC10642059 (article), PMC11734466 (correction), https://link.springer.com/article/10.1186/s12916-023-03139-4 (version of record), Additional file 1 (12916_2023_3139_MOESM1_ESM.docx).
Suggested correction
In the Abstract, Results, replace "For CVD mortality, all PPD related variables showed significant associations." with a sentence consistent with Table 2 and the Results text. For example: "For CVD mortality, none of the PPD-related variables showed a significant association (HRs per SD increase: mean PPD 1.078 (95% CI 0.942–1.233); extent PPD ≥ 3 mm 1.096 (0.921–1.305); extent PPD ≥ 4 mm 1.070 (0.932–1.228)), whereas mean CAL, extent CAL ≥ 4 mm, missing teeth, the periodontitis score and the inflammation markers other than fibrinogen did." The authors may also wish to review three related statements. First, the description of mean PPD (P = 0.098) as showing an "apparent association" with all-cause mortality. Second and third, the two Conclusions that periodontitis was significantly associated with CVD mortality, which hold for mean CAL, extent CAL ≥ 4 mm, missing teeth and the periodontitis score but not for the PPD measures (or for extent CAL ≥ 3 mm, P = 0.074).