← Back to the plain-language case
Abstract reports p<0.001 for the matched cystic fibrosis versus rheumatoid arthritis comparison; Table 4 gives p=0.055
Eur Respir J (2023) · doi:10.1183/13993003.00174-2023 · PMC10600351
Summary
The abstract reports the propensity-matched comparison of major adverse cardiac events (MACE) between people with cystic fibrosis (CF) and people with rheumatoid arthritis (RA) as HR 1.21 (95% CI 1.00–1.48) with p<0.001. Table 4 gives the same HR and CI for this comparison, with p=0.055. Back-calculating from the printed HR and CI gives p = 0.057, or 0.047–0.068 if the rounded values vary within their rounding ranges. That agrees with Table 4 and rules out p<0.001, which would need a CI of about 1.08–1.36. The only p<0.001 in the RA row of Table 4 belongs to the unadjusted analysis (HR 0.75), so the abstract presents a borderline, non-significant comparison as highly significant. The Results and Discussion also describe CF risk as "greater than" RA risk. The paper's main finding, a higher MACE risk in CF than in matched general-population comparators (HR 1.65, p<0.001), is not affected.
What the paper reports
Abstract, Results:
In propensity score-matched analyses, PwCF had higher risk of MACE than matched general population comparators (hazard ratio (HR) 1.65, 95% CI 1.40–1.95; p<0.001) and an equivalent or higher relative risk compared with other inflammatory conditions considered “high risk” for cardiovascular disease, including systemic lupus erythematosus (HR 0.95, 95% CI 0.82–1.09; p=0.44), rheumatoid arthritis (HR 1.21, 95% CI 1.00–1.48; p<0.001) and HIV (HR 0.93, 95% CI 0.82–1.06; p=0.29).
Table 4, "Rheumatoid arthritis" row. The columns are: unadjusted analysis (CF | events | non-CF | events | HR (95% CI) | p-value), then propensity score-matched analysis (the same six columns):
Rheumatoid arthritis | 6265 | 227 | 97 198 | 4547 | 0.75 (0.66–0.86) | <0.001 | 5901 | 223 | 5901 | 177 | 1.21 (1.00–1.48) | 0.055
Table 4 footer:
Propensity score matching based on known cardiac risk factors (age, sex, diabetes, hypertension, hypercholesterolaemia, family history of heart disease, smoking and chronic kidney disease).
Methods, "Statistical analysis":
After propensity score matching, a Cox's proportional hazards model was used to compare the matched cohorts.
Results, "Outcomes compared with other inflammatory diseases":
In CF, risk of MACE was equivalent to SLE and HIV (HR 0.95, 95% CI 0.82–1.09; p=0.44; and HR 0.93, 95% CI 0.82–1.06; p=0.29, respectively) and was greater than rheumatoid arthritis (HR 1.21, 95% CI 1.00–1.48).
Discussion, first paragraph:
Furthermore, cardiac risk in PwCF was equivalent to or higher than other chronic inflammatory diseases considered “high risk” for cardiac disease.
Discussion, fifth paragraph (the paragraph beginning "Chronic inflammation is a hallmark of CF"):
Here, we found that despite adjusting for the presence of classic cardiac risk factors, risk of cardiac disease in CF was equivalent to or greater than that of other inflammatory conditions.
What the paper's own numbers show
Method. Hazard ratios from a Cox model are normally reported with a Wald 95% CI on the log scale. For such a CI, SE(log HR) = (ln upper − ln lower) / (2 × 1.96), z = ln HR / SE, and the two-sided p = 2(1 − Φ(|z|)). This cannot reproduce the exact Cox p-value without the individual event times, but it is the standard check that a printed HR, CI and p-value are consistent. I applied it to the four matched comparisons the abstract reports. To allow for rounding, I also varied the RA HR and both bounds over every value that rounds to the printed two decimals. Every number below is printed by recompute.py.txt.
| Quantity | Location | Reported | Recomputed from the paper's numbers |
|---|---|---|---|
| CF vs RA, matched: p-value | Abstract, Results | HR 1.21 (1.00–1.48); p<0.001 | SE(log HR) 0.100, z = 1.91, p = 0.057 |
| CF vs RA, matched: p-value | Table 4 | HR 1.21 (1.00–1.48); p = 0.055 | p = 0.057 (agrees) |
| CF vs RA, matched: p over rounding of HR and CI | Table 4 / Abstract | — | 0.047–0.068 |
| CF vs RA, matched: HR against CI midpoint | Table 4 / Abstract | 1.21 | geometric midpoint √(1.00 × 1.48) = 1.217 (consistent) |
| CF vs RA, matched: what p<0.001 would need | — | — | |z| > 3.29, SE ≤ 0.058, so a 95% CI no wider than 1.08–1.36 |
| CF vs RA, matched: one-sided p | — | — | 0.028 |
| CF vs RA, unadjusted | Table 4 | HR 0.75 (0.66–0.86); p<0.001 | z = −4.26, p = 2.0 × 10⁻⁵ (agrees); the only p<0.001 in the RA row |
| CF vs RA, matched: crude event counts | Table 4 | CF 223/5901 vs RA 177/5901 | 3.78% vs 3.00%; crude risk ratio 1.26 (1.04–1.53), p = 0.020 (ignores time to event and censoring, so it does not replace the Cox p) |
| CF vs SLE, matched (cross-check) | Abstract / Table 4 | HR 0.95 (0.82–1.09); p = 0.44 / 0.439 | p = 0.48 (rough agreement, within rounding of the CI) |
| CF vs HIV, matched (cross-check) | Abstract / Table 4 | HR 0.93 (0.82–1.06); p = 0.29 / 0.293 | p = 0.27 (rough agreement) |
| CF vs general population, matched (cross-check) | Abstract / Table 3 | HR 1.65 (1.40–1.95); p<0.001 | z = 5.92, p = 3 × 10⁻⁹ (agrees) |
The same back-calculation agrees with the printed p-values for the other three matched comparisons. For RA it agrees with Table 4 but not with the abstract. A CI whose lower bound is 1.00 is by construction close to p = 0.05, and a two-sided p<0.001 would require the lower bound to be at least about 1.08.
Figure
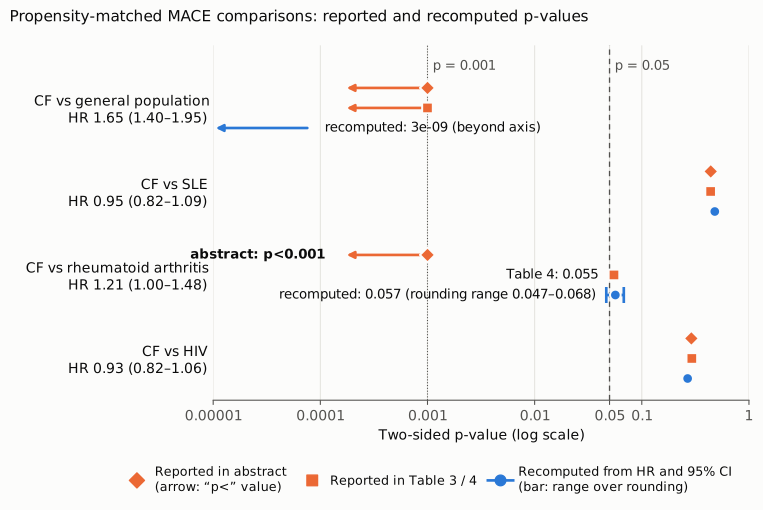
Figure 1. P-values for the four propensity-matched MACE comparisons named in the abstract, on one log-scale axis. Orange diamonds are the values printed in the abstract and orange squares the values printed in Table 3 (general population) or Table 4 (SLE, RA, HIV). A left-pointing arrow marks a value printed as "p<". Blue circles are the p-values recomputed from the printed HR and 95% CI. For RA, the blue bar spans the p-values obtained when the HR and both CI bounds vary within their rounding ranges (0.047–0.068). The dashed line marks p = 0.05 and the dotted line p = 0.001. For the general population, SLE and HIV the three values agree. For RA, Table 4 and the recomputed value sit on the 0.05 line, while the abstract places the result beyond 0.001. The recomputed general-population p (3 × 10⁻⁹) lies beyond the left edge of the axis.
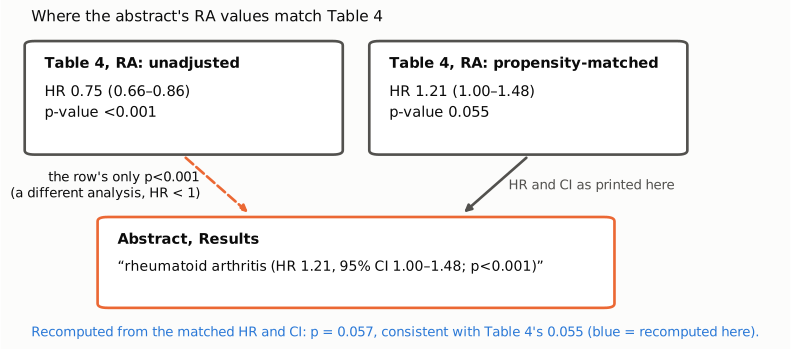
Figure 2. Where the abstract's RA values occur in Table 4. The abstract's HR and CI (1.21, 1.00–1.48) are those of the propensity-matched columns, whose p-value is 0.055. The only p<0.001 in the RA row is in the unadjusted columns, for an HR of 0.75 (0.66–0.86) that points the other way. The figure shows where the printed values coincide. It does not show how the abstract's value arose.
Why it matters
- The abstract misstates the significance of a highlighted comparison. The abstract lists RA among the inflammatory conditions against which CF has "an equivalent or higher relative risk", and gives p<0.001 for it. The paper's own table, and the HR and CI themselves, put this comparison at p ≈ 0.055–0.057, just above the conventional 0.05 threshold. Readers who see only the abstract, or who index it, will take the RA comparison as strong evidence of excess risk in CF.
- The "greater than" claims rest on this comparison alone. The Results say CF risk "was greater than rheumatoid arthritis". The first and fifth Discussion paragraphs say CF risk was "equivalent to or higher than" or "equivalent to or greater than" that of other inflammatory conditions. SLE and HIV are both described as equivalent (p = 0.44 and 0.29), so the "higher" or "greater" part depends only on RA. With a CI whose lower bound is 1.00 and p = 0.055, the data are compatible with no difference, so "greater than" is not established at the 0.05 level. The point estimate still favours higher risk in CF.
- What is not affected. The comparison with matched general-population comparators (HR 1.65, 1.40–1.95, p<0.001), the SLE and HIV comparisons, the UK CF Registry risk-factor analyses, and the abstract's conclusion that "PwCF are at increased risk of adverse cardiac disease events" do not depend on this p-value. The argument in the Discussion that risk tools such as QRISK may need CF-specific adjustment, as they have for SLE, RA and HIV, holds equally well if CF risk is similar to RA risk.
Explanations considered
- A different analysis. Table 4 does contain a p<0.001 for RA, but in the unadjusted columns, with HR 0.75 (0.66–0.86). That HR points the other way (lower MACE risk in CF than in RA). The abstract pairs a p<0.001 with the matched HR and CI. The coincidence is shown in Figure 2. It would explain how the two values came to differ but would not make the abstract's p-value correct for the matched comparison it is attached to.
- Rounding. Letting the HR and both CI bounds take any value that rounds to 1.21, 1.00 and 1.48 gives p between 0.047 and 0.068. That is nowhere near 0.001, and the table's three-decimal p of 0.055 sits inside this range. Rounding does not account for the discrepancy.
- A one-sided test. The Methods mention no one-sided tests. A one-sided p from the same HR and CI would be 0.028, still not <0.001.
- Another model or population. The Methods describe a single approach: 1:1 propensity matching followed by a Cox proportional hazards model on the matched cohorts. The Table 4 footer lists the matching covariates and mentions no other model. Supplementary Table S4 (CF vs RA) gives the same matched MACE result, HR 1.21 (1.00–1.48), p = 0.055. No other analysis in the paper or supplement reports the matched RA comparison with p<0.001.
- Crude counts. Comparing 223/5901 with 177/5901 events without time to event gives p = 0.020. That is not <0.001 either, and it is not the analysis the paper reports.
- Conversion artifact. The publisher-typeset one-page summary PDF in the supplementary bundle and the Europe PMC full-text XML print the same abstract p<0.001 and the same Table 4 p = 0.055. The discrepancy is in the published article, not an artifact of the PMC conversion.
- A later correction. None was found (see Status).
None of these accounts for p<0.001. The Table 4 value of 0.055 agrees with the recomputation, so the abstract's value is the one in error.
A side observation, not part of this finding: the Table 4 SLE matched row lists the CF group as n = 223 with 385 events and the comparator as n = 5223. The Results text states that 5223 PwCF were matched with SLE comparators, so the "223" looks like a dropped digit. This was not examined further.
Status
As of 2026-10-23:
- Version of record. The publisher's pages (publications.ersnet.org, erj.ersjournals.com) returned HTTP 403 to automated access. The publisher-typeset one-page summary PDF (ERJ-00174-2023.Shareable.pdf, from the Europe PMC supplementary bundle) prints the same abstract text, "rheumatoid arthritis (HR 1.21, 95% CI 1.00–1.48; p<0.001)". The Europe PMC JATS XML and the live PMC page carry the same abstract and the same Table 4 matched RA p-value of 0.055.
- Supplement. ERJ-00174-2023.Supplement.pdf (17 pages). Supplementary Table S4 (CF vs RA) gives the matched MACE row as CF 5901 / 223 events vs RA 5901 / 177 events, HR 1.21 (1.00–1.48), p 0.055, and the unadjusted row as HR 0.75 (0.66–0.86), p<0.001. The supplement agrees with Table 4 and does not resolve the discrepancy.
- Corrections. Crossref lists no update-to or updated-by relations for the DOI. PMC and Europe PMC list no correction, erratum, retraction or expression of concern, and a Europe PMC search for errata returned none. The only linked item is an editorial, "Cystic fibrosis and the cardiovascular system: the unexpected heartache" (doi:10.1183/13993003.01253-2023; PMID 37884293), which is commentary rather than a correction.
- PubPeer and other commentary. PubPeer blocked automated access (403 and a Cloudflare challenge). A web search found no PubPeer thread or Retraction Watch entry for this article.
- Sources. The article as archived in PMC (PMC10600351: abstract, Methods, Results, Tables 3 and 4, Discussion); the Europe PMC full-text XML and supplementary files; Crossref, PMC and Europe PMC notice records for doi:10.1183/13993003.00174-2023.
Suggested correction
In the Abstract, Results, replace "rheumatoid arthritis (HR 1.21, 95% CI 1.00–1.48; p<0.001)" with "rheumatoid arthritis (HR 1.21, 95% CI 1.00–1.48; p=0.055)", in line with Table 4 and Supplementary Table S4.
Because this comparison does not reach p<0.05, the authors may also wish to revise the wording that reads it as an established difference. In the Results, "and was greater than rheumatoid arthritis (HR 1.21, 95% CI 1.00–1.48)" could read "and was numerically higher than, but not significantly different from, rheumatoid arthritis (HR 1.21, 95% CI 1.00–1.48; p=0.055)". The phrases "equivalent or higher" (Abstract), "equivalent to or higher than" (Discussion, first paragraph) and "equivalent to or greater than" (Discussion, fifth paragraph) could be qualified in the same way.