← Back to the plain-language case
Diabetes-only hyperglycemia primary outcome has denominators larger than the trial's possible diabetic population
JAMA Network Open (2023) · doi:10.1001/jamanetworkopen.2023.32517 · PMC10517374
Summary
This pilot randomized trial (ACTFAST-3) defines one of its two primary outcomes, avoidance of postoperative hyperglycemia, for patients with diabetes only, and states that "patients without diabetes were excluded from analysis". Yet the reported denominators (8676 intervention, 8815 control) exceed the most cases with diabetes that the paper's own Table 1 allows (5713 and 5887, even counting every case of unknown status as diabetic), and they equal exactly the analyzed cases with any glucose value in the Figure 1 flowchart. The published result (85.8% vs 85.8%; RR 1.00, 95% CI 0.99–1.01) therefore describes a population in which at least a third of cases, and probably about two-thirds, did not have diabetes. Its narrow confidence interval, which the Discussion describes as "tight confidence bounds", depends on that larger denominator, and simple calculations suggest an interval for the stated population would be roughly 2 to 3.5 times as wide.
What the paper reports
Methods, "Study Population":
For glycemic outcomes, patients without diabetes were excluded from analysis.
Methods, "Outcomes":
The primary outcomes were avoidance of hypothermia, defined as the proportion of patients who had a final recorded intraoperative core temperature greater than 36 °C, and avoidance of hyperglycemia, defined as the proportion of patients with diabetes who had a blood glucose level of 180 mg/dL or lower on arrival to the postanesthesia recovery area.
Abstract, "Main Outcomes and Measures":
(defined as the proportion of patients with diabetes who had a blood glucose level ≤180 mg/dL on arrival to the postanesthesia recovery area)
Abstract, "Results". The Results text (primary outcomes paragraph) repeats the same counts, percentages and RR:
There was no treatment effect on avoidance of hyperglycemia (7445 of 8676 patients [85.8%] in the intervention group vs 7559 of 8815 [85.8%] in the control group; rate ratio [RR], 1.00; 95% CI, 0.99-1.01)
Table 2, primary outcome row (columns: intervention, n = 12 980 | control, n = 13 274 | coefficient (95% CI) | P value):
No postoperative hyperglycemia | 7445/8676 (85.8) | 7559/8815 (85.8) | 1.00 (0.99 to 1.01) | >.99
Table 1, comorbidity row. Table 1 lists the control column first (control, n = 13 274 | intervention, n = 12 980):
Diabetes | 2909/10 296 (28.3) | 2824/10 091 (28.0)
Figure 1, the study flowchart. The flowchart is an image, so this text was read from the publisher's image file (jamanetwopen-e2332517-g001.jpg) rather than from a text conversion:
12980 Analyzed (1581 without temperature data, 4304 without glucose data)
13274 Analyzed (1652 without temperature data, 4459 without glucose data)
Figure 1 caption:
The analysis included all patients randomized during the study with outcomes present.
The findings and conclusions that rest on this outcome. Key Points, "Findings":
an intraoperative telemedicine decision support intervention did not significantly reduce postoperative hypothermia or hyperglycemia
Abstract, "Conclusions and Relevance":
anesthesia care quality measures did not differ between groups, with high confidence in the findings
Discussion, second paragraph:
There are several potential reasons for the lack of an intention-to-treat effect with tight confidence bounds on these quality of care outcomes.
Discussion, third paragraph:
Second, the overall adherence to each measure at baseline was high, making statistically significant improvements difficult to achieve.
What the paper's own numbers show
Method. Table 1, Table 2 and Figure 1 count cases in the same unit and with the same arm totals (12 980 and 13 274). For each arm I took the cases with diabetes from Table 1. I counted cases with unknown diabetes status as the arm total minus the Table 1 denominator. The sum of the two is an upper bound on the number of cases that could have diabetes. I compared that bound with the Table 2 hyperglycemia denominator, and compared the denominator with Figure 1's analyzed cases minus cases "without glucose data". I repeated the check for the two sensitivity analyses in Supplement 2 (eTables 4–7). Those tables print diabetes only as n (%), so there the bound uses the smallest known-status total consistent with the rounded percentage. For contrast I looked at the secondary outcome that is explicitly limited to patients with diabetes. Finally I checked the Table 2 arithmetic with crude, unclustered rate ratios. Every number below is printed by recompute.py.txt.
| Quantity | Location | Reported | Recomputed from the paper's numbers |
|---|---|---|---|
| Cases with diabetes, intervention | Table 1 | 2824/10 091 (28.0) | 28.0%; 12 980 − 10 091 = 2889 with unknown status |
| Cases with diabetes, control | Table 1 | 2909/10 296 (28.3) | 28.3%; 13 274 − 10 296 = 2978 with unknown status |
| Most cases that could have diabetes, intervention | Table 1 | — | 2824 + 2889 = 5713 |
| Most cases that could have diabetes, control | Table 1 | — | 2909 + 2978 = 5887 |
| Hyperglycemia denominator, intervention | Table 2; Abstract; Results | 8676 | 2963 more than the 5713 maximum; 3.07 × the documented diabetic cases |
| Hyperglycemia denominator, control | Table 2; Abstract; Results | 8815 | 2928 more than the 5887 maximum; 3.03 × the documented diabetic cases |
| Analyzed cases with glucose data, intervention | Figure 1 | 12 980 analyzed, 4304 without glucose data | 12 980 − 4304 = 8676, identical to the denominator |
| Analyzed cases with glucose data, control | Figure 1 | 13 274 analyzed, 4459 without glucose data | 13 274 − 4459 = 8815, identical to the denominator |
| Denominator as a share of all analyzed cases | Table 2 vs Figure 1 | — | 66.8% and 66.4%, against a diabetes prevalence of 28.0% and 28.3% |
| Share of the denominator that cannot have diabetes | derived | — | at least 34.2% (intervention) and 33.2% (control); 67.5% and 67.0% if only documented diabetes is counted |
| Sensitivity analysis, excluding repeat surgeries within 30 days | eTables 4–5 | denominators 8069 / 8169; diabetes 2614 (27.6%) / 2667 (27.6%) of 12 179 / 12 457 | most possible diabetic cases ≤ 5339 / 5478; denominators exceed this by 2730 / 2691 |
| Sensitivity analysis, ignoring prior assignment | eTables 6–7 | denominators 8693 / 8798; diabetes 2844 (28.2%) / 2889 (28.0%) of 12 965 / 13 289 | most possible diabetic cases ≤ 5741 / 5878; denominators exceed this by 2952 / 2920 |
| Diabetes-restricted secondary outcome (intraoperative glucose measurement), for contrast | Table 2 | denominators 1962 / 1996 | 69.5% and 68.6% of the documented diabetic cases, so this outcome does fit inside the diabetic population |
| No postoperative hyperglycemia, % and RR | Table 2 | 85.8 vs 85.8; RR 1.00 (0.99 to 1.01) | 85.81% vs 85.75%; crude RR 1.001 (unclustered 95% CI 0.989–1.013), consistent with the printed values for the printed denominators |
The Table 2 arithmetic is internally consistent. The problem is the population. The denominators equal every analyzed case with a glucose value, not the cases with diabetes. The same pattern appears in all three published versions of the analysis (the main analysis and both sensitivity analyses; Figure 2 below), so it is not a single transcription slip.
The comparison also turned up some smaller, separate inconsistencies. None of them changes a conclusion:
| Quantity | Location | Reported | Recomputed |
|---|---|---|---|
| Arm sizes | Abstract vs Methods, Table 1, Table 2, Figure 1 | Abstract: "control group; n = 12 980" and "intervention group; n = 13 274" | Every other location gives intervention 12 980 and control 13 274, so the abstract's labels are swapped |
| Hypothermia denominators | Table 2 vs Figure 1 | 11 447 / 11 672 | 12 980 − 1581 = 11 399 and 13 274 − 1652 = 11 622, which differ by 48 and 50 |
| Intraoperative glucose measurement, intervention % | Table 2 | 1346/1962 (68.7) | 68.60%, which rounds to 68.6 |
| Control hypothermia % | Abstract | "[66.7.%]" | typographical (66.7%) |
Figure
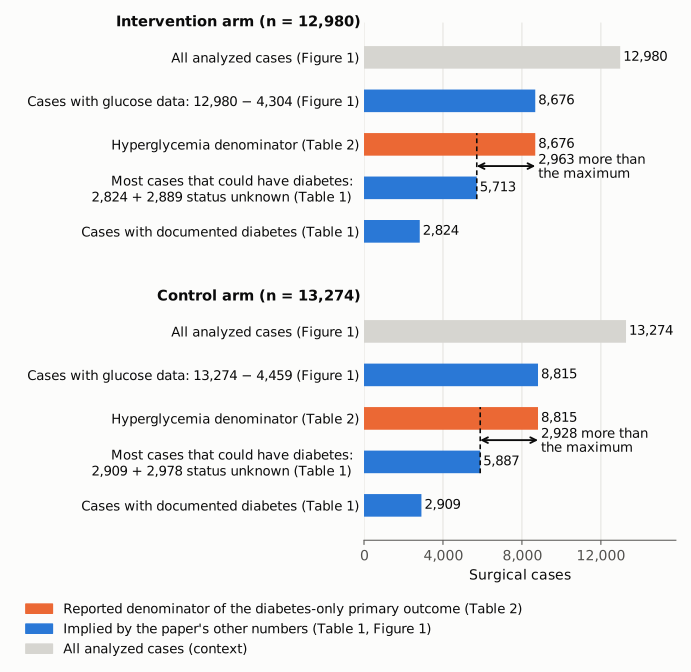
Figure 1. Counts for each arm on one axis of surgical cases, drawn from zero. The orange bar is the reported denominator of the hyperglycemia primary outcome (Table 2), which the paper defines for patients with diabetes only. The blue bars come from the paper's other numbers: the cases with documented diabetes (Table 1); the most cases that could have diabetes if every case with unknown status had it (Table 1); and the analyzed cases with any glucose value (Figure 1: analyzed minus "without glucose data"). The gray bar is all analyzed cases. In both arms the reported denominator exceeds the largest possible diabetic population, by 2963 and 2928 cases, and equals the number of cases with glucose data exactly.
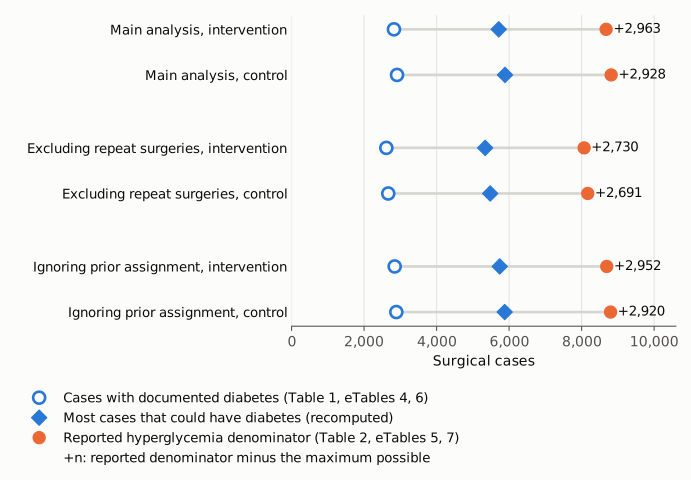
Figure 2. The same comparison for the main analysis (Tables 1–2) and the two sensitivity analyses in Supplement 2 (eTables 4–5, excluding surgeries within 30 days of an index operation; eTables 6–7, ignoring prior treatment assignment). Hollow blue circles are cases with documented diabetes as printed. Blue diamonds are the most cases that could have diabetes; for the sensitivity analyses this is an upper bound derived from the rounded percentage. Orange circles are the reported hyperglycemia denominators. The number on each row is the reported denominator minus that maximum. In all six arm-analyses the denominator lies about 2700–3000 cases above the largest possible diabetic population.
Why it matters
Avoidance of hyperglycemia is one of the trial's two primary outcomes. Its null result is reported in the Key Points, the Abstract, the Results, Table 2 and eTables 5 and 7. The paper's stated population for it is patients with diabetes, and the published protocol that the paper cites for its sample size (reference 22, F1000Research 2018;7:623) planned it that way: its power calculation states that "we assumed that the prevalence of diabetes mellitus among Barnes-Jewish Hospital surgical patients is about 20%", and its sample-size table plans glucose clusters about a quarter the size of the temperature clusters (59 vs 239 cases, a ratio of 0.247). The reported denominators are instead about two-thirds of all analyzed cases (0.668 and 0.664).
Three consequences follow from the published numbers alone.
- The estimate does not describe the stated population. At least 34% of each denominator cannot have diabetes, and about 67% did not if only documented diabetes is counted. Glucose above 180 mg/dL on arrival in recovery is presumably much less common in patients without diabetes. Including them raises the avoidance rate (85.8%) and, if their rates are similar between arms, pulls any between-arm ratio toward 1. The diabetes-only rates and RR cannot be recovered from the published tables.
- The "tight confidence bounds" depend on the larger denominator. With the reported denominators, the crude unclustered 95% CI for the RR is 0.989–1.013, which reproduces the published 0.99–1.01. Two illustrations show the scale of the change; neither is an estimate of the true result. (a) With denominators the size of the documented diabetic population (2824 and 2909) and no difference between arms, the same calculation gives 0.979–1.021 at an 85.8% avoidance rate and 0.959–1.043 at 60%, about 1.7 to 3.5 times as wide. (b) If the cases without diabetes had the same avoidance rate q in both arms and every documented diabetic case were in the denominator, the implied diabetes-only avoidance would be 77.1% vs 77.1% at q = 0.90 and 58.5% vs 58.9% at q = 0.99. The RR would stay between 0.994 and 1.000, with unclustered 95% CIs from 0.972–1.029 to 0.951–1.038, 2.3 to 3.6 times as wide. All of these come before the clustering and Bonferroni-corrected α that the paper applies to its CIs, which widen them further.
- The explanation offered for the null result is affected. The Discussion attributes the null results partly to high baseline adherence. For this outcome, the 85.8% baseline describes the mixed population and has not been shown for patients with diabetes; in the scenario above it would be closer to 59–77%.
The trial's other primary outcome, hypothermia, does not depend on this issue. Most secondary outcomes are null and, apart from those limited to diabetes, are not affected either. The scenario in point 2 suggests the null result for hyperglycemia may well survive a correct analysis, but with a substantially wider interval. As published, the hyperglycemia result cannot be read as a finding about patients with diabetes, and the "high confidence" statement in the Abstract rests partly on it.
Explanations considered
- Diabetes is under-ascertained in Table 1 because of missing status. This does not account for the numbers. The bound already counts all 2889 and 2978 cases with unknown status as diabetic, and the denominators still exceed it by about 2950 per arm.
- The tables use different units (cases vs patients). This does not account for the numbers. Table 1, Table 2 and Figure 1 all use the same totals (12 980 and 13 274), and the sensitivity analysis that keeps only one operation per 30-day window shows the same excess.
- The outcome used a broader definition of diabetes than Table 1. This is not plausible. The denominators would require two-thirds of all surgical cases to have diabetes, against 28% in Table 1 and the roughly 20% the protocol assumed.
- Figure 1's "without glucose data" counts already exclude cases without diabetes. This does not account for the numbers. If they did, the 8676 and 8815 cases with glucose data would all have diabetes, which contradicts Table 1's maximum of 5713 and 5887.
- A transcription or typesetting error in Table 2. This is unlikely. The same plain integers appear in the Abstract, the Results text and Table 2, they match the flowchart arithmetic exactly, and the two separately computed sensitivity analyses show the same excess. The publisher's page carries the same values as the PMC archive, so a conversion artifact is excluded.
- The analysis followed the registered definition, and the text is what is wrong. This is possible, and it would account for the numbers. ClinicalTrials.gov (NCT02830126, last update posted 2020-01-22) registers the outcome as "Proportion of cases with blood glucose <=180 mg/dL upon arrival to the anesthesia recovery area", with no diabetes restriction. The protocol's outcome table (F1000Research 2018;7:623, Table 1) is worded similarly ("Proportion of cases with blood glucose ≥180 mg/dl upon arrival to the post-anesthesia recovery area"). Its power calculation, however, is framed around patients with diabetes, as quoted above. If every case with a glucose value was meant to be analyzed, then the Abstract and Methods misdescribe the outcome population, the sentence "patients without diabetes were excluded from analysis" is incorrect for this outcome, and the departure from the protocol's diabetic framing is not reported. Either way, the paper's stated population and its reported numbers cannot both be right, and the published material does not show which one is in error.
- Glucose is routinely measured in patients without diabetes. This is consistent with the numbers and would explain how two-thirds of all cases came to have a glucose value. It does not reconcile that set with the stated restriction.
Status
- Version of record. The publisher's full text (jamanetwork.com, article 2809789, reached from the DOI) shows the same Study Population sentence, the same Table 1 diabetes row (2909/10 296 and 2824/10 091) and the same Table 2 hyperglycemia row (7445/8676, 7559/8815; 1.00, 0.99 to 1.01) as the PMC archive. I also checked the Europe PMC full-text XML and the publisher's Figure 1 image. Every quote above was confirmed verbatim against the PMC-archived text, except the Figure 1 flowchart text, which was read from the image.
- Supplements. I opened and text-extracted all four supplements from the Europe PMC supplementary-files bundle. Supplement 1 is the trial protocol; it does not define the glycemic primary outcome numerically. Supplement 2 holds eTable 1 (outcome definitions, which cover the secondary and clinical outcomes but not the two primary outcomes) and the sensitivity analyses in eTables 4–7, used above. Supplements 3 (nonauthor collaborators) and 4 (data sharing statement) are not relevant.
- Protocol and registry. I checked the published protocol (reference 22 cites version 1, doi:10.12688/f1000research.14897.1; I read version 2 as archived in PMC, PMC6039946) and the ClinicalTrials.gov record NCT02830126 through its API.
- Corrections and comments. As of 2026-10-23 I found no correction, erratum, retraction or expression of concern. Crossref lists no update relations for the DOI, and PMC and Europe PMC list no correction or comment links (PMID 37738052). The publisher's page shows no correction notice and no reader comments. The PubPeer API returned no feedback for the DOI; the PubPeer search page itself refused automated access (HTTP 403). A general web search could not be run in this session.
- Sources. PMC article PMC10517374; publisher page https://jamanetwork.com/journals/jamanetworkopen/fullarticle/2809789; Supplement 2 (jamanetwopen-e2332517-s002.pdf); Figure 1 image (jamanetwopen-e2332517-g001.jpg); F1000Research protocol (PMC6039946); ClinicalTrials.gov NCT02830126; Crossref; Europe PMC; PubPeer.
Suggested correction
- Re-run the hyperglycemia primary outcome restricted to cases with diabetes, as the Methods state, and report the numerators, denominators, RR, Bonferroni-adjusted CI and Holm-adjusted P value. Update the Abstract, Key Points, Results text, Table 2, eTables 5 and 7, and Figure 2 if it uses the same population. Also report how many cases with diabetes had no glucose value.
- Alternatively, if the intended population was all cases with a postoperative glucose value, as in the registry wording, revise the outcome definition in the Abstract and Methods. Remove or qualify the sentence "For glycemic outcomes, patients without diabetes were excluded from analysis", report the change from the protocol's diabetic framing, and give the diabetes-only result as a secondary analysis.
- In either case, revisit the "high confidence" and "tight confidence bounds" statements as they apply to hyperglycemia.
- Minor: correct the swapped arm sizes in the Abstract; explain why the hypothermia denominators (11 447 / 11 672) differ from Figure 1 (11 399 / 11 622); change 68.7 to 68.6 for 1346/1962 if it is a crude proportion; and fix "[66.7.%]".