← Back to the plain-language case
Abstract reverses the direction of both age effects on cortical thickness reported in Table 3
Brain (2023) · doi:10.1093/brain/awad100 · PMC10473572
Summary
In its brain-resilience results, the abstract says that "older age was associated with higher baseline cortical thickness and slower rate of cortical thinning independent of tau". The paper's own Table 3 reports a negative age coefficient on AD-signature cortical thickness (standardized β = −0.49, 95% CI −0.613 to −0.366, P < 0.001) and a negative Time × Age coefficient (standardized β = −0.051, 95% CI −0.083 to −0.020, P = 0.002). Both mean that older age goes with thinner cortex and faster thinning. The Results, both relevant Discussion passages and Supplementary Table 5 all give that direction, and the printed intervals reproduce the printed t values, so the signs in the table are not typesetting slips. Only the abstract sentence states the reverse. Because the abstract is the part most often read and indexed, readers who rely on it get the direction of a secondary finding backwards; the estimates themselves and the paper's main conclusions are unaffected.
What the paper reports
Abstract, results paragraph:
Higher education also modified the negative impact of tau-PET on cortical thinning, while older age was associated with higher baseline cortical thickness and slower rate of cortical thinning independent of tau.
For contrast, the same abstract paragraph gives the cognitive-resilience result with the favourable direction attached to younger age:
Younger age, higher education and greater cortical thickness were associated with better cognitive performance at baseline.
Results, "Brain resilience", first paragraph:
In models that estimated main effects (i.e. after removing the three-way interaction term), older age was related to thinner cross-sectional AD-signature cortex [stβ (95%CI) = -0.49 (-0.613,-0.366), P < 0.001] and to accelerated cortical thinning [stβ (95%CI) = -0.051 (-0.083,-0.02), P < 0.01] independent of temporal meta-ROI tau.
Results of analyses with global tau burden were consistent with these findings (Supplementary Table 5).
Table 3 ("Results of linear mixed-effect models investigating determinants of brain resilience to tau burden in the temporal meta-ROI"), Age row. Columns: Time × Tau × Variable β (unstandardized | standardized | t | P), Time × Variable β (same four), Variable β (same four):
Agea | 0.001 (-0.001,0.002) | 0.009 (-0.021,0.038) | 0.566 | 0.572 | -0.001 (-0.002,0) | -0.051 (-0.083,-0.02) | -3.182 | 0.002 | -0.012 (-0.015,-0.009) | -0.49 (-0.613,-0.366) | -7.774 | <0.001
Table 3 footer, on coding of the outcome and predictors:
Time (years), temporal meta-ROI tau (SUVR), age at baseline (years), educational level (years of education) and ICV (dm3) were centred and used in continuous form
The ‘Time × Variable β’ and ‘Variable β’ coefficients are main effects from models where the non-significant interaction term was removed.
Methods, "Determinants":
For the current study, age (in years) was defined as the age at the time of the tau-PET scan
Discussion, first paragraph:
While there was no evidence for age as a moderator in brain resilience models, older age was associated with lower cortical thickness at the time of the tau-PET scan, and with faster cortical thinning over time.
Discussion, "Age and cortical thickness":
we found that younger age was associated with both higher baseline cortical thickness and slower rate of cortical thinning at similar levels of tau burden.
Conclusion:
we found that age, education, ICV and cortical thickness play a role in cognitive resilience, while age and education contribute to brain resilience.
What the paper's own numbers show
Method. The outcome of the Table 3 models is AD-signature cortical thickness in mm (a higher value is a thicker cortex), and age is continuous, centred, in years. A negative Age coefficient therefore means a thinner cortex at the tau-PET scan for older participants, and a negative Time × Age coefficient means a more negative thickness slope, i.e. faster thinning, for older participants. The abstract's sentence requires both coefficients to be positive. To check that the printed signs belong to the printed statistics, I recomputed each standard error from its 95% CI (SE = (upper − lower)/(2 × 1.96)), the t value and P value that follow, and conversely the CI implied by the printed β and t. I also checked that the unstandardized and standardized rows agree, and repeated the sign check on Supplementary Table 5 (global tau, global thickness). Raw data are not available, so the models themselves cannot be refitted. Every number below is printed by recompute.py.txt.
| Quantity | Location | Reported | Recomputed from the paper's numbers |
|---|---|---|---|
| Age → baseline thickness, standardized β | Table 3; Results | −0.49 (−0.613, −0.366), t = −7.774, P < 0.001 | CI midpoint −0.4895; SE 0.0630; t −7.78; P ≈ 7.5 × 10⁻¹⁵; negative, CI excludes 0 |
| Time × Age → rate of thinning, standardized β | Table 3; Results | −0.051 (−0.083, −0.02), t = −3.182, P = 0.002 (Results: P < 0.01) | CI midpoint −0.0515; SE 0.0161; t −3.17; P ≈ 0.0015; negative, CI excludes 0 |
| CI rebuilt from printed β and t | Table 3 | as above | Age −0.614 to −0.366; Time × Age −0.082 to −0.020 (match the printed CIs) |
| Age, unstandardized (mm per year of age) | Table 3 | −0.012 (−0.015, −0.009) | t −7.84 from the CI; negative; 10 years older ≈ 0.12 mm thinner at the tau-PET scan |
| Time × Age, unstandardized | Table 3 | −0.001 (−0.002, 0) | negative; t from the CI is only −1.96 because the values are rounded to 3 decimals |
| Agreement of standardized and unstandardized rows | Table 3 | — | −0.49 / −0.012 = 40.8; a printed −0.001 (−0.0015 to −0.0005) × 40.8 = −0.061 to −0.020, which contains the printed −0.051 |
| Expected thickness gap, 1 SD older vs average age, average tau | Table 3 model without the three-way term | — | −0.49 SD at the tau-PET scan; −0.567 SD at the median MRI follow-up (18 months); −0.758 SD at the longest (63 months): the gap widens |
| Age as moderator of the tau effect (Time × Tau × Age) | Table 3 | 0.009 (−0.021, 0.038), P = 0.572 | t 0.60 from the CI; not significant, consistent with "independent of tau" |
| Age → baseline thickness, global analysis | Supplementary Table 5 | −0.374 (−0.522 – −0.227), t = −5.001, P < 0.001 | t −4.97 from the CI; negative |
| Time × Age → rate of thinning, global analysis | Supplementary Table 5 | −0.044 (−0.084 – −0.003), t = −2.112, P = 0.036 | t −2.13 from the CI; negative |
| Direction stated in the abstract | Abstract | older → higher baseline thickness, slower thinning | requires Age β > 0 and Time × Age β > 0; both printed coefficients are < 0 |
Figure
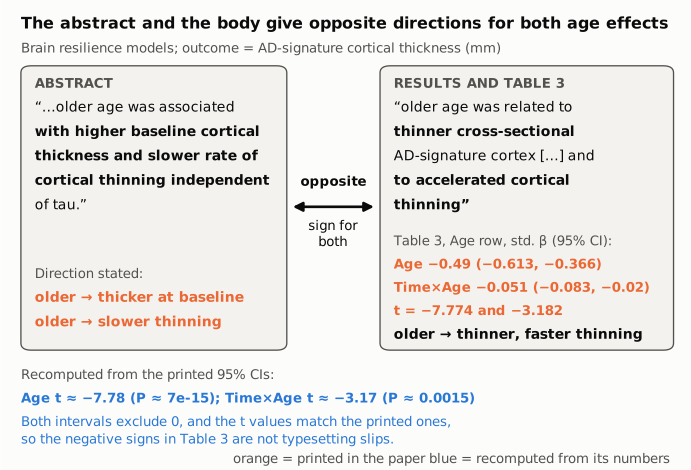
Figure 1. The left panel holds the abstract's sentence on age and brain resilience and the direction it states. The right panel holds the Results sentence and the Table 3 Age row (standardized β with 95% CI and t), all as printed (orange). The connector marks the conflict: the two panels give opposite directions for both the baseline (cross-sectional) effect and the longitudinal (Time × Age) effect. The blue lines give the t and P values recomputed from the printed confidence intervals; they match the printed t values, so the negative signs are internally consistent within the table.
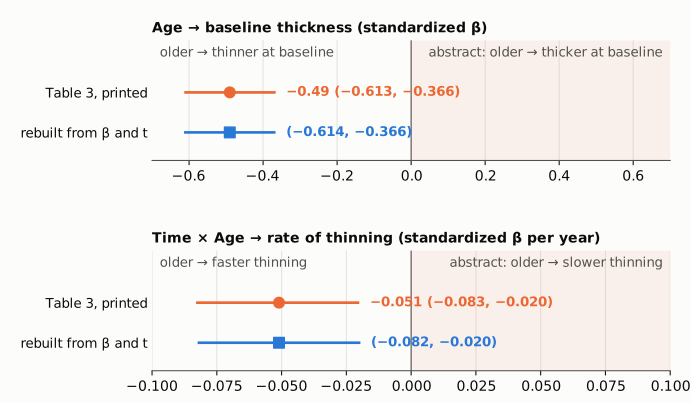
Figure 2. Each panel shows one Table 3 coefficient on its own symmetric axis, with zero as a thin reference line; the shaded half is the direction the abstract states (older age with thicker cortex, or with slower thinning). Orange circles and bars are the printed estimates and 95% CIs; blue squares and bars are the intervals rebuilt from the printed β and t (SE = β/t). Both intervals lie entirely on the negative side, away from the direction stated in the abstract.
Why it matters
- Direction, not magnitude. The error reverses the stated direction of two associations. The size and significance are printed correctly in the body: about 0.49 SD thinner AD-signature cortex per SD of age (about 0.012 mm per year of age), and a thickness slope about 0.051 SD per year more negative per SD of age. Both intervals exclude zero.
- It changes the reading of a resilience finding. As written, the abstract says older age is associated with preserved brain structure, which a reader would take as older age conferring brain resilience. The paper's actual finding is the conventional one, which its Discussion states: younger age goes with thicker cortex and slower thinning at similar tau burden, as an additive effect rather than a moderator.
- Where it sits. The abstract is the part of the paper that most readers, databases and evidence syntheses use. Someone who takes the age-resilience association from the abstract alone gets the sign wrong, and nothing in the abstract signals the conflict. The Conclusion's "age and education contribute to brain resilience" gives no direction, so read with the abstract it carries the reversed direction too.
- What it does not affect. The headline result (education as the most robust determinant), the education moderation of tau-related thinning, the cognitive-resilience results and the age results in the body are not affected. Age did not moderate the tau–thinning relationship (P = 0.572), and the abstract's "independent of tau" is consistent with that.
Explanations considered
- The outcome is an atrophy score, so a negative coefficient means less atrophy. Ruled out. The Table 3 header names the outcome "AD-signature cortical thickness", the Methods compute cortical thickness with FreeSurfer as "the distance from the grey matter–white matter boundary to the corresponding pial surface", the Table 2 footer gives AD-signature cortical thickness in mm, and the Results describe tau uptake as "significantly negatively associated with cortical thinning". A negative coefficient is a thinner cortex.
- Age is reverse-coded or entered as a "younger" indicator. Ruled out. The Methods define age as age in years at the tau-PET scan, and the Table 3 footer says it was centred and used in continuous form.
- The abstract describes a different model (full model, global tau, sensitivity analysis). Not supported. The Table 3 footer and the Results say the age main effects come from the model without the non-significant three-way term, which matches the abstract's "independent of tau". The global-tau analysis (Supplementary Table 5) gives negative age coefficients as well (−0.374 and −0.044). No analysis in the paper or the supplement reports a positive age effect on thickness or a slower thinning rate with age.
- The table signs are typos and the abstract is right. Ruled out. The printed CIs reproduce the printed t values (−7.78 vs −7.774; −3.17 vs −3.182), the unstandardized and standardized rows agree in sign and scale, and the Results and two Discussion passages describe the same negative direction in words.
- The sentence means "younger age" was associated with thicker cortex and slower thinning. That is what the body reports, and it is also how the Discussion phrases it ("younger age was associated with both higher baseline cortical thickness and slower rate of cortical thinning"). The abstract, however, says "older age". As printed, the abstract sentence states the opposite of the paper's results.
- A conversion or archiving artifact. Ruled out. The publisher's version of record, the PMC page, the Europe PMC full-text XML and the PMC archive used here all carry the same abstract wording.
- Already corrected. No correction, erratum or other notice was found (see Status).
Status
As of 2026-10-23:
- Version of record. The DOI resolves to the publisher's version of record (Brain 146(9):3719). Its abstract carries the same sentence ("older age was associated with higher baseline cortical thickness and slower rate of cortical thinning independent of tau"), and its Results and Table 3 carry the same negative coefficients quoted above. The PMC page, the Europe PMC full-text XML and the PMC archive agree word for word.
- Supplementary material. The single supplementary file (awad100_supplementary_data.pdf, retrieved from Europe PMC) was read. Supplementary Table 5 (global tau, global cortical thickness) reports negative age coefficients for both baseline thickness and thinning rate, and nothing in the supplement supports the abstract's direction.
- Corrections and notices. Crossref (no update-to or updated-by relations; Crossref now includes Retraction Watch data), PMC and Europe PMC notice records, and PubMed CommentsCorrections list no correction, erratum, expression of concern or retraction. The publisher's article page shows none; its "Corrected and typeset" date is a production date. None of the 51 citing records in Europe PMC is a correction, comment or reply.
- PubPeer. The PubPeer API returned 403 to automated requests, so a direct search could not be completed. Web searches for a correction, erratum or PubPeer thread on this article found none.
- Sources. The article as archived in PMC (PMC10473572); the publisher's version of record; the supplementary data file; Crossref, PMC, Europe PMC and PubMed records.
Suggested correction
In the abstract, change the sentence so that it states the direction reported in Table 3, the Results and the Discussion, for example:
Higher education also modified the negative impact of tau-PET on cortical thinning, while older age was associated with lower baseline cortical thickness and faster rate of cortical thinning independent of tau.
Equivalently, "younger age was associated with higher baseline cortical thickness and slower rate of cortical thinning independent of tau", which matches the wording of the Discussion. No change to the estimates, tables or conclusions appears to be needed.