← Back to the plain-language case
PIK3CA progression-free survival P = 0.016 cannot be derived from its reported HR and CI
BMC Med (2023) · doi:10.1186/s12916-023-03017-z · PMC10426213
Summary
This longitudinal ctDNA analysis of the phase Ib MONALEESASIA trial reports that patients with baseline PIK3CA alterations had shorter median progression-free survival (PFS) than patients without them, 12.7 vs 19.2 months, with P = 0.016. The Abstract gives this P value alongside the TP53 result and concludes that PIK3CA alterations "were associated with inferior outcomes". In the Results, the same P value is printed next to a hazard ratio of 0.93 (95% CI 0.52–1.69) in a sentence that calls the difference "not statistically significant". A Wald test back-calculated from that HR and CI gives z = −0.24 and P = 0.81, while the same check reproduces the paper's P values for TP53, bTMB and ctDNA detectability. The PIK3CA association in the Abstract therefore has no statistical support in the paper's own estimate. The paper's main findings on ctDNA monitoring do not depend on it.
What the paper reports
Abstract, Results:
Patients with alterations in PIK3CA and TP53 at baseline had shorter median progression-free survival compared with patients with wild-type PIK3CA and TP53, 12.7 and 7.3 months vs 19.2 and 19.4 months, respectively (P = .016 and P = .0001, respectively).
Abstract, Conclusions:
Higher ctDNA levels and PIK3CA and TP53 alterations detected at baseline were associated with inferior outcomes.
Results, "Gene alterations at baseline" (the PIK3CA and TP53 sentences, with the bTMB sentence that follows):
Median PFS of patients with TP53 mutations was significantly shorter than those without TP53 mutations (7.3 months vs 19.4 months; HR, 0.26; 95% CI, 0.12–0.53; P < 0.001; Fig. 7A). Median PFS of patients with PIK3CA mutations was 12.7 months vs 19.2 months for those without PIK3CA mutations; however, the difference was not statistically significant (HR, 0.93; 95% CI, 0.52–1.69; P = 0.016; Fig. 7B). Patients with undetectable ctDNA experienced a median PFS of 37.8 months (Fig. 7B).
In patients with detectable ctDNA, the median PFS of patients with high bTMB (> 10 mutations per megabase [mut/Mb]) was 12.7 months vs 19.4 months for those with low bTMB (< 10 mut/Mb); this numerically shorter PFS difference was not statistically significant (HR, 0.83; 95% CI, 0.46–1.5; P = 0.53; Fig. 7C).
Same paragraph, last sentence:
Therefore, in this particular cohort, neither bTMB nor PIK3CA status seems to provide an additional prognostic effect beyond ctDNA fraction.
Results, "ctDNA fraction by BOR and PFS" (used below as a control comparison):
More generally, patients with no detectable ctDNA at baseline had a PFS almost twice that observed in patients with detectable ctDNA at baseline: 38.0 months vs 19.2 months, respectively (hazard ratio [HR], 0.45; 95% CI, 0.24–0.84; P = 0.01; Fig. 1C).
Methods, "Statistical analysis":
A Cox proportional-hazards model was used to evaluate differences in PFS in the MONALEESASIA cohorts by ctDNA detectable vs undetectable status and mutation status in PIK3CA, TP53.
Methods, "Sample collection and ctDNA analysis":
All comparisons between mutated vs nonmutated (e.g., TP53 mutated vs nonmutated) were performed on patients with detectable ctDNA.
Figure 7 caption:
Progression-free survival for ribociclib plus ET in patients with or without mutations. A TP53. B PIK3CA. C High versus low TMB. Analysis by TMB (high versus low) only included patients with detectable ctDNA.
Figure 7 itself is an image. In the publisher's full-resolution file (12916_2023_3017_Fig7_HTML.png), panel B prints "P=. 016", panel A "P=.0001" and panel C "P=.53". Panels A and B each draw three Kaplan–Meier curves (mutated, nonmutated and "not detected/low power"); panel C draws two. The numbers at risk at time 0 are 12, 42 and 28 in panel A, 24, 30 and 28 in panel B, and 27 and 27 in panel C.
What the paper's own numbers show
Method. For a Cox model, a 95% Wald confidence interval is exp(b ± 1.96·SE), where b is the log hazard ratio. The standard error can therefore be recovered from the printed limits as SE = (ln upper − ln lower) / (2 × 1.96). The Wald statistic is z = ln(HR) / SE, and the two-sided P value is 2·(1 − Φ(|z|)). I applied this to all four PFS hazard ratios that the paper prints with a CI and a P value, using the three non-PIK3CA comparisons as controls for the method. I checked that each printed HR sits at the log-scale midpoint of its CI, that rounding of the printed values cannot move the result, and what HR or CI a P value of 0.016 would require. Every number below is printed by recompute.py.txt.
| Quantity | Location | Reported | Recomputed from the paper's numbers |
|---|---|---|---|
| PIK3CA mutated vs nonmutated, P | Results; Abstract; Fig. 7B | HR 0.93 (95% CI 0.52–1.69); P = 0.016 | SE(ln HR) = 0.301, z = −0.24, Wald P = 0.81 |
| PIK3CA: rounding range of HR and CI limits | derived | HR 0.93, CI 0.52–1.69 | over HR 0.925–0.935 and limits ±0.005: P = 0.79–0.83 |
| PIK3CA: CI log-midpoint | derived | HR 0.93 | 0.937, so the HR and CI fit each other |
| PIK3CA: |z| that P = 0.016 implies | derived | P = 0.016 | |z| = 2.41, ten times the 0.24 that the CI gives |
| PIK3CA: CI that P = 0.016 would need at HR 0.93 | derived | CI 0.52–1.69 (SE 0.301) | SE 0.030, CI 0.877–0.987 (one tenth of the printed width) |
| PIK3CA: HR that P = 0.016 would need with the printed CI width | derived | HR 0.93 | 0.485 (CI 0.27–0.87) or 2.063 (CI 1.14–3.72) |
| TP53 mutated vs nonmutated, P (control) | Results; Abstract; Fig. 7A | HR 0.26 (0.12–0.53); P < 0.001 (Results), P = .0001 (Abstract, Fig. 7A) | z = −3.55, Wald P = 0.00038: consistent with < 0.001 |
| bTMB high vs low, P (control) | Results; Fig. 7C | HR 0.83 (0.46–1.5); P = 0.53 | z = −0.62, Wald P = 0.54: consistent |
| ctDNA undetectable vs detectable, P (control) | Results; Fig. 1C | HR 0.45 (0.24–0.84); P = 0.01 | z = −2.50, Wald P = 0.012: consistent |
| Numbers at risk at time 0 | Fig. 7A / 7B / 7C | 12 + 42 + 28; 24 + 30 + 28; 27 + 27 | 82, 82 and 54; the mutated vs nonmutated comparisons use the 54 patients with detectable ctDNA |
| Median PFS, undetectable ctDNA | Results (Fig. 1C text vs Fig. 7B text) | 38.0 months; 37.8 months | differ by 0.2 months (minor, separate from the P value issue) |
The method reproduces three of the four printed P values to within rounding. The PIK3CA value is the exception, by a factor of about 50 in P and 10 in z. The PIK3CA confidence interval contains 1, and an HR of 0.93 is close to no difference, so the Results sentence's own description ("not statistically significant") matches the HR and CI. It does not match the P value printed in the same parentheses.
Figure
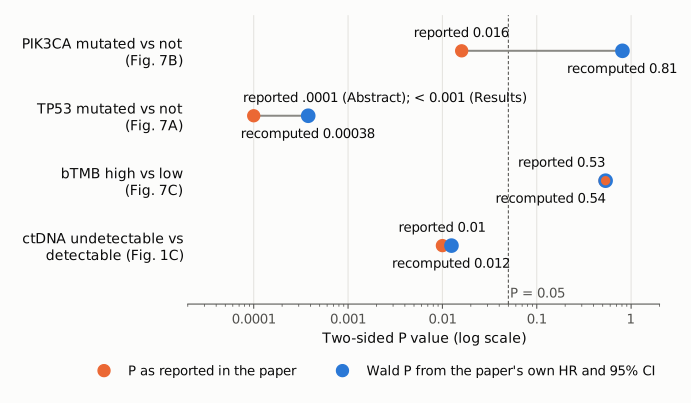
Figure 1. For each of the four PFS comparisons that the paper reports with an HR, a 95% CI and a P value, the orange dot is the P value printed in the paper and the blue dot is the two-sided Wald P value recomputed from that HR and CI. The axis is logarithmic; the dashed line marks P = 0.05. For TP53 the orange dot is the Abstract and Figure 7A value (.0001); the Results give P < 0.001, which the recomputed 0.00038 satisfies. For bTMB and ctDNA detectability the two values coincide within rounding. For PIK3CA the printed P = 0.016 lies on the other side of 0.05 from the P = 0.81 that its own HR and CI imply.
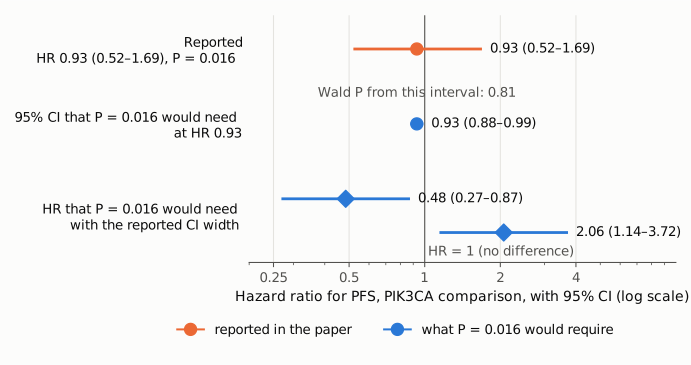
Figure 2. The PIK3CA hazard ratio on a log scale, with HR = 1 as the reference line. Orange: the reported HR 0.93 with its 95% CI 0.52–1.69, which gives Wald P = 0.81. Blue: what P = 0.016 would require, either a CI one tenth as wide around the same HR (0.88–0.99), or, with the reported CI width, an HR of 0.48 or 2.06 whose interval excludes 1. Neither resembles the reported estimate, so a misprint in the HR alone or in one CI limit alone cannot produce the printed P value.
Why it matters
The PIK3CA result appears in the Abstract's Results with P = .016, paired with the TP53 result, and the Abstract's Conclusions list PIK3CA alterations among the baseline features "associated with inferior outcomes". A reader of the Abstract would take PIK3CA as a statistically supported adverse prognostic marker in this cohort. If the hazard ratio and confidence interval are correct, the comparison gives P ≈ 0.81 and an HR close to 1 with a wide interval (0.52–1.69). On that reading the data show no evidence of a PFS difference by PIK3CA status among patients with detectable ctDNA, which is also what the Results sentence and the paragraph's closing statement ("neither bTMB nor PIK3CA status seems to provide an additional prognostic effect beyond ctDNA fraction") say.
The effect is limited to this result. The full-text Conclusions do not rely on PIK3CA, and the Discussion describes the PIK3CA effect as "numerically shorter". The paper's main findings are unaffected: the decline of ctDNA on treatment, the relation between baseline ctDNA and PFS (HR 0.45, P = 0.01, reproduced as 0.012), the lead time of ctDNA increase before radiological progression, and the TP53 association (reproduced as P = 0.00038). The Discussion sentence "Patients with alterations in these genes experienced a shorter median PFS compared with patients with wild-type versions" remains true as a statement about medians but has no statistical support for PIK3CA.
A smaller point of interpretation: the printed HRs for TP53 (0.26), PIK3CA (0.93) and bTMB (0.83) are all below 1 although the mutated or high-bTMB groups have the shorter medians. They therefore appear to express the nonmutated or low-bTMB group relative to the other (for PIK3CA, about 1.08, 95% CI 0.59–1.92, mutated vs nonmutated). The direction does not change any P value in this write-up.
Explanations considered
- Typographical error in the HR or one CI limit. This does not account for the numbers. The printed HR lies at the log-scale midpoint of its CI (0.937 vs 0.93), so the three numbers fit each other. With the printed CI width, P = 0.016 would need an HR of 0.485 or 2.06; at HR 0.93 it would need a CI of 0.88–0.99. Changing any one printed number by a plausible typo does not get close.
- Rounding. This does not account for the numbers. Over the full rounding range of the HR and both limits, the Wald P stays between 0.79 and 0.83.
- A different test (for example a log-rank or likelihood-ratio test) for the same two groups. This is unlikely to account for the numbers. For a single two-group Cox comparison, Wald, score (log-rank) and likelihood-ratio tests usually agree closely; a gap from P = 0.81 to P = 0.016 would be extraordinary. The same Wald check reproduces the paper's P values for bTMB and for ctDNA detectability, which are two-group comparisons of similar size.
- The P value in Figure 7B is a three-group test that includes the ctDNA-undetectable patients. This is the most likely source of the number, but it is not confirmed. Panels 7A and 7B each draw three curves (mutated, nonmutated, and "not detected/low power", median PFS 37.8 months in the undetectable group), and the Methods name no test for the figures. The P values printed in those two panels fit a global test better than the pairwise one. A rough approximation that adds the 1-df detectable-vs-undetectable Wald component (χ² = 6.24, from Fig. 1C) to the pairwise component gives a 2-df P of about 0.04 for the PIK3CA panel (printed .016; 8.27 is needed for exactly 0.016) and about 0.00008 for the TP53 panel (printed .0001), whereas the pairwise TP53 Wald P is 0.00038. Panel 7C, which has only two curves, prints P = .53, matching its pairwise HR. If this is the explanation, the printed P = 0.016 tests whether PFS differs among the three groups, a difference driven largely by the long PFS of patients with undetectable ctDNA. It does not test PIK3CA mutated vs nonmutated, so it cannot support the Abstract's comparison "with wild-type PIK3CA", nor sit alongside an HR that the Methods say is computed only in patients with detectable ctDNA. The approximation ignores the correlation between components, so it shows only that the order of magnitude fits.
- A conversion or typesetting error in the archived text. This is excluded. The PMC text, the publisher-supplied JATS XML in Europe PMC, and the publisher's Figure 7 image all carry P = .016 for PIK3CA.
- The value is explained in a supplement. This is excluded. Neither supplementary file reports PIK3CA survival statistics (see Status).
Status
- Version of record. I compared the PMC-archived text with the publisher-supplied JATS XML in Europe PMC (PMC10426213/fullTextXML). Both carry the Abstract, Results and Methods sentences quoted above with identical values. I also read the publisher's full-resolution Figure 7 image (media.springernature.com, 12916_2023_3017_Fig7_HTML.png) for the printed P values, curves and numbers at risk. The Springer HTML and PDF pages could not be fetched automatically: they redirect to a cookie-authorization page. Every quotation above was confirmed verbatim against the PMC-archived text with
src/show.py, except the Figure 7 panel contents, which were read from the image. - Supplements. Additional file 1 (12916_2023_3017_MOESM1_ESM.xlsx) is the 572-gene panel list (eTable 2). Additional file 2 (12916_2023_3017_MOESM2_ESM.docx) holds Supplementary Table 1 (cfDNA samples per cohort), Supplementary Table 2 (ctDNA change vs tumor change by response group) and Supplementary Fig. 1. Neither reports PIK3CA PFS, HRs or P values, and there is no patient-level survival data, so the correct P value cannot be computed from published material.
- Corrections and comments. As of 2026-10-23 I found no correction, erratum, expression of concern or retraction. Crossref lists no update relations for the DOI, and PMC and Europe PMC list no correction notices. A web search for corrections or comments on the article found none. The PubPeer API and search page refused automated access (Cloudflare challenge and HTTP 403), so PubPeer could not be checked directly.
- Sources. PMC article PMC10426213; Europe PMC full-text XML for PMC10426213; publisher Figure 7 image and supplementary files from static-content.springer.com; Crossref; Europe PMC; trial registration NCT02333370 (cited in the paper).
Suggested correction
- Report the two-group Cox P value for PIK3CA mutated vs nonmutated among patients with detectable ctDNA, which the printed HR 0.93 (95% CI 0.52–1.69) implies is about 0.8, in the Results sentence and in the Abstract.
- Revise the Abstract's Results and Conclusions so that PIK3CA alterations are not presented as associated with inferior PFS on the basis of P = .016, for example by limiting the statistical association to TP53 and describing the PIK3CA difference in medians as not statistically significant.
- State in the Methods or the Figure 7 legend which test produced the P values printed on Figure 7A and 7B. If they are global tests across three groups including the ctDNA-undetectable patients, say so, and do not cite them as mutated vs wild-type comparisons.
- State the reference group of the hazard ratios (the HRs below 1 appear to compare nonmutated or low-bTMB patients with the others).
- Minor: reconcile the median PFS for patients with undetectable ctDNA (38.0 months in the Fig. 1C text, 37.8 months in the Fig. 7B text), or explain the difference.